báo cáo hóa học: " Comparing the SF-12 and SF-36 health status questionnaires in patients with and without obesity" pot
Bạn đang xem bản rút gọn của tài liệu. Xem và tải ngay bản đầy đủ của tài liệu tại đây (507.18 KB, 7 trang )
BioMed Central
Page 1 of 7
(page number not for citation purposes)
Health and Quality of Life Outcomes
Open Access
Research
Comparing the SF-12 and SF-36 health status questionnaires in
patients with and without obesity
Christina C Wee*, Roger B Davis and Mary Beth Hamel
Address: Division of General Medicine and Primary Care, Department of Medicine, Beth Israel Deaconess Medical Center, Harvard Medical School,
Boston, Massachusetts, USA
Email: Christina C Wee* - ; Roger B Davis - ;
Mary Beth Hamel -
* Corresponding author
Abstract
Objective: To assess how well the SF-36, a well-validated generic quality of life (QOL) instrument,
compares with its shorter adaptation, the SF-12, in capturing differences in QOL among patients
with and without obesity.
Methods: We compared the correlation between the physical (PCS) and mental (MCS)
component summary measures of the SF-12 and SF-36 among 356 primary care patients using
Pearson coefficients (r) and conducted linear regression models to see how these summary
measures captures the variation across BMI. We used model R
2
to assess qualitatively how well
each measure explained the variation across BMI.
Results: Correlations between SF-12 and SF-36 were higher for the PCS in obese (r = 0.89)
compared to overweight (r = 0.73) and normal weight patients (r = 0.75), p < 0.001, but were
similar for the MCS across BMI. Compared to normal weight patients, obese patients scored 8.8
points lower on the PCS-12 and 5.7 points lower on the PCS-36 after adjustment for age, sex, and
race; the model R
2
was higher with PCS-12 (R
2
= 0.22) than with PCS-36 (R
2
= 0.16). BMI was not
significantly associated with either the MCS-12 or MCS-36.
Conclusion: The SF-12 correlated highly with SF-36 in obese and non-obese patients and
appeared to be a better measure of differences in QOL associated with BMI.
Background
In addition to its etiologic role in many common medical
conditions, obesity has profound adverse physical, social,
and economic consequences that can negatively affect
quality of life, an increasingly important outcome consid-
ered by patients, clinicians, and policymakers alike. As a
result, quality of life has become an important endpoint
assessed in studies of obesity and weight loss interven-
tions.
One of the most straightforward ways of measuring qual-
ity of life (QOL) is through the use of health status meas-
ures where patients are asked to rate different aspects of
their life. Perhaps the most commonly used measure in
QOL research is the Short-Form 36 or SF-36, a generic
measure developed and validated in the Medical Out-
comes Study to assess important QOL domains relevant
to patients suffering from a wide range of medical condi-
tions [1]. The SF-36 consists of eight QOL domains that
comprise two summary measures – the physical compo-
Published: 30 January 2008
Health and Quality of Life Outcomes 2008, 6:11 doi:10.1186/1477-7525-6-11
Received: 22 August 2007
Accepted: 30 January 2008
This article is available from: />© 2008 Wee et al; licensee BioMed Central Ltd.
This is an Open Access article distributed under the terms of the Creative Commons Attribution License ( />),
which permits unrestricted use, distribution, and reproduction in any medium, provided the original work is properly cited.
Health and Quality of Life Outcomes 2008, 6:11 />Page 2 of 7
(page number not for citation purposes)
nent summary and the mental component summary. One
of the major advantages of using the SF-36 in studies of
obesity is that it allows for QOL scores to be compared to
scores in other common diseases. However, because the
SF-36 was not originally designed to measure important
QOL domains specific to obesity, a number of studies
have found the SF-36, particularly the mental component
summary, to be relatively insensitive to variations in body
weight cross-sectionally or to changes in weight over time
[2-4]. As a consequence, obesity-specific health measures
such as the Impact of Weight on Quality of Life and the
Moorehead-Ardelt QOL Questionnaire have been devel-
oped to address these limitations [5-7]. However, because
of their specificity, these instruments cannot be used to
compare the QOL impact of obesity and changes in
weight with the QOL impact of other diseases. Thus, stud-
ies of obesity may need to include a combination of dif-
ferent instruments especially when QOL is a primary
outcome. This approach, however, can pose a high bur-
den on participants and may affect study participation
rates and the cost of conducting research.
To address the considerable burden placed on respond-
ents and investigators generically, Ware and colleagues
developed a substantially shorter questionnaire, the SF-
12, which utilized a reduced number of items from 36 to
12. The SF-12 can be completed by most participants in
less than a third of the usual time needed to complete the
SF-36 [8]. Ware found the two instruments to be highly
correlated and both the physical and mental component
summary measures in the SF-12 explained about 90% of
the variation in the same summary measures of the SF-36
[8,9]. Subsequent studies [10-12] comparing the two
instruments have suggested varying results depending on
the disease or health condition of interest. While the two
measures performed similarly in studies of patients with
cardiac and pulmonary conditions, the mental compo-
nent summary score correlated less well in studies on
arthritis [10-12]. Whether the SF-12 and SF-36 can be
used interchangeably for studies in obesity is unclear.
In this context, we compared the SF-12 and the SF-36 in a
cross-sectional sample of primary care patients of varying
body weights to examine the correlation between the two
instruments and their performance in measuring differ-
ences in QOL among patients with and without obesity.
Methods
Study Sample
We conducted a 25-minute telephone interview of a ran-
dom sample of 366 patients seen at a large hospital-based
primary care practice in Boston between November 2001
and June 2003. The goal of the study was to describe the
quality of life and weight-related health behaviour of pri-
mary care patients and to quantify the value they placed
on different levels of weight loss. Eligible patients were 18
years and older, English-speaking, and free from terminal
or serious illness that would prevent them from partici-
pating. Details on subject recruitment and sampling have
been published elsewhere [13,14]. The response rate was
60%. This present study includes the 356 subjects with
complete information on quality of life measures. The
study was approved by the Institutional Review Board
(IRB) at Beth Israel Deaconess Medical Center (#2001-P-
000119). Verbal informed consent was obtained for pub-
lication from the participants and/or their relatives as
approved by the IRB.
Data Collection and Measures
The telephone interview was administered by trained
interviewers and ascertained information such as patient
demographics, height, weight, comorbid illness, and
quality of life. We calculated body mass index (BMI) from
self-reported height and weight and categorized respond-
ents as normal weight, overweight, and obese according to
standard guidelines [15]. Quality of life (QOL) was
assessed using the Short-Form 36 or SF-36, a generic
health status instrument with 36 items comprising eight
subscales – physical functioning, role functioning (physi-
cal and emotional), bodily pain, general health, vitality,
social functioning, and mental health. Using standard
methods [1], we calculated the two summary measures
that comprise the SF-36: the physical component sum-
mary (PCS-36) and the mental component summary
(MCS-36). Scores of each subscale are calculated based on
the response to individual items comprising that subscale;
the subscales are then standardized using a z-score trans-
formation and aggregated to estimate the aggregated
physical and mental summary scores. While all eight sub-
scales contribute to both summary scores, the physical
component summary score is more heavily weighted by
the physical functioning subscale followed by physical
role function, bodily pain, general health and vitality sub-
scales whereas the mental component summary score is
driven by the mental health subscale followed by emo-
tional role functioning, social functioning and the vitality
subscales. We also calculated SF-12 component summary
scores (PCS-12 and MCS-12) using SF-12 items embed-
ded in the SF-36 [1]. This approach has been shown to be
equivalent to calculating SF-12 derived from the SF-12 as
a standalone questionnaire [8,16]. All four summary
scores range from 0–100 where higher scores indicated
better QOL.
Data Analysis
For each respondent, we calculated the PCS-12, MCS-12,
PCS-36, and MCS-36 score based on responses to the rel-
evant items. We then calculate the mean PCS-12, MCS-12,
PCS-36, and MCS-36 score for the overall study sample.
To examine how well the PCS-12 correlated with the PCS-
Health and Quality of Life Outcomes 2008, 6:11 />Page 3 of 7
(page number not for citation purposes)
36 and how well the MCS-12 correlated with the MCS-36
among different BMI groups, we determined the Pearson
correlation coefficient to describe the correlation between
the respective measures stratified by BMI. To determine
whether these correlations between the two PCS and MCS
measures were significantly different among BMI groups,
we tested the homogeneity of correlations across BMI cat-
egories using the method described by Zar, et al [17]. We
then used linear regression models to explain how the
PCS-12 and MCS-12 scores varied relative to PCS-36 and
MCS-36 scores, respectively. We tested for an interaction
between the SF-12 summary scores and age, sex, race, and
BMI to examine whether the relationship between PCS-12
and PCS-36 and between MCS-12 and MCS-36 might vary
depending on these factors.
To examine how well the summary measures from the SF-
12 and SF-36 performed in distinguishing respondents of
varying BMI, we first tested the unadjusted association
between BMI category and the four QOL summary meas-
ures using the Wilcoxon Rank Sum test. We then used lin-
ear regression modelling to examine the relationship
between BMI and these four QOL summary measures
after adjusting for age, sex, and race. We used the R-square
of each model (model R
2
) to assess the performance of the
component summary measures of the SF-12 and SF-36 in
discriminating among patients of different BMI category;
the higher the model R
2
, the better the summary score is
able to explain variations in quality of life associated with
BMI.
Results
Of 356 respondents, the mean age was 48.9 ± 0.83 years
(range 19–90) and the mean BMI was 27.8 ± 0.38 kg/m
2
.
Table 1 presents the additional characteristics of our study
sample and mean quality of life summary scores.
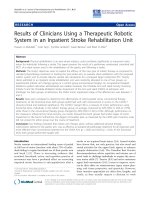
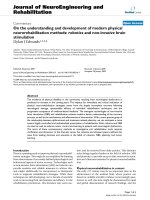
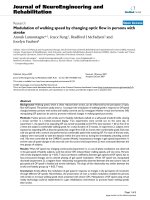
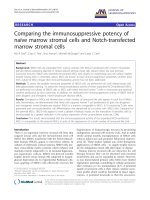
Figures 1 and 2 presents the correlation between PCS-12
and PCS-36 and between MCS-12 and MCS-36 for the
entire sample and by BMI group. The Pearson correlation
was 0.82 for the physical component summary scores and
0.95 for the mental component summary scores overall.
The correlation between PCS-12 and PCS-36 varied signif-
icantly according to BMI with the highest correlation
observed in patients who were obese (p < 0.001 for differ-
ences in correlation among the three BMI groups); the cor-
relations between MCS-12 and MCS-36 were very similar
across BMI.
Using linear regression, we estimated that PCS-12 and
MCS-12 can be derived from the respective PCS-36 and
MCS-36 using the following equations:
PCS-36 score = 0.66 (PCS-12 score) + 12.63 model R
2
=
0.67
MCS-36 score = 0.96(MCS-12) - 0.82 model R
2
= 0.89
The relationship between the two sets of summary meas-
ures did not vary significantly by age, sex, race or BMI,
although the interaction between PCS-12 and BMI cate-
gory approached statistical significance (p = 0.08).
Table 1 also shows the mean QOL scores across BMI cate-
gory. Before adjustment, BMI was significantly associated
with mean PCS-12 and PCS-36 scores but not for MCS-12
and MCS-36 scores (Table 1). After adjustment for age,
sex, and race, obese patients scored 5.7 points lower than
normal weight patients on the PCS-36, whereas over-
weight patients did not score significantly differently com-
pared to normal weight patients (Table 2), although the
Table 1: Study Population Characteristics (n = 356)
n (%)
Age, y
19–29 44 (12)
30–49 158 (43)
50–64 101 (28)
65 and older 62 (17)
Weight Category
Normal Weight (18.5 to 24.9 kg/m
2
)139 (39)
Overweight 117 (33)
Obese 98 (28)
Sex
Men 124 (35)
Women 232 (65)
Race/Ethnicity
White 245 (69)
Black 71 (20)
Hispanic 15 (4)
Asian 11 (3)
Other 12 (3)
Summary scores, mean (SD)
PCS-36
Overall 45.2 (8.0)
Normal weight 47.9 (6.6)
Overweight 45.4 (7.5)
Obese 41.3 (8.8)
PCS-12
Overall 49.7 (10.0)
Normal weight 54.1 (7.7)
Overweight 49.3 (9.2)
Obese 44.0 (10.8)
MCS-36
Overall 52.4 (10.1)
Normal weight 53.1 (9.4)
Overweight 52.7 (11.5)
Obese 51.0 (12.0)
MCS-12
Overall 55.3 (10.7)
Normal weight 55.7 (9.5)
Overweight 55.8 (10.8)
Obese 54.0 (12.0)
Health and Quality of Life Outcomes 2008, 6:11 />Page 4 of 7
(page number not for citation purposes)
Correlation Between the Physical Component Summary (PCS) Measures of the SF-12 and SF-36Figure 1
Correlation Between the Physical Component Summary (PCS) Measures of the SF-12 and SF-36.
Health and Quality of Life Outcomes 2008, 6:11 />Page 5 of 7
(page number not for citation purposes)
Correlation Between the Mental Component Summary (MCS) Measures of the SF-12 and SF-36Figure 2
Correlation Between the Mental Component Summary (MCS) Measures of the SF-12 and SF-36.
Health and Quality of Life Outcomes 2008, 6:11 />Page 6 of 7
(page number not for citation purposes)
overall trend between higher BMI category and lower
score was statistically significant (p < 0.001). In contrast,
obese patients scored 8.8 points lower and overweight
patients scored 4.0 points lower on the PCS-12 than nor-
mal weight patients (p-trend < 0.001). The model R
2
was
higher for BMI and PCS-12 (R
2
= 0.22) than for BMI and
PCS-36 (R
2
= 0.16), suggesting that when compared to
PCS-36, PCS-12 is better able to explain the variation in
quality of life among patients with different BMI. Body
mass index was not significantly associated with either
MCS-12 or MCS-36 although there was more of a sug-
gested trend between BMI group and MCS-36 (p = 0.05)
than with MCS-12 (p = 0.10). The model R
2
for both MCS-
12 (R
2
= 0.03) and MCS-36 (R
2
= 0.04) were extremely
low.
Discussion
Our study suggests that the SF-12 and SF-36 correlates
very highly regardless of BMI but especially among
patients with obesity. Moreover, the physical component
summary measure of the SF-12 (PCS-12) appeared to bet-
ter explain differences in quality of life (QOL) among
patients with different BMI than the PCS-36. Mental com-
ponent summary (MCS) scores on both the SF-12 and SF-
36 did not vary significantly by BMI.
Previous studies comparing the SF-12 and SF-36 in
patients with specific diseases or health conditions have
generally found moderate to high correlations between
the physical and mental component summary measures
of both instruments [8,9]. Ware et al reported high corre-
lations between the SF-12 and SF-36 among patients in
the Medical Outcomes Study [8,9]. Another longitudinal
study of over 2400 patients with heart disease found that
the Pearson correlations between both summary meas-
ures of the SF-12 and SF-36 ranged from 0.94 to 0.96 [10].
Moreover, all measures were sensitive to changes over
time. A smaller study of three groups of patients about to
undergo treatment for congestive heart failure, obstructive
sleep apnea, and surgical hernia repair respectively found
that the summary measures for both SF-12 and SF-36
across BMI performed similarly before and after treatment
[11].
Our findings show that BMI was strongly associated with
the physical component summary measure but not the
mental component summary measure of the SF-36 is sup-
ported by prior work [18,19]. Using data from the Medical
Outcomes Study, Katz and colleagues found that com-
pared to normal weight patients, overweight and obese
patients had larger decrements in subscales, with the larg-
est contribution to the physical component summary
measure such as physical function, physical role function,
general health, and vitality than the subscales that repre-
sent mental, emotional and social functioning [18]. Sub-
sequent studies [19] have largely confirmed these
findings. Fewer studies have used the SF-12 to examine
QOL differences across BMI, but one survey of primary
care patients by Finkelstein et al. found that PCS-12
decreased consistently with higher BMI above the normal
weight range but the relationship between BMI and MCS-
12 was curvilinear: persons who were overweight but not
obese had lower MCS-12 scores than those who were nor-
mal weight or obese [20]. To our knowledge, prior studies
have not directly compared the SF-12 and SF-36 within
the same study population.
Our study demonstrates high correlations between SF-12
and SF-36 in both the physical and mental component
summary measures regardless of BMI. While we expected
reasonably high correlations since the SF-12 is embedded
in the SF-36, we found that correlations between the SF-
12 and SF-36 for the physical component scales were actu-
ally highest among patients who were obese. We also
found that PCS-12 performed better than the SF-36 in
explaining variations in QOL across BMI. Since the MCS-
36 has been shown in this and other studies to be rela-
tively insensitive to differences in BMI, using the MCS-12
instead of MCS-36 is unlikely to produce poorer measure-
ment of obesity-related QOL. Taken together, these find-
ings suggest that the SF-12 may be an adequate substitute
for the SF-36 in studies on obesity with two caveats. First,
our study was cross-sectional and whether the SF-12
would be as sensitive as the SF-36 to changes in weight
over time is unclear, although our finding of greater vari-
ability across BMI for the PCS-12 as compared to the PCS-
36 is reassuring. Second, because of the brevity of the SF-
12 instrument, it is not possible to obtain reliable infor-
mation for each of the eight domains or subscales that
comprise the overall SF-12 so that one would not be able
to draw conclusions about specific domains that contrib-
ute to QOL as measured by the two component summary
measures.
Table 2: Difference in SF-12 and SF-36 component summary scores for overweight and obesity compared to normal weight after
adjustment for age, race, and sex.
PCS-12* PCS-36* MCS-12 MCS-36
Normal weight (BMI 18.5–<25 kg/m
2
) Reference Reference Reference Reference
Overweight (BMI >25 kg/m
2
) -4.0 -1.6 -0.4 -1.0
Obese (BMI >30 kg/m
2
) -8.8 -5.7 -2.6 -3.1
Health and Quality of Life Outcomes 2008, 6:11 />Page 7 of 7
(page number not for citation purposes)
Finally, our findings must also be interpreted in the con-
text of our study's limitations. We sampled patients from
one large academic primary care practice in Boston where
the BMI distribution of the population closely mirrors the
general US population. Whether our results would apply
to patients with more severe obesity, those actively seek-
ing weight treatments, or those from other geographic
regions are unclear. In addition, our BMI values were cal-
culated from self-reported height and weight and studies
suggest that some respondents, especially women, tend to
overestimate their height and underestimate weight lead-
ing to underestimation of BMI [21,22]; whereas others,
including men and older adults, tend to over report
weight [23]. These misclassifications will tend to bias
findings towards detecting no difference and might
underestimate potential differences observed across BMI.
Our multivariable models did adjust for these demo-
graphics factors. Finally, we administered our survey via
telephone in order to ensure a random sample and to
optimize participation. While this approach minimizes
barriers to survey participation such as low literacy, scor-
ing norms may differ between mail versus telephone
administered instruments [24]; however, findings related
to comparisons made between SF-12 and SF-36 in our
study are likely still valid.
Conclusion
Our study suggests that the SF-12 correlates highly with
the SF-36 in patients of all BMI groups and appears to per-
form at least as well as the SF-36 in cross-sectional set-
tings; hence, using the SF-12 in place of the SF-36 may be
appropriate, especially when other more obesity-specific
QOL measures are being used and when respondent bur-
den is a major concern. Future studies should validate our
findings longitudinally and in more diverse populations.
Competing interests
The author(s) declare that they have no competing inter-
ests.
Authors' contributions
CW conceived of the study, conducted the study, analyzed
and interpreted the data and drafted the manuscript. RD
and MBH contributed to the design and interpretation of
the analysis. All authors read and critically revised and
approved the final manuscript.
Acknowledgements
This study was supported by NIH grants K23 DK02962 and NIH P30
DK46200 (Boston Obesity and Nutrition Research Center).
References
1. Ware JE, Kosinski M, Dewey JE: How to Score Version Two of
the SF-36
®
Health Survey. Lincoln (RI): QualityMetric Incorpo-
rated; 2000.
2. Ballantyne GH: Measuring outcomes following bariatric sur-
gery: weight loss parameters, improvement in co-morbid
conditions, change in quality of life and patient satisfaction.
Obes Surg 2003, 13(6):954-64.
3. Horchner R, Tuinebreijer MW, Kelder PH: Quality-of-life assess-
ment of morbidly obese patients who have undergone a Lap-
Band operation: 2-year follow-up study. Is the MOS SF-36 a
useful instrument to measure quality of life in morbidly
obese patients? Obes Surg 2001, 11(2):212-8.
4. Corica Francesco, Corsonello Andrea, Apolone Giovanni, Lucchetti
Maria, Melchionda Nazario, Marchesini Giulio, the Quovadis study
group: Construct Validity of the Short Form-36 Health Sur-
vey and Its Relationship with BMI in Obese Outpatients.
Obesity 2006, 14(8):1429-1437.
5. Kolotkin RL, Head S, Hamilton M, Tse CTJ: Assessing impact of
weight on quality of life. Obes Res 1995, 3:49-56.
6. Kolotkin RL, Head S, Brookhart A: Construct validity of the
Impact of Weight on Quality of Life questionnaire. Obes Res
1997, 5:434-441.
7. Oria HE, Morehead MK: Bariatric Analysis and Reporting Out-
come System (BAROS). Obes Surg 1998, 8:487-499.
8. Ware JE, Kosinski M, Keller SD: SF-12: how to score the SF-12
physical and mental health summary scales. 3rd edition. Lin-
coln (RI): QualityMetric Incorporated; 1998.
9. Ware JE, Kosinski M, Keller SD: A 12-item short-form health sur-
vey. Med Care 1996, 34(3):220-3.
10. Muller-Nordhorn J, Roll S, Willich SN: Comparison of the short
form (SF)-12 health status instrument with the SF-36 in
patients with coronary heart disease. Heart 2004, 90(5):523-7.
11. Jenkinson C, Layte R, Jenkinson D, Lawrence K, Petersen S, Paice C,
Stradling J: A shorter form health survey: can the SF-12 repli-
cate results from the SF-36 in longitudinal studies? J Public
Health Med 1997, 19(2):179-86.
12. Hurst NP, Ruta DA, Kind P: Comparison of the MOS short
form-12 (SF12) health status questionnaire with the SF36 in
patients with rheumatoid arthritis. Br J Rheumatol 1998,
37(8):862-9.
13. Wee CC, Hamel MB, Davis RB, Phillips RS: Assessing the value of
weight loss among primary care patients. J Gen Intern Med
2004, 19(12):1206-11.
14. Wee CC, Davis RB, Phillips RS: Stage of readiness to control
weight and adopt weight control behaviors in primary care.
J Gen Intern Med 2005, 20(5):410-5.
15. National Heart, Lung, and Blood Institute: Clinical Guidelines on
the Identification, Evaluation, and Treatment of Overweight
and Obesity in the United States. Bethesda, MD: National Insti-
tutes ofHealth, NHLBI; 1998:1-228.
16. Scholfield MJ, Mishra G: Validity of the SF-12 compared with the
SF-36 health survey in pilot studies of the Australian longitu-
dinal study on women's health. J Health Psychol 1998,
3(2):259-71.
17. Zar JH: Biostatistical Analysis. 4th edition. Upper Saddle River,
NJ: Prentice Hall; 1999:390-392.
18. Katz DA, McHorney CA, Atkinson RL: Impact of obesity on
health-related quality of life in patients with chronic illness. J
Gen Intern Med 2000, 15(11):789-96.
19. Yancy WS Jr, Olsen MK, Westman EC, Bosworth HB, Edelman D:
Relationship between obesity and health-related quality of
life in men. Obes Res 2002, 10(10):1057-64.
20. Finkelstein MM: Body mass index and quality of life in a survey
of primary care patients. J Fam Pract 2000, 49(8):734-7.
21. Rowland ML: Self-reported weight and height. Am J Clin Nutr
1990, 52(6):1125-33.
22. Jefferey RW: Bias in reported body weight as a function of edu-
cation, occupation, health and weight concern. Addict Behav
1996, 21(2):217-222.
23. Villanueva EV: The validity of self-reported weight in US adults:
a population based cross-sectional study. BMC Public Health
2001, 1(1):11.
24. McHorney CA, Kosinski M, Ware JJ: Comparisons of the costs
and quality of norms for the SF-36 health survey collected by
mail versus telephone interview: results from a national sur-
vey.
Medical Care 1994, 32:551-67.