A review on remote sensing and GIS applications in soil resource management
Bạn đang xem bản rút gọn của tài liệu. Xem và tải ngay bản đầy đủ của tài liệu tại đây (201.76 KB, 13 trang )
Int.J.Curr.Microbiol.App.Sci (2020) 9(5): 1063-1075
International Journal of Current Microbiology and Applied Sciences
ISSN: 2319-7706 Volume 9 Number 5 (2020)
Journal homepage:
Review Article
/>
A Review on Remote Sensing and GIS Applications in
Soil Resource Management
V. Arunkumar*, M. Pandiyan and M. Yuvaraj
Agricultural College and Research Institute, Vazhavachanure, Tamil Nadu, India
*Corresponding author
ABSTRACT
Keywords
Planning strategies,
land management,
highly expensive
process
Article Info
Accepted:
10 April 2020
Available Online:
10 May 2020
Planning strategies for sustainable land management require solid base line
data on natural resources (soils, physiography, climate, vegetation, land
use, etc.) and on socio-economic aspects. Extensive and reliable
information on soil and land resources are prerequisites for efficient and
effective management planning of these vital natural resources. Generation
of large-scale spatial database on soil and land resources by conventional
method is a time consuming and highly expensive process. The application
of Remote sensing technology has been universally recognized as a highly
effective and inevitable tool for soil resource mapping and watershed
management.
Introduction
The modern tools of Remote Sensing (RS)
and Geographic Information System (GIS),
and Satellite based positioning systems
(popularly called GPS) are appropriate for
natural
resources
assessment
and
management. RS is the acquisition of
information about an object, a phenomena or
a process by noncontact method, usually from
airplanes or satellites, using sensors operating
in any portion of the electromagnetic
spectrum. The GIS allows inputting,
management, analysis and display of the data
collected by RS and other means. GPS
instruments are used to obtain precise
measurement of an object‟s location in terms
of longitude, latitude and altitude.
At global scale these technologies provide a
cost effective means to study the biosphere,
geosphere and atmospheric interactions. At
micro scale, space technology is providing
valuable inputs for developing land and water
resources. Monitoring of changes in the forest
cover using RS and drafting developmental
1063
Int.J.Curr.Microbiol.App.Sci (2020) 9(5): 1063-1075
plans for afforestation using GIS are good
examples of macro and micro-level
applications.1,2,3
bedrock whichever is shallow.
The availability of remotely sensed data from
different sensors of various platforms with a
wide range of spatiotemporal, radiometric and
spectral resolutions has made remote sensing
as, perhaps, the best source of data for large
scale applications and study. The exhaustive
data provided by remote sensing is now
serves as an input data for several
environmental process modeling.4,5 The
characterization and classification of soil
resources in Palar-Manimuthar watershed of
Tamil Nadu played a crucial role in optimal
utilization of natural resources on a sustained
basis. 6,7
It consists of several pedons of similar in
nature. It is also inferred soil individual or soil
series. It is the unit of soil mapping and
classification.
Polypedon
Mapping unit
It is the collection of areas defined and named
the same in terms of soil series / soil
association / types and phases of soil series.
Each map unit differs in some respect from
other areas identified on a soil map. Each
individual areas on the map is a delineation.
Taxonomic unit
Concepts of soil in soil resource mapping
soil
Soil is three dimensional, natural body,
modified by man of earth materials,
containing living matter and capable of
supporting plants out -of -doors. The upper
limit is air or shallow water. Lower limit is
normally hard rock or earthy materials
visually devoid of biological activity.
The taxonomic unit aimed for classifying the
soils above the level of soil series based on
diagnostic horizons, soil temperature and
moisture regimes, and particle size and
mineralogical classes in the control section. It
mostly considers the soil properties between
25 cm and 100 cm depth. Taxonomic unit are
order, suborder, great group, subgroup and
family.
Pedon
Base maps
It is the smallest body of one kind of soil,
hexagonal in shape which considers volume
of soil. Surface is roughly polygonal and
ranges from 1 m2 to 10 m2 in area, depending
upon the nature and variability of soil.
These are maps used for delineations of soil
boundaries. For traditional soil surveys, base
maps are toposheets and village maps. In
modern surveys, base maps generated from
aerial photographs and satellite data
(Photograhpic / digital) are employed.
Profile
Standard soil survey
It is the vertical section of pedon showing the
nature and arrangement of horizons. In soil
resource inventories soil horizons are
normally examined and described through
profiles. It is the unit of sampling within a
pedon. Profiles are examined upto 2m or
Standard soils survey is basically aimed at
studying and recording the morphological
characteristics of soils in the field and their
physical and chemical properties in the
laboratory, classifying them into well-defined
1064
Int.J.Curr.Microbiol.App.Sci (2020) 9(5): 1063-1075
units a delineating their boundaries on
standard scale of maps. Three types of soil
surveys are distinguished based on the scale
of base map, intensity of soil observation and
precision mapping.
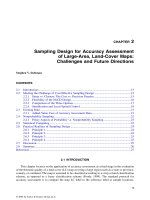
The steps involved the use of aerial
photography for soil mapping is given in
figure 1. Orthorectifiction has to be done if
rectified aerial photograph are not used in soil
mapping.
Soil resource data
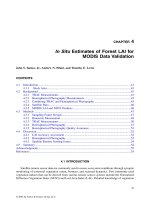
Use of satellite data for soil mapping
Site characteristics
Satellite imageries (Photographic format) and
digital data are used for soil mapping.
Satellite imageries are available in 1:1
million, 1: 250,000, 1: 50,000 and 1: 25,000
scales are available for generating soil maps
for different levels of planning. Summer
season FCC are preferable for soil mapping.
PAN merged LISS imageries are engaged in
detailed soil mapping. Just like the aerial
remote sensing, major land forms are
delineated first by using image interpretation
elements like texture, tone, shape, size,
association and pattern through light table.
Image interpretation units are identified. The
soil composition for each image interpretation
unit is then identified through field work
followed by soil analysis (Figure 2).
Geology, geomorphology, drainage, slope,
erosion, land use, natural vegetation, depth of
ground water table, stoniness, gravelliness,
presence or absence of salinity and alkalinity.
Morphological properties
Horizon thickness, colour, mottles, texture,
structure,
calcareousness,
concretions,
abundance and size of roots and pores,
permeability, presencec of clay films/ slicken
sides.
Analytical properties horizon wise (Table 2)
Use of aerial photograph in soil mapping
Among the different aerial photograph, black
and white, colour infra-red (IR) and colour
Infra-red (CIR) aerial photographs are used in
soil mapping. Aerial photographs with a scale
of 1: 40,000 to 1: 60, 000 for reconnaissance
soil mapping and 1: 10,000 to 1: 25, 000 for
detailed soil mapping are used. Aerial
photographs permit 3D view through
stereoscopes and hence slope, drainage
pattern, natural features like hills, valleys and
plains can be easily distinguished in a given
geological formation. Sub divisions of
landform (hlls, pediment, pediplain valley,
alluvial plain etc) can be delineated using
photo elements (slope, erosion, tone, texture,
density of reservation, land use etc.)
Physiographic units for each land form are
identified. The physiographic units are
studied in detail for the soil composition.
Digital image processing using supervised
classification and unsupervised classification
under maximum likelihood function are
employed for soil mapping. In supervised
classification, training sets (cluster of pixels
with known composition after field work) are
engaged in generation of soil maps. In case of
unsupervised classification, cluster map
showing the pixels with similar digital
number (DN) is prepared. Field work to
assess the soil composition is carried for each
cluster. This ground truth information is then
fed into the computer to generate soil maps.8,9
Soil maps
Soil survey maps: Maps generated out of
standard soil surveys using toposheets,
village maps, aerial photographic or
satellite data are published with suitable
1065
Int.J.Curr.Microbiol.App.Sci (2020) 9(5): 1063-1075
scales, after needed rectification
processes.
Generalized soil maps: These are maps made
by combining the delineation of existing
soil survey maps to form broader map
units by cartographic methods.
Schematic soil maps: Schematic soil maps are
compiled at small scale (1:1 M and
above) from the existing maps like
geology, geomorphology, climate, land
use etc. with limited field investigations.
These maps are useful in under
developed regions in advance of
organized field survey.
Digital soil maps: These maps are generated
from the existing soil maps after
scanning and digitization by using
ground control points. Digital soil maps
are used as a layer of information from
generating other thematic maps either by
manual GIS or computer based GIS.
Thematic maps: These maps are developed
for different application processes by
using GIS. eg. Soil suitability maps, soil
quality map etc.
The choice of method for soil resource
mapping involving the preparation of base
maps using remote sensing tools like aerial
photographs and satellite data depend upon
maximum power, finance and time. Remote
sensing methods are preferable than the
conventional methods as they save time and
money. Based on the past soil surveys
conducted in various projects, the following
methods are suggested for different surveys.
Application / interpretation of soil maps
Soil maps are used various applications
depending upon the situations and the
different applications are given as follows.
Land capability classification
Land
capability
classification
is
an
interpretative grouping of soils mainly based
on inherent soil characteristics, external land
features and environmental factors that limit
the use of land for agriculture. There are eight
land capability classes designated by Roman
letters I to VIII in the increasing order of
hazards and limitation in the use of land.
Class I to IV are suitable for agriculture under
proper and specific management. Classes V to
VIII is suited only for wildlife sanctuary and
recreational purposes.
Land capability subclasses are soil groups
within a land capability class that are
designated by small letters like „e‟ for
erosion, „s‟ for soil limitations and „c‟ for
climatic limitations „w‟ for wetness. Land
capability units are grouping of one or more
soil mapping units having similar potentials
and continuing limitation and hazards.
Land irrigability classification
Land Irrigability classification is concerned
with predicting the behaviour of soils under
the greatly altered water regime brought about
by the introduction of irrigation. This is done
based on soil irrigability classes (A to E),
topography and drainage. Arabic numbers 1
to 6 indicates land irrigability classes.
Limitations increase with increasing number
of land irrigability class. Classes 1 to 4 are
suitable for irrigation. Class 5 is temporarily
classified for unsuitable for irrigation pending
further investigations. Class 6 includes lands
permanently unsuitable for irrigation.
Land irrigability subclasses are the lands that
have the same kinds of limitations for
sustained use under irrigation. Lower case
letters “s”, “t” and “d” are used to show
whether the deficiency is due to soil
properties or topography or drainage.
Lands with more than one major deficiency
are indicated with the relevant letters after the
irrigabilty class.
1066
Int.J.Curr.Microbiol.App.Sci (2020) 9(5): 1063-1075
either all or limited number of categories may
be adopted.
Fertility capability classification
This is a technical system of grouping soils
according their fertility constraints in a
qualifiable manner. The physical and
chemical properties of the soil are considered
for Fertility Capability Classification. This
system helps in grouping the soils with the
same kind of fertility limitations and fertilizer
response. Type, substrata type and condition
modifiers form the soil fertility capability
classification. Type is determined by the
surface texture of soil (C,L,S,O). Substrata
Type refers to the texture of the subsoil
between 20 and 50 cm depth (C,L,S,R)
condition modifiers indicate the physical and
chemical properties of the soil that influence
the soil and fertilizer interactions. The
modifiers are ; g (gleying), d (dry), e (Low
CEC), a (aluminium toxicity,
h (acid
condition),
i (Fe-p fixation), x (X-ray
amorphous), v ( Vertic characteristics) , k (K
deficiency) , b (basic reaction) s ( salinity), n
( nitric) and c (cat clay).
Land suitability classification
Land suitability classification refers to the
fitness of a given type of land for a defined
use. Suitability classification is arrived at on
the basis of soil survey information, economic
and social analysis, kinds of land use and the
need for the change. Separate classifications
are made with respect to each kind of land use
that appears to be relevant for the area.10 The
categories recognized in land suitability
classification are order, classes, subclasses
and units. There are two orders viz., suitable
(S) and non-suitable (N). The classes
distinguished are S1- highly suitable, S-2
moderately suitable and S-3 marginally
suitable. The sub-classes reflect kinds of
limitation as in land capability sub-casses.
The suitability units in a sub-class differ in
management requirements. Depending upon
the purpose, scale and intensity of study,
Soil suitability models for specific crops are
dependent upon the suitability criteria of soil
site characters under the existing management
conditions. Since the suitability of a soil to the
crop is determined on the limiting
characteristics, the suitability of a soil with
respect to a crop might be underestimated.11
Soil productivity rating
To evolved a system of soil appraisal in terms
of actual and potential productivity. It is a
modified version of Storie Index. Eight
factors viz., moisture (H), drainage (D),
depth (P), texture / structure (T), base
saturation (N), soluble salt content (S),
organic matter (O) and mineral reserves (A)
are rated on a scale of 0-100 and the
percentages cumulatively multiplied to obtain
productivity index (P). In a similar manner
the potentiality index (P`) is calculated after
affecting the management measures. The ratio
of P`: P indicating the extent to which
productivity can be improved, is called the
co-efficient of improvement (CI).12
P (or) P` = H/100 x D/100 x P/100 x T/100
x N/100 x S/100 x O/100 x A/100 x 100
Co-efficient of Improvement (CI) = P`/P
Soils with rating index 65-100 are excellent,
35-64 is good, 20-34 is average and 8-19 is
poor and below 8 is extremely poor. Maps
showing productivity and potentiality index
can be prepared. The productivity ratings help
in choosing the best land use options among
field, fodder and tree crops. Suppose the
productivity rating of a soil unit for field,
fodder and tree crops is 60, 80 and 50 then it
can be constructed that the soil has the most
production potential for fodder crops than for
trees or field crops.
1067
Int.J.Curr.Microbiol.App.Sci (2020) 9(5): 1063-1075
Soil quality maps
These maps are derived from existing soil
maps for different soil parameters like depth,
erosion, texture, bulk density, pH, EC,
organic matter, CEC, BSP etc. these maps in
land management practices. For example, pH
maps can be used for crop selection and land
reclamation practices like liming in acid soil
and application of gypsum in alkali soil.
Remote sensing and GIS in watershed
characterization and management
Watershed is a natural hydrologic entity
governed by the terrain topography from
where run-off is drained to a point. The term
watershed is a general term, thus its size and
area depends on the scale of the base map
used for delineation and codification. Multispatial resolutions satellite data along with
topographic drainage maps of varying scales
can be effectively utilized for delineation of
various levels of watershed. Stereo aerial
photograph and satellite remote sensing data
are also very useful for delineation for
watershed. Digital Elevation Model (DEM)
derived by processing of topographic contour
information in GIS environment can be used
for automated delineation of ridgelines and
drainage network through specialized
analysis. Various watershed characteristics
except socio-economic conditions/status can
be obtained by using satellite remote sensing
and GIS techniques, directly or indirectly.
Watershed characteristics can be broadly
divided into (a) Topographic characteristics,
(b) Geologic characteristics (c) soils
(d) vegetation & land use (e) climatic and (f)
socio-economic characteristics.
Watershed prioritization
Watershed Prioritization is a prerequisite to
operationalize any major scheme, as it allows
the planners and policy makers to adopt a
selective approach considering the vastness of
the catchment area, severity of the problems,
constraints of funds and manpower, demands
of the local and political system. The
prioritization of watersheds varies with the
objectives of different schemes, but the basic
framework of watershed remains same.
Several quantitative erosional soil loss
estimation models used for prioritization of
watershed based on weighted average erosion
soil loss estimate watershed-wise.
Remote sensing and GIS in soil erosion
modeling
Soil erosion prediction and assessment has
been challenge to researchers since the 1930s‟
and several models have been developed.
These models are categorized as empirical,
semi-empirical and physical process-based
models. Empirical models (e.g. USLE) are
primarily based on observation and are
usually statistical in nature. Semi-empirical
models (e.g. MUSLE, MMF) lies somewhere
between physically process-based models and
empirical models and are based on spatially
lumped forms of water and sediment
continuity equations. Physical process-based
models (e.g WEPP) are intended to represent
the essential mechanism controlling erosion.
They represent the synthesis of the individual
components which effect erosion, including
the complex interactions between various
factors and their spatial and temporal
variabilities.
Universal soil loss equation (USLE)
The USLE is the most widely used empirical
overland flow or sheet-rill erosion equation
(Wischmeir and Smith, 1978).
The equation was developed to predict soil
erosion from cropland on a hillslope. The
equation is given by,
A= R.K.L.S.C.P
1068
Int.J.Curr.Microbiol.App.Sci (2020) 9(5): 1063-1075
Where, A is the average annual soil loss
(mass/area/year); R is the rainfall erosivity
index; K is the soil erodibility factor; L is the
slope length factor, S is the slope gradient
factor; C is the vegetation cover factor and P
is the conservation protection factor.
their development. Further, USLE cannot deal
with deposition; its applicability limits large
areas and watersheds. Based on these
considerations, several process based models
have
been
developed
(e.g
WEPP, EUROSEM, LISEM. 15
Modified universal
(MUSLE)
Sediment yield index (SYI) model
soil
loss
equation
The modified version of USLE that can be
proposed by.13
Sye= Xe.K.L.S.Ce.Pe
Where Sye is the event sediment yield
Xe = (Qe, qp) 0.56
Where 0.56 is an empirical co-efficient; Qe is
the runoff amount and qp is the peak run-off
rate obtained during the erosion and K.L.S.Ce
& Pe as defined for USLE.
Morgan, Morgan and Finney (MMF)
model
The model to predict annual soil loss, whilst
endeavoring to retain the simplicity of USLE
encompasses some of the recent advances in
understanding of erosion process into a water
phase and sediment phase. The model uses six
operating equations for which 15 input
parameters are required. The model compares
predictions of detachment by rain splash and
the transport capacity of the runoff and
assessing the lower of the two values as the
annual rate of soil loss, thereby denoting
whether detachment or transport is the
limiting factor.14
Physical process based model
Empirical models have constraints of
applicability limited to ecological conditions
similar to those from which data were used in
The AISLUS developed SYI model for
prioritization of watershed in the catchment of
River valley Project.16 It is predictive model
based on the soil, land use and terrain slope
characteristics. The potential utility of
remotely sensed data in the form of aerial
photographs and satellite sensors data have
been, well recognized in mapping and
assessing landscape attributes controlling soil
erosion, such as physiography, soils, land
use/land cover, relief, soil erosion pattern.
Remote sensing can facilitate studying the
factors enhancing the process, such as soil
type, slope gradient, drainage, geology and
land cover. Multi-temporal satellite images
provide valuable information related to
seasonal land use dynamics. Satellite data can
be used for studying erosional features, such
as gullies, rainfall interception by vegetation
and vegetation cover factor. DEM (Digital
Elevation Model) one of the vital inputs
required for soil erosion modeling can be
created by analysis of stereoscopic optical and
microwave (SAR) remote sensing data.
Geographic Information System (GIS) has
emerged as a power tool for handling spatial
and non-spatial geo-referenced data for
preparation and visualization of input and
output, and for interaction with models. There
is considerable potential for the use of GIS
technology as an aid to the soil erosion
inventory with reference to soil erosion
modeling and erosion risk assessment.
Erosional soil loss is most frequently assessed
by USLE. 16 Several studies showed the
potential utility of remote sensing and GIS
1069
Int.J.Curr.Microbiol.App.Sci (2020) 9(5): 1063-1075
techniques for quantitatively
erosional soil loss. 17,18,19
assessing
Digital database on soils
Though voluminous data on soils in the form
of maps and attributes (physical and chemical
properties of soils, geographical location,
lithology, current land uses etc.) is available
with various organization, there is no
organized digital database at state or national
level available to concerned uses. It is
therefore necessary to develop a centralized
digital database.
The advent of Geographic information system
(GIS), Relational Database Management
System (RDBMS), Decision support system
and rapid development of information
technology (IT) have ushered a new discipline
Soil Information System.
Soil and terrain digital database (SOTER)
The Soil and Terrain Digital Database
provides an orderly arrangement of natural
resource data in such a way that these data
can be readily accessed, combined and
analyzed from the point of view of potential
use and production, in relation to food
requirements, environmental impact and
conservation.
Basic in the SOTER approach is the mapping
of areas with a distinctive, often repetitive
pattern of land form, morphology, slope,
parent material and soils at 1:1 million scale
(SOTER UNITS). Each SOTER unit is linked
through a Geographic information system
with a computerized database containing all
available attributes on topography, landform
and terrain, soils, climate, vegetation and land
use.
National natural
system (NRIS)
resource information
The Department of Space, Govt, of India has
developed National Natural Resource
Information System (NRIS) for providing
information
to
decision
makers.
It
encompasses information on natural resources
related to land, soil, water, forest etc.
collected through remote sensing techniques
and conventional resources and also
information on socio-economic parameters.
NRIS is visualized as a network of GIS based
notes covering the watershed or block,
district, state and country, which include both
spatial and non-spatial inputs. Feature coding
scheme for every input element (including
soil, watershed etc) has been worked out
keeping in view the nationwide node work
and natural hierarchy within feature classes
for each of the theme.
National informatics centre (NIC)
The planning commission has been making
many spatial database available on
NICENET. GISNIC, the GIS software from
NIC is being used for the development and
retrieval of these databases. It is also being
used as a presentation tool for preparing
thematic maps for deriving the attribute
information from the existing databases.
Soil information system for soil health card
(SISSHC)
AISLUS
has also developed a soil
information system for soil health card. It has
been suggested that soil health card should be
introduced in all watershed management
programme to generate awareness for better
use of soil and land resources.
Agricultural resource information system
(AGRIS)
The National Bureau of Soil Survey and Land
Use Planning (NBSS&LUP) has completed
the soil resource mapping of different states
of the country. The maps of 13 states have
1070
Int.J.Curr.Microbiol.App.Sci (2020) 9(5): 1063-1075
been prepared at a scale of 1:2, 50,000 and
printed at a scale of 1: 5000,000. In the course
of soil resource studies done as 10 km
interval, a voluminous soil information both
at the field and through laboratory analysis
have been generated.
The number of soil profile studies was of the
order of about 75000. The soil information is
also stored in digital format. Dissemination of
vast information on resources in various
models is very much needed so that this could
be utilized successfully by the planners and
development agencies and for environment
improvement. The NBSS&LUP has identified
as a sub-centre of Agricultural Research
Information centre (ARIC) set up by ICAR
for input to AGRIS covering soil science
literature.
Recent advances: hyper spectral remote
sensing
Conventional broad band sensors such as
SPOT, Landsat MSS, IRS LISS III, LISS IV
are not suitable for mapping soil properties
because of their bandwidth of 100 to 200 µm
cannot resolve diagnostic features of
terrestrial materials. Hyperspectral sensors are
characterized by their high spectral resolution
across a wide range of the electromagnetic
spectrum, enabling the identification of
chemical composition of the imaged target
(rock, soils or vegetation). Hyperspectral
sensors record reflected electromagnetic
energy from the Earth surface across the
electromagnetic spectrum extending from the
visible wavelength region through the nearinfrared and mid-infrared region (0.3µm to
2.5µm) in tens to hundreds of narrow (in the
order of 10nm) contiguous bands. Such
narrow bandwidths results in an almost
continuous and detailed spectral response for
each pixel providing accurate and precise
information about its constituents and is
clearly an advantage over multispectral
imaging. The high spectral resolution of a
hyperspectral sensor allows us to capture
small deviations in the spectral response of
the materials thus aiding in their
identification.
Numerous studies in recent years have shown
relatively high correlations between soil
reflectance and certain physical and chemical
properties of soils. It has also been noted that
the environmental conditions under which
soils have been formed affect soil reflectance.
If these relationships among soil reflectance
and chemical and physical properties can be
established quantitatively and definitively for
given environmental conditions, the capacity
to extract useful soils information from sensor
data obtained by current and future earth
observation satellite systems will be greatly
enhanced. In recent years more emphasis has
been given for launching hyperspectral
satellites for detailed characterization of the
land surface features at regional scale. 20,21
As against the traditional method of soil
sampling and laboratory analysis of soils,
image or reflectance based remote sensing is
an efficient, fast and economically sustainable
way to detect spatial difference in crop and
soil conditions within field. It offers the
potential for identifying fine-scale spatial
patterns in soil properties across a field and
optimizing soil sampling strategies to quantify
these patterns. Several soil properties,
namely, surface condition, particle size,
organic matter, soil colour, moisture content,
iron and iron oxide content and mineralogy
have been found to affect their spectral
behavior.
1071
Int.J.Curr.Microbiol.App.Sci (2020) 9(5): 1063-1075
Table.1 Types of soil survey
Base map
Reconnaissance
survey
(Low
intensity / small
scale mapping)
SOI toposheets
1: 50,000
3 to 6 km
Soil profile
Soil observation ¼ km to 1 km
(through auger)
Soil series / soil
Mapping unit
association1 / soil
complex2
Level of mapping Taluk/district
Detailed survey
(High intensity /
large
scale
mapping)
Village maps /
1: 4000/ 1:8000
640 acre
¼ to ½ km
Types3 and Phases4
of soil series
Village/ block
Detailed
Reconnaissance survey
(Medium intensity)
This combines both
reconnaissance
and
detailed soil surveys.
Reconnaissance survey
is
conducted
throughout the project
area
and
detailed
survey is conducted in
intensively cultivation
areas.
1
Soil association consists of two or three soil series
2
Soil compiled consists of more than 3 soil series
3
Type means surface texture‟
4
Phase includes solum depth, slope, erosion, gravelliness, stoniness, salinity and alkalinity classes
Table.2 Horizon wise Analytical properties
S.No
1
2
3
Physical
Particle size fractions
Bulk density
Moisture capacity at Field
capacity and permenant wilting
point
Chemical
pH
EC
CaCO3,
Organic carbon,
Total Nitrogen
Exchangeable
CEC
Ex-cations
Ex-acidity
Table.3 Suggested methods for soil survey
Maps
Explanatory maps
Scale
1:1M & above
Small scale maps
1:250,000 scale
Medium scale
1:50,000 scale
Large scale
1:10,000 to 1: 25,000
Base maps / RS tools
1:1 M toposheets
satellite imageries
Toposheets/ Satellite
imageries
Toposheets/Aerial
photographs / satellite
imageries
Village maps/ Aerial
Photographs / PAN
merged LISS III
data
1072
Level of use
State
/
Country
region
State
/
District/
Agroclimatic region
Taluk/ District
Village/ Block
Int.J.Curr.Microbiol.App.Sci (2020) 9(5): 1063-1075
Aerial
Photographs
Delineation of
land forms
Soil
Analysis
Field work
(Profile soil
sample
collection)
Photointerpretation
using photo
elements
Prefield Map
(Physiographic
map)
Selection of sample
strips covering
physiographic units
Final soil map
(Physiographic units
with soil names)
Figure.1 Methods of soil mapping using aerial photographs
Satellite data
(summer / rabi season)
Ancillary data (SOI toposheets)
Georeferencing and base map
preparation
Ancillary data (physiography, geology, soil,
landuse, reports, meterological data)
Selection of sample strips and
development of tentative
legend
Ground truth collection (Profile /
auger bore studies & collection of
soil samples)
Soil Chemical Analysis
Soil Classification
Soil mapping Units
Figure.2 Visual interpretation of satellite imageries for soil mapping
1073
Int.J.Curr.Microbiol.App.Sci (2020) 9(5): 1063-1075
Remote sensing and GIS have emerged as
effective tool in generating spatial
information of natural resources. The planned
and indiscriminate use of land has caused
tremendous degradation of soils. Reliable
inventory of soils and other resources are
looking and therefore, need to be collected
expeditiously. Remote sensing data has been
established as tool insoil and other resource
mapping.
Development of new generation of high
spatial
resolution,
enhanced
spectral
coverage, revisit capabilities and stereo
viewing have opened new vistas in various
application areas. GIS technology is bringing
about rapid changes in the spatial anlaysis and
management of natural resources. GIS
coupled with remote sensing GPS and
computer technology is providing new
methods for data acquisition, storage,
processing analysis and modeling.
Acknowledgements
Authors are highly thankful to Agricultural
College
and
Research
Institute,
Vazhavachanure, Tiruvannamalai, Tamil
Nadu Agricultural University, Coimbatore,
India for motivating to complete this review
article.
References
1. Nageswara Rao, P. P. 2005.
Applications of Remote Sensing and
Geographical Indication System in
Land Resources Management North
Eastern Space Applications Centre,
Umiam-793103, Meghalaya.
2. Seelan, S. K., Laguette, S., Casady, G.
M., & Seielstad, G. A., 2003. Remote
sensing applications for precision
agriculture: A learning community
approach.
Remote
Sensing
of
Environment. 88, 157-169.
1074
3. Steininger, M.K., 1996. Tropical
secondary forest regrowth in the
Amazon: age, area and change
estimation with Thematic Mapper
data. International Journal of Remote
Sensing. 17, 9–27.
4. Melesse, A., and Wang, X. 2007.
Impervious Surface Area Dynamics
and Storm Runoff Response. Remote
Sensing of Impervious Surfaces; CRC
Press/Taylor and Francis, 19, 369-384.
5. Philipson, P., and Lindell, T. 2003.
Can coral reefs be monitored from
space? Ambio, 32, 586-593.
6. Arunkumar, V., Natarajan S., and
Sivasamy., R. 2002. Characterisation
and classification of soils of Lower
Palar
Manimuthar
Watershed.
Agropedology. 12: 97-103.
7. Arunkumar, V., Natarajan, S., and
Sivasamy., R. 2004. Soil resource
mapping of Vellamadai village,
Coimbatore district using fused (IRS
1C LISS III and PAN merged) space
borne multispectral data. Madras
Agric. J. 91: 399-405.
8. Karale, R.L. 1992. Remote sensing
with IRS 1A in soil studies:
Developments, status and prospects.
In: Natural Resourcecs Management –
A new Perspective. (ed.) R.L. Karale.
National
Natural
Resources
Management System (NNRMS),
Department of Space, Govt. of India,
Bangalore, pp. 128-143.
9. Kudrat, M., A.K. Tiwari, S.K. Saha
and S.K. Bhan. 1992. Soil resource
mapping using IRS 1A LISS II digital
data – A case study of Khandi area
adjacent to Chandigarh, India. Int. J.
Rem. Sens., (13): 3287 – 3302.
10. FAO. 1988. Guidelines for soil
description. FAO. Rome.
11. Zhang, L. 1994. A comparison of the
efficiency of the three models to
estimate water yield changes after
Int.J.Curr.Microbiol.App.Sci (2020) 9(5): 1063-1075
forced catchment conversion, M.Sc.
(Forest)
Thesis,
University of
Melbourne, Australia.
12. Gopal Krishan, S., Kushwaha, P.S.
and Velmurugan, A. 2009. Land
Degradation Mapping in the Upper
Catchment of River Tons J. Indian
Soc. Remote Sens. 37:49–59.
13. Williams, J.R. 1975. Sediment yield
prediction with Universal Equation
using runoff energy factor. In: Present
and prospective Technology for
predicting sediment yields and
sources,
Agricultural
Research
Service,
US
Department
of
Agriculture. 244–252.
14. Morgan, R.P.C., Morgan, D.D.V,
Finney, H.J.1984. A predictive model
for the assessment of soil erosion risk.
J. Agric. Eng. Res. 30, 245–253.
15. Lal, R. 2001. Soil degradation by
erosion,
Land
degradation&
development, 12: 519-539
16. Spanner, M.A., Strahler, A.H. Estes,
J.E., 1983. Soil loss prediction in a
Geographic
Information
System
Format. In Papers Selected for
Presentation at the Seventeenth
International Symposium on Remote
Sensing of Environment. 89-102. 2–9
June 1982. Buenos Aires, Argentina.
Ann Arbor, Mich.
17. Anonymous. 1970. Soil survey
manual, IARI, New Delhi.
18. Saha, S.K., M, Kudrat and Bhan, S.K.
. 1991. Erosional soil loss prediction
using digital satellite data and USLE.
IN: applications of Remote sensing in
Asia and Oceania- environmental
change monitoring, Asian association
of Remote sensing, 369-372.
19. Patel, N.R., Suresh kumar, Prasad, J.
and Pande.L.M. 2002. Soil erosion
risk assessment and land use
adjustment for soil conservation
planning using remote sensing and
GIS. Asian Journal of Geoinformatics
1(2): 47-55.
20. Sureshkumar and Sharma, S. 2005.
Soil erosion risk assessment based on
Morgan, Morgan and Finney model
using Remote sensing and Geographic
information system. Hydrology J., 28
(1-2): 47-58.
21. Kruse, F.A., Boardman, J.W. and
Huntington, F.J. 2003. Comparison of
airborne hyperspectral data and EO-1
Hyperion for mineral mapping. IEEE
transactions on geosciences and
remote sensing .41:1388 - 1400.
How to cite this article:
Arunkumar. V., M. Pandiyan and Yuvaraj. M. 2020. A Review on Remote Sensing and GIS
Applications in Soil Resource Management. Int.J.Curr.Microbiol.App.Sci. 9(05): 1063-1075.
doi: />
1075