Effect of phosphorus, VAM and FYM on soil fertility status under rice cultivation
Bạn đang xem bản rút gọn của tài liệu. Xem và tải ngay bản đầy đủ của tài liệu tại đây (377.64 KB, 10 trang )
Int.J.Curr.Microbiol.App.Sci (2020) 9(7): 3766-3775
International Journal of Current Microbiology and Applied Sciences
ISSN: 2319-7706 Volume 9 Number 7 (2020)
Journal homepage:
Original Research Article
/>
Effect of Phosphorus, VAM and FYM on Soil Fertility Status
under Rice Cultivation
Abhishek Kumar Shukla1*, Sanjay shahi2, Niteesh Patel1 and Sandeep Patel1
1
2
Udai Pratap Autonomous College, Varanasi (U.P.), India
Deptt of Agricultural Chemistry and Soil Science, Udai Pratap Autonomous College,
Varanasi (U.P.), India
*Corresponding author
ABSTRACT
Keywords
VAM, FYM,
Rice, SSP and Soil
Article Info
Accepted:
22 June 2020
Available Online:
10 July 2020
A field experiment was conducted during Kharif season 2018-2019 on research plot of
Udai Pratap Autonomous College, Varanasi (U.P.) adjoining the Department of
Agricultural Chemistry and Soil Science, The experiment was conducted with seven
treatments were control (T 1), 60kg P ha-1 (T2 ) 60kg P ha-1+VAM (T3), 30kg P ha-1 (T4),
30kg P ha-1 + VAM (T5), 30kg P ha-1 + VAM + 10t ha-1FYM (T6), 80 kg P ha-1 (T7), the
rice crop was laid out in randomized block design (RBD) with four replication . Soil pH
and EC was significantly decreased with addition of phosphorus, VAM and FYM. Higher
soil Organic carbon content was observed with the application of 30 kg P ha -1 + VAM +
FYM 10 ta /ha (T6). The plots treated with 30 kg P ha-1 + VAM + FYM @ 10ta ha-1 (T6)
recorded significantly higher available nitrogen content as compared to other treatments.
The effect of various treatment of phosphorus fertilizer, VAM and FYM on available
phosphorus content of soil was recorded significantly higher in the treatment T 3 i.e. 60 kg
P ha-1 + VAM. Significantly higher soil available potassium content was observed in the
treatment 30 kg P ha-1 + VAM + FYM @ 10ta ha-1 (T6). Application 30 kg P ha-1 + VAM +
FYM 10 ta ha-1i.e (T6) were recorded significant higher dry matter, straw yield and grain
yield of rice crop.
Introduction
Rice (Oryza sativa L.) is the most common
and important food crop of India in terms of
both the area and production. It has the
second highest wide production after maize.
Rice production in India crossed the mark of
112 million tonnes achieved in 2017-18
accounting for 21.19% of global production in
the year. The productivity of rice has 3742 kg
per hectare in 2017-18. India has largest area
(43.20 million hectare) followed by China
(30.35 m ha), Indonesia (12.16), Bangladesh
(12.0 m ha) and Vietnam (7.66 m ha) (FAO
STAT 2017). The major rice producing states
in India falls in the regions of the middle and
lower Ganga plains and the coastal lowlands
of the peninsular India. Rice is grown in
almost all the states of India but its cultivation
is mainly concentrated in river valleys, deltas
and low lying coastal areas in India. Andhra
Pradesh (2.16 m ha), Bihar (3.21 m ha),
3766
Int.J.Curr.Microbiol.App.Sci (2020) 9(7): 3766-3775
Madhya Pradesh (2.02 m ha), West Bengal
(5.46 m ha) and Uttar Pradesh (5.87 m ha)
lead in the area. West Bengal (15.75MT),
Uttar Pradesh (12.51 MT) and Punjab (11.82
MT) have the highest share in rice production.
medium phosphorus category and only 1.6%
is high phosphorus category. Plant required
phosphorus for their energy transfer reaction,
development of reproductive system, crop
maturity, root growth and protein synthesis.
Phosphorus is an essential element classified
as primary and also known as “Life of plant”.
Plant required adequate P from the very early
stages of growth for optimum crop production
(Grant et al., 2001). Phosphorus is one of the
major nutrients generally added to soil in
form of fertilizer. One of the main roll of the
phosphorus is plant is in transfer of energy
ATP and also involved in root development
and in metabolic activities especially in
synthesis of protein (D. Rodriguez, 2002).
Phosphorus is major growth-limiting nutrient
and unlike the case for nitrogen, there is no
large atmospheric source that can be made
biologically available (Laxminarayana 2005).
The phosphorus concentration in soil usually
ranges from 100 to 2000 mg P kg-1 soil
representing approximately 350 to 7000 mg P
kg-1 in the surface 25 cm of the soil, although
only a small proton of this P is immediately
available for crop uptake (Lanerd 2005).
Phosphorus in soil solution is found lower
range from 0.001 mg/L. In general plant root
absorbs
phosphorus
in
form
of
-2
-2
orthophosphate ions (H2PO4 and HPO4 ) are
primary forms of phosphorus taken up by
plant. Phosphorus moves to the root surface
through diffusion (Chaturvedi 2006).The
phosphorus content of soil is quit variable
ranging from less than 0.04% P2O5 in sandy
soil to 0.3% in highly organic matter soil. Soil
phosphorus levels are affected by erosion,
crop removal and phosphorus fixation. The
soil low in organic matter may contain only
3% of their total phosphorus in organic form,
but highly organic matter may contain 50% or
more of their total phosphorus in organic form
(Bray and Kurtz 1945). The available
phosphorus in Indian soil 52.5% of districts
are in low phosphorus category 46% are
The term Mycorrhiza used to describe the
symbiotic association between a fungus and a
root of higher plant (Frank, 1885). Both of the
host plant and fungal member, benefited
potentially form this association (Powel and
Bagyarj, 1984). There are almost seven types
of mycorrhizal (Reeves and Renente, 1991).
Near about 80% of all terrestrial plant species
form endomycorrhiza. ie vesicular arbuscular
mycorrhizal (VAM). Arbuscular mycorrhizal
fungi that specifically colonize roots of a
plant species are therefore likely to be great
relevance of fuction and their identification is
important to understand the ecology of plant
fungus interaction in natural ecosystem
(Hegalson et al, 2002) vesicular arbuscular
mycorrhizal fungi are ubiquitous in their
distribution and occur abundantly. Majority of
lowering plants have the dynamic association
of VAM fungi.
Materials and Methods
The present investigation entitled in the effect
of
phosphorus
fertilization
on
its
transformation under rice crop (Oryza sativa
L”). The field experiment was conducted
during Kharif season 2018-2019 on research
plot of Udai Pratap Autonomous College,
Varanasi (U.P.) adjoining the Department of
Agricultural Chemistry and Soil Science. The
initial physico-chemical properties of soil
have been presented in table 1.Varanasi is
found under sub-tropical climate and situated
in eastern U.P. whereas the precipitation is
normally spread over period of three and four
months i.e. started from the last week of June
to the second week of October in rainy
season. The distribution of average annual
rain fall is 96.65 cm.
3767
Int.J.Curr.Microbiol.App.Sci (2020) 9(7): 3766-3775
The experiment was conducted with seven
treatment were control (T1), 60kg P ha-1 (T2)
60kg P ha-1 + VAM (T3), 30kg P ha-1 (T4),
30kg P ha-1 + VAM (T5), 30kg P ha-1 + VAM
+ 10t ha-1 FYM (T6), 80 kg P ha-1 (T7), the
rice crop was laid out in randomized block
design (RBD) with four replication.
All grass has been removed from the plot and
plots and soil sample have been taken from
each plot at 30 DAS and at harvesting. Khurpi
and auger have been used as sampling tools.
Sample was collected in plastic bag. Soil
samples were brought to the laboratory, air
dried soil samples were crushed and pass
through 2 mm round here sieve. The sieved
samples were stored in the labeled polythene
bag plot wise for conducting selected
laboratory analysis.
A soil water suspension was prepared in ratio
of 1: 2.5 and pH was recorded with the help
of glass electrode digital pH meter (Jackson
1967). Electrical conductivity of soil sample
was measured in 1:2.5 soil and water
suspension at 25 0C temperature by EC
Bridge (Bower and Wilcox, 1965). Organic
carbon was determined by Walkley and
Black’s rapid titration method (Walkley and
Black, 1934) as described by (Jackson 1967).
The available nitrogen was determined by
alkaline permanganate method (Subbiah and
Asija, 1956). The available phosphorus in soil
was determined by the Olsen’s method
(Olsen’ et al., 1954). The available potassium
was determined by neutral normal ammonium
acetate method (Honway and Heidel, 1952).
The data collected from field and laboratory
was analyzed statically by using standard
procedure of randomized block design
(RBD), (Cochram and Cox, 1959). Critical
difference (C.D.) and standard error of mean
(S.E.M.) were calculated to determine the
significance among all the treatment mean.
Results and Discussion
This experiment was conducted to investigate
the different dose of phosphorus in
combination with or without FYM and VAM
on growth and yield and under rice. The result
of experiment recorded during availability of
nutrient this investigation are presented and
critically discussed in this chapter under
following heads.
Effect of phosphorus, FYM and VAM on
soil fertility status
Soil Reaction (soil pH)
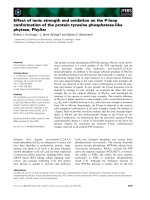
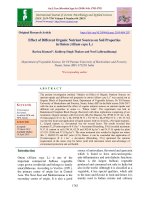
The results pertaining to the influence of
phosphorus, VAM and FYM application on
soil pH measured at 30 DAS and at harvesting
stage under rice have been presented in figure
-1. Form the data it is evident that, the pH of
soil increased continuously with days after
transplanting under all treatments. The effect
of various treatment on soil pH could be
arranged in the order T1> T7> T2> T4> T3>
T5> T6 and the values observed as 7.7, 7.6,
7.5, 7.43, 7.40, 7.35 to 7.7 at 30 DAT and 8.2,
8.0, 7.8, 7.68, 7.58, 7.52, 7.49 at harvesting
under respective treatment. The significantly
lower soil PH was recorded with addition of
phosphorus, VAM and FYM. These result are
corroborating with the findings of Sharma et
al., (2007) and Sharma et al., (2013).
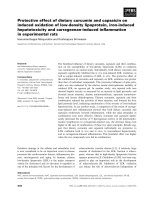
Electrical conductivity (EC)
The data related to the effect of phosphorus,
VAM and FYM application on electrical
conductivity of soil under rice, it showed they
electrical conductivity increased continuously
with advancement in crop growth stage under
all treatments. The application of FYM with
phosphorus + VAM recorder significantly
lower electrical conductivity as compared to
other treatments at all growth stages. The
effect of different treatments on EC of soil
3768
Int.J.Curr.Microbiol.App.Sci (2020) 9(7): 3766-3775
was found in the order T1> T7> T2> T4> T3>
T5> T6 and the values observed as 0.65, 0.6,
0.56, 0.53, 0.51 0.49, 0.46 d S m-1 at 30DAT
and 0.73, 0.69, 0.64, 0.62 0.58, 0.52dS m-1 at
harvesting. Further, the soil EC also
decreased significantly with the application of
FYM might be due to release of acids during
decomposition of FYM which reduced the
salt content responsible for exchange
phenomenon.
Organic carbon
The result related to soil organic carbon
content influence of phosphorus fertilization
on its transformation under rice crop
measured at 30 DAT and at harvesting stage
have been presented in table-2. Data shows
that organic carbon continuously decreased
with advancement of crop age under all
treatments. Significantly higher soil Organic
carbon content was observed with the
application of 30 kg P ha-1 + VAM + FYM 10
ta /ha (T6) in comparison to other treatments.
The effect of different treatment on organic
carbon content of soil was found in order of
T6> T3> T5> T7> T2> T4> T1, and the values
were 0.61, 0.57, 0.55,0.54, 0.52, 0.49, 0.43%
at 30DAT and 0.53, 0.49, 0.46, 0.45, 0.43,
0.40 and 0.35% at harvesting stage under
respective treatments. Maximum soil organic
carbon content inT6 (30 kg P ha-1 + VAM +
FYM 10ta ha-1) might be attributed to the
direct incorporation of organic material
through FYM and better root growth in
influenced of VAM. The addition of FYM
might have created environment conducive
for formation of humic acid, which ultimately
resulted in an increase in organic carbon
content of soil (Bajpai et al., 2006). The result
is corroborated with the findings of Prakash et
al (2002) and Dadhich et al., (2011).
Table.1 Initial physio-chemical properties of experimental soil
SN
1.
2.
3.
4.
5.
6.
7.
Parameters
pH
Electrical Conductivity(dSm-1)
Bulk density (M gm-1)
Organic carbon (%)
Available nitrogen(kg ha-1)
Available phosphorous (kg ha-1)
Available potassium(kg ha-1)
Contents
7.71
0.61
1.35
0.43
210
10.34
220
Table.2 Effect of phosphorus, FYM and VAM on organic carbon under rice crop
Treatment
T1
T2
T3
T4
T5
T6
T7
SEm±
CD (5%)
Days after transplanting ( DAT )
30 DAT
At Harvesting
0.43
0.35
0.52
0. 43
0.57
0.49
0.49
0.40
0.55
0.46
0.61
0.53
0.54
0.45
0.0045
0.0055
0.0135
0.0164
3769
Int.J.Curr.Microbiol.App.Sci (2020) 9(7): 3766-3775
Table.3 Effect of phosphorus, FYM and VAM on available nitrogen under rice crop
Treatment
T1
T2
T3
T4
T5
T6
T7
SEm±
CD (5%)
Days After Transplanting
30 DAT
60 DAT
214
194
246.35
223.35
266.30
242.30
228.00
206
258.00
240.40
280.40
262.50
256.45
236.45
0.5528
0.5118
1.6454
1.5205
( DAT )
At Harvesting
183
110.35
226.40
191.60
228.60
248.46
223.60
0.6486
1.9270
Table.4 Effect of phosphorus, FYM and VAM on available phosphorus under rice crop
Treatment
T1
T2
T3
T4
T5
T6
T7
SEm±
CD (5%)
Days After Transplanting
30 DAT
60 DAT
11.3
9.4
19.4
17.8
27.5
24.5
15.8
13.2
24.3
20.9
16.4
14.8
23.5
20
0.8116
0.9759
2.4115
2.8995
( DAT )
At Harvesting
6.5
16.4
22
11.8
18.9
12
18.6
0.3984
1.1837
Table.5 Effect of phosphorus, FYM and VAM on available potassium under rice crop
Treatment
T1
T2
T3
T4
T5
T6
T7
SEm±
CD (5%)
Days After Transplanting
30 DAT
60 DAT
225
209
239
223
250
236
235
221
243
230
255
242
241
229
2.2930
3.1497
6.8129
9.3583
3770
( DAT )
At Harvesting
188
200
207
199
209
220
204
3.2121
9.5436
Int.J.Curr.Microbiol.App.Sci (2020) 9(7): 3766-3775
Fig.1 Effect of integrated use of phosphorus, FYM and VAM on pH under rice crop
8.5
Soil pH
8
7.5
30DAS
7
At harvesting
6.5
T1
T2
T3
T4
T5
T6
T7
Treatment
Fig.2 Effect of integrated use of phosphorus, FYM and VAM on Electrical conductivity under
rice crop
Yield mean (qha-1)
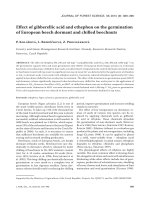
Fig.3 Effect of integrated use of phosphorus, FYM and VAM on dry matter (g m-1 row length),
grain and straw yield (q ha-1) of rice crop
90
80
70
60
50
40
30
20
10
0
Grain
Straw
Dry matter
T1
T2
T3
T4
Treatment
3771
T5
T6
T7
Int.J.Curr.Microbiol.App.Sci (2020) 9(7): 3766-3775
Available nitrogen
Available nitrogen content of soil under rice
have presented in table-3. The data revealed
that available nitrogen content of soil
decreased continuously with advancement in
crop growth stage under all treatments.
Statistically was significant difference was
observed among between T7 and T5 at 30
DAT. The plots treated with 30 kg P ha1
+VAM + FYM @ 10ta ha-1 (T6) recorded
significantly higher available nitrogen content
as compared to other treatments. Decline in
nitrogen content with increase in age of crop
can be attributed to N requirement for the
crop with age. The favourable soil conditions
under organic manure application might have
facilitated the mineralization of soil N leading
to build up of higher available nitrogen (Vipin
Kumar and Singh 2010).
Available phosphorus
Data showed that available phosphorus
content of rice plots decreased continuously
with age of crop under all treatments (table 4). The effect of various treatment of
phosphorus fertilizer, VAM and FYM on
available phosphorus content of soil was
recorded significantly. Higher in the treatment
T3 ie 60 kg P ha-1 + VAM. In case of available
phosphorus
statistically
significance
difference was observed among the treatments
except between T7, T5 and T6, T4 which was
remained at par 30 DAT and at harvesting.
Increase in available phosphorus content of
soil due to increasing level of phosphorus
might be attributed to direct addition of
phosphorus to solution pool of phosphorus in
soil. The increase in available phosphorus
content of soil due to the incorporation FYM
and VAM might be attributed solubilisation
of native phosphorus through release of
various
organic
acids
during
the
decomposition of FYM. The increase in
available P content of soil due to the
incorporation of FYM may be attributed to
the direct addition of P as well as
solubilisation of native P through release of
various organic acids during decomposition.
A part of that VAM helped to enhance the
mobility of P. Similar result was observed by
Sharma et al., (2005) and Shinde and Bangar,
2003).
Available potassium
Available potassium content of soil decreased
continuously with advancement in crop
growth
stage
under
all
treatments.
Significantly higher soil available potassium
content was observed in the treatment T6 30
kg P ha-1 + VAM + FYM @ 10ta ha-1.In case
of
available
potassium
statistically
significance difference was observed among
the treatments except between T7 and T5
which was remained at par 30 DAT and at
harvesting. Increase in available K due to
phosphorus, VAM and FYM application
might be attributed to the addition of
potassium from decomposition of FYM to the
available pool of soil. A part of that the
beneficial effect of FYM on available K
might be attributed to the reduction in fixation
and release of K due to interaction of FYM
with clay. Similar reports were also observed
by Laxminarayana (2005).These observation
by Abraham Lal (2004) and Thakur et al
(2011).
Effect of phosphorus, FYM and VAM on
dry matter, straw and grain yield of rice
Dry matter
The data revealed that the dry matter yield of
rice was found in the order T6> T3> T5> T7>
T2> T4>T1 and the values of grain yield were
82.24, 75.24, 64, 62, 57.24, 55.72, 42.42
gm/m under respective treatments. In case of
dry matter yield statistically significance
difference was observed among the treatment
except between T7 T5 which was remained at
3772
Int.J.Curr.Microbiol.App.Sci (2020) 9(7): 3766-3775
par at harvesting. Application 30 kg P ha-1 +
VAM + FYM 10 ta ha-1i.e (T6) recorded
significant higher yield in comparison to other
treatments. It might be due to more
availability of nutrients under P+ VAM +
FYM application led by the vegetative growth
of crop.
Acknowledgement
I am very acknowledge to the department of
Agricultural chemistry and Soil Science in
Udai Pratap Autonomous College, Varanasi
(U.P.), I am also thankful to my guide and
friends to support me for availing the
laboratory facilities.
Grain yield
References
The effect of integrated use of phosphorus,
VAM and FYM on grain (q ha-1) yield of rice
have presented in figure – 2 The data revealed
that the grain yield of rice was found in the
order T6> T3> T5> T7> T2> T4> T1 and the
values of grain yield were 48, 45.44, 43.42,
42, 38.25, 34.46 and 30.42q ha-1 under
respective treatments. In case of grain yield
statistically significance difference was
observed among the treatment except between
T7 and T5 which was remained at par at
harvesting. Application 30 kg P ha-1 + VAM
+ FYM 10 ta ha-1i.e (T6) recorded significant
higher yield in comparison to other
treatments. It might be due to more
availability of nutrients under P+ VAM +
FYM application led by the vegetative growth
of crop.
Straw yield
The data revealed that the straw yield of rice
was found in the order T6> T3> T5> T7> T2>
T4>T1 and the values of straw yield were
68.54, 60.42, 55.64, 54, 47.45, 44.46, 40.42 q
ha-1+ under respective treatments. In case of
straw
yield
statistically
significance
difference was observed among the treatment
except between T7 T5 which was remained at
par at harvesting. Application 30 kg P ha-1 +
VAM + FYM 10 ta ha-1i.e (T6) recorded
significant higher yield in comparison to other
treatments. It might be due to more
availability of nutrients under P + VAM +
FYM application led by the vegetative growth
of crop.
Arezoo, k., Akbari, N. and Chaichi ,
R.M.2008. Limited Irrigation and
Phosphorus fertilizer effects on yield
and yield components of grain sorghum.
American
Eurasian
Journal
of
Agriculture and Environmental Science,
3(5); 697-702.
Bajpai, R. K., Chita, t. S., Upadhayay, S. K.
and Urkukar, J. S.2006 Long term
Studies on soil physico-chemical
properties and productivity of rice-wheat
system management in inceptisol of
Chhattisgarh. Journal of the Indian
Society of Soil Science. 54(1)24-29.
Black, C.A., 1971.Mehtod of soil analysis,
part 2 Medison Wisconsin U.S.A .
American Society of agronomy.
Chesnin,
L.,
and
Yien,
C.H.1951.
Trubidimetric determination of available
sulphate in soil. Soil Science Society of
American Proceeding.
Datta, S.K., Sarka, M. A. R and Uddin,
F.M.J.2013. Effect of variety and level
of phosphorus on the yield components
of lentil. International Journal of
Agricultural Research Innovation and
Tech. 3(1)78-82.
Hernandez, M, Cuevas F. 2003The effect of
inoculation with aerbuscular mycorriza
and Bradyrhizobium strains on soybean
(Glycine max L.) crop development.
Cultivation- Tropicals. 24(2):19-21.
Jackson, M.L.1967. Soil Chemical Analysis
Practice Hall of Indian (P) Ltd, New
Delhi.
3773
Int.J.Curr.Microbiol.App.Sci (2020) 9(7): 3766-3775
Jackson, M.L.1973.Soil Chemical Analysis
Practice Hall of India (P) Ltd, New
Delhi.
Kumar/
Vipin
and
Prasad,
R.K.2008.Integrated effect of mineral
fertilizer and green manure on crop yield
and nutrient availability under rice –
wheat cropping system in calciorthents.
Journal of Indian Society of Soil
Science, 56(2) 209-214
Kaleem, S., Ansar, M., Ali, M.A., Sher, A.
2009. Effect of phosphorus on the yield
abd yirld components of wheat variety
under rainfed conditions. Sarhed Journal
of Agricultura Rrearch, 25(1).
Laxminarayana, K.,2005. Effect of P
solubilising microorganisms on yield of
rice and nutrient availability in an acid
soil Mizoram. Journal of the Indian
Socity of Soil Science 53, (2)240-243.
Lakkra , A., Singh, D., Prasad, V. Deepanshu
and Shahi,M.2017.Effect of Nitrogen
and phosphorus on growth and yield of
radish Pusha chetki under shade net
condition. The Pharma Innovation
Journal, 6(11):768-770.
Masood, T., Gulr, R, Munsif, F.; Jalal, F.;
Hussain, Z.; Noreen, N.; Khan, H and
Khan, H.2011. Effect of different
phosphorus levels on the yield and yield
components
of
maize.
Sarhad
Journal.Agricultural, 27(2).
Meena, P.O., Meena, K.R., Dhaka, S, R and
Sharma, A.2017. Effect of nitrogen and
phosphorus levels on growth and yield
of bottle ground. International Journal of
Pure
and
Applied
Bioscience.
5(4):1178-1184.
Mondal, G. K., Pal, S. K . and
Roy,A.2007.phosphorus
availability
indices of soils under various Land uses
in Tarai zone of West Bengal. Journal of
the Indian Society of Soil Science.55,
36-39.
Olsen, S, r., Cale, C.V., Watanble, F.S. and
Dean,
L.A.1954.
Estimation
of
Available Phosphorus in soil by
extraction
sodium
bicarbonate.Cire.U.S.Deptt.Agri, 939.
Pandey, S.P., Kundpal, B.K., Kumar, S.,
Rathore, S.S., Sekhawat, Kapila and
Bhogal, N.S.2012. Availability of
phosphorus and sulpur in Inceptisols of
central Uttar Pradesh. Journal of the
Indian Society of Soil Science.48, 118121.
Bhogal, N. S. 2012. Phosphorus use
efficiency of Indian mustard under semi
arid conditions in relation to phosphorus
solubilising and mobilizing micro
organisms and P fertilization. National
Academy Science Letters.35, 547-553.
Rodiriguezs, D, Andrade F.H. and Goudiraan,
J. 2002 Effects of phosphorus Nutrition
on tiller emergence in wheat. Amarican
Journal of Plant and Soil, (2):283 -295.
Sharma, S; Duber, Y.P., Kaistha B.P., and
Verma, T.S.2005. Effect of Rhizobium
inoculation and phosphorus level on
symbiotic parameter, growth and yield
of French bean (phaseolus vulgaris L.)
in North western acid Alfisol. Legume
Research, (28)103-106.
Sharma, P.K. and Gupta, J.P.1994.
Phosphorus utilization and root Cation
Exchange capacity in wheat as by
phosphorus, Lime and FYM on Alfisol
of western Himalayan region. Journal of
the Indian Society of Soil Science.42,
65-68
Sharma, P. K. and Raina, A. 1994 Effect of
the phosphorus on the bulb yield and P
used efficiency as influenced by FYM in
onion crop in acid soil from western
Himalayas. Journal of Indian Society of
Soil Science 42, 68 - 72.
Sharma, H.R., Manchanda and Kapoor, A.K.
2007. Phosphorus requirement of wheat
under chloride and sulphate dominated
salinities. Journal of the Indian Society
of Soil Science, (4)509-514.
Shinde, J. P., Singh, D.S., Mehela and
3774
Int.J.Curr.Microbiol.App.Sci (2020) 9(7): 3766-3775
Bhardwaj, K.K 2005. Effect of
integrated Use of inorganic fertilizer and
organic materials on the distribution of
different form of nitrogen and
phosphorus in soil. Journal of the Indian
Society of Soil Science, (1) 80 - 84.
Singh, B., and Bishnoi, S.R. 1993.
Determination of critical Levels of
available Soil phosphorus for maize.
Journal of the Indian Society of Soil
Science.41, 501-503.
Singh, M.v.2007.Problems of micro and
secondary in acid soils of Indian and
their manage me bulletin of. Indian
Society of Soil Science. 25, 27-58.
Singh, Y.G.R., Najar, Singh Ummed and
Singh,
J.K.2010.
Phosphorus
Management in maize– onion cropping
sequence under rained temperate
conditions of inceptiosol. Journal of the
Indian Socity of Soil Science, (4)355361.
How to cite this article:
Abhishek Kumar Shukla, Sanjay Shahi, Niteesh Patel and Sandeep Patel. 2020. Effect of
Phosphorus, VAM and FYM on Soil Fertility Status under Rice Cultivation.
Int.J.Curr.Microbiol.App.Sci. 9(07): 3766-3775. doi: />
3775