Evaluation of rice genotypes for genetic variability, heritability and genetic advance in saline and normal soil conditions
Bạn đang xem bản rút gọn của tài liệu. Xem và tải ngay bản đầy đủ của tài liệu tại đây (387.02 KB, 8 trang )
Int.J.Curr.Microbiol.App.Sci (2020) 9(7): 2714-2721
International Journal of Current Microbiology and Applied Sciences
ISSN: 2319-7706 Volume 9 Number 7 (2020)
Journal homepage:
Original Research Article
/>
Evaluation of Rice Genotypes for Genetic Variability, Heritability and
Genetic Advance in Saline and Normal soil Conditions
Anuj Kumar1*, D. K. Dwivedi1, Pradeep K. Bharti1, Vineeta Singh1,
Preeti Kumari2, Archana Devi2, and N. A. Khan1
1
Department of Plant Molecular Biology & Genetic Engineering, 2Department of Genetics
and Plant Breeding, A. N. D. University of Agriculture & Technology, Kumar Ganj,
Ayodhya-224229, India
*Corresponding author
ABSTRACT
Keywords
Genetic variability,
Heritability,
Genetic advance,
Rice
(Oryza sativa L.)
Article Info
Accepted:
22 June 2020
Available Online:
10 July 2020
The present investigation was carried out with the objectives to estimate genetic variability
for yield and yield contributing components. The investigation consisted of twenty rice
genotypes and the experiment was conducted during Kharif-2018-19 in Randomized Block
Design with three replications. The data were recorded for fourteen quantitative characters
to study genetic variability, heritability and genetic advance. Analysis of variance among
twenty genotypes showed significant difference for all characters under studied. Highest
genotypic coefficient of variation (GCV) and phenotypic coefficient variation (PCV) was
observed for grains per panicle followed by panicle bearing tillers per plant and spikelets
per panicle in controlled condition, whereas, in saline condition highest genotypic
coefficient of variation (GCV) and phenotypic coefficient variation (PCV) was observed
for panicle bearing tillers per plant followed by grains per panicle and spikelets per
panicle. These characters could be used as selection parameters for crop improvement.
High estimates of heritability were observed for K+ followed by plant height, days to 50%
flowering, harvest index% and grains per panicle in normal soil condition, whereas, in
saline condition highest broad sense heritability was recorded in the case of plant height,
spikelets per panicle followed by days to 50% flowering, grains per panicle, K + and
harvest index %. In controlled condition high genetic advance were observed for grains per
panicle followed by spikelets per panicle, whereas, in saline condition maximum genetic
advances was recorded in grains per panicle followed by panicle bearing tillers per plant. It
indicated that the presence of additive gene action. Hence, emphasis should be given to
select these quantitative traits to enhance the yield potential of rice (Oryza sativa L.) under
both conditions.
Introduction
Rice (Oryza sativa L.) is a diploid (2n = 24)
and self-fertilized monocot. There are two
species of cultivated rice - Oryza sativa and
Oryza glaberrima. Oryza sativa is the rice
cultivated in majority of rice growing
countries. As a food crop, it forms the staple
food of more than three billion people
accounting for about 50-80% of their daily
2714
Int.J.Curr.Microbiol.App.Sci (2020) 9(7): 2714-2721
calorie intake (Khush 2005). Rice protein is
biologically richest as its digestibility is
extremely high (88%). It is the 2nd most vital
crop within the world after wheat, covering
almost 90% of area across Asia alone. The
use of the crop varies widely starting from its
use as food in cereals, snacks, brewed
beverages, flour, rice bran oil to its use in
religious events across India. Asia is the
largest producer of rice (90%) with an
average productivity 3.9 tonnes per hectare.
China and India account for about 50% of the
world’s rice area and 56% of production
(Hossain and Pingali, 1998). Rice is a most
important cereal crop in India and it
contributes about 45% to the cereal
production, 41% of the total food grain
production and accounts for 20-25 per cent of
the agricultural GDP. In India, rice occupies
43.90-million-hectare
area
with
total
production of 109 million ton with
productivity of 2.59 ton/hectare. Global rice
production was only 483.9 million tonnes in
(2017-18). Rice is cultivated worldwide over
an area of about 153.51 million hectares with
annual production of 650.19 million tonnes.
The production of rice in U.P. is 12.51 million
tonnes
(Press
Information
Bureau,
Government of India, 2017). India ranked
first in area having 45.2 million hectares and
second in production 104.32 million tonnes.
(CSSRI Annual Report, 2017-18). Abiotic
stress is a major factor around the world
limiting plant growth and productivity.
Salinity may be a serious environmental
constraint to crop production in many parts of
the planet. It is especially prevalent in
irrigated agriculture and in marginal lands,
associated with poor drainage or high-water
tables. Estimates for the extent of salinity
damage vary from 25-50 percent of the
world’s irrigated land. The development of
crops/varieties with improved salt tolerance is
proposed as part of the solution to these
problems. A soil can be termed as saline if its
EC is 4 dS/m or more (USDA-ARS 2008),
(equivalent to approximately 40 mM NaCl)
with an osmotic pressure of approximately 0.2
MPa. Salinity is that the condition when the
EC is sufficient to cause yield reduction of
most crops. The pH of saline soils generally
ranges from 7- 8.5 (Mengel et al., 2001).
Salinity prone areas found in the arid and
semiarid zones are usually accounted to the
accumulation of salts over ages. It has been
well documented that the effect of salinity on
seedling growth, seedling establishment, grain
yield components like spikelet number, tiller
number has successively led to a reduction in
grain yield (Khatun et al., 1995; and Zeng et
al., 2003).
Materials and Methods
Plant materials
A total of twenty rice genotypes were used in
this study, which were IR68144-2B-2-2-3-1120, IR-68144-2B-2-2-3-1-127, IR-91167-991-1-1-3, IR-91167-133-1-1-2-3, NUD-3,
NDR-359, IR-28, FL-478, NUD-2, CSR-13,
AYYAR, NDRK-2008, IR-64, SWARNA,
IR-92953-49-1-3, IR-91171-66-3-2-1-3, IR83668-35-2-2-2, SAMBHA MANSURI,
TARAMON and MTU-1010.
Screening of rice
reproductive stage
genotypes
at
the
The genotypes were evaluated for their
tolerance to salinity under net house of
Department of PMB&GE, A. N. D. U. A. T.
Kumar Ganj, Ayodhya using standard
protocol (Gregorio et al., 1997). The
experimental
design
was
completely
randomized block design with three
replications. Two setups were maintained:
normal and salinized. Pregerminated seeds of
rice genotypes were planted in earthen pots.
After 2 weeks, seedlings were thinned and the
water level was raised to about 1 cm. The pots
were salinized at EC 6 dSm-1 three weeks
2715
Int.J.Curr.Microbiol.App.Sci (2020) 9(7): 2714-2721
after sowing and EC was monitored in every
week. Data were recorded for days to 50%
flowering, Plant height (cm), Panicle bearing
tillers per plant, Panicle length(cm), Number
of spikelets per panicle, Number of grains per
panicle, Spikelet fertility (%), Test weight(g),
Biological yield/plant (g), Harvest index (%),
Na+ / K+ ratio and Grain yield/plant (g) and
data was subjected to statistical analysis. The
variance was estimated as per procedure as
suggested by Panse and Sukhatme (1967),
PCV and GCV were calculated by the
formula given by Burton (1952), heritability
in broad sense (h2) by Burton and De Vane
(1953) and genetic advance i.e. the expected
genetic gain were calculated by using the
procedure given by Johnson et al., (1955).
Results and Discussion
Genetic variability in any crop is prerequisite
for selection of superior genotypes over the
prevailing cultivars. The analysis of variance
for different characters indicated the existence
of highly significant differences for all
fourteen characters under study at 1% level of
significance suggesting each and every
genotype are genetically divergent from each
other and there is ample scope for selection of
characters from these diverse sources for
yield and its components both the conditions
(normal and treated) (Table 1a, and 2a). These
findings were in accordance with the findings
of Bekele et al., (2013) and Sandhya et al.,
(2015). Wide range of variance was observed
for all the characters. Phenotypic variance
was higher than genotypic variance for all the
yield and its contributing characters indicate
the influence of environmental factors on
these traits. Under control condition the grains
per panicle (23.94 %) showed highest
phenotypic coefficient of variation followed
by panicle bearing tillers per plant (22.14%),
spiklets per panicle (21.95%), Na+/K+
(21.83%), grain yield per plant (19.14%),
plant height (cm) (18.66%). Under saline
condition the panicle bearing tillers per plant
(32.34 %) showed highest phenotypic
coefficient of variation followed by grains per
panicle (27.53%), spikletes per panicle
(25.64%), K+(23.36%), grain yield per plant
(g) (16.76%), Na+/K+ (15.74%), biological
yield per plant (g) (15.73%). Similar results
were also reported by Anjaneyulu et al.,
(2010), Idris et al., (2012), Yadav et al.,
(2018) and Sandhya (2014). Coefficients of
variation studies indicated that the estimates
of PCV were slightly higher than the
corresponding GCV (Table 1b and 2b) among
the all traits. Grains/panicle (23.94 and 21.29)
exhibited high estimates of genotypic
coefficient of variation (GCV) and phenotypic
coefficient of variation (PCV) followed by
panicle bearing tillers per plant (22.14 and
17.54), spiklets per panicle (21.95 and 21.29)
in controlled condition, whereas, in saline
condition panicle bearing tillers (32.34 and
29.53) exhibited high estimates of genotypic
coefficient of variation (GCV) and phenotypic
coefficient of variation (PCV) followed by
grains/panicle (27.53 and 27.24), spiklets per
panicle (25.64 and 25.30), high values of
genotypic coefficient of variation (GCV) and
phenotypic coefficient of variation (PCV) for
these traits suggested the possibility of yield
improvement through selection of these traits.
Close relationship between GCV and PCV
was found altogether the characters and PCV
values were slightly greater than GCV,
revealing little
or
no influence
of
environment for expression. The amount of
genetic variation considered alone will not be
of much use to the breeder unless
supplemented with the information on
heritability estimate, which gives a measure
of the heritable portion of the total variation.
It has been suggested by Burton and Devane
(1953) that the GCV along with heritability
estimate could provide a better picture of the
amount of advance to be expected by
phenotypic selection. Since genetic advance is
dependent on phenotypic variability and
2716
Int.J.Curr.Microbiol.App.Sci (2020) 9(7): 2714-2721
heritability in addition to selection intensity,
the heritability estimates in conjunction with
genetic advance will be more effective and
reliable in predicting the response to
selection. Heritability in broad sense includes
both additive and non-additive gene effects.
While, narrow sense heritability includes only
additive components (Johnson et al., 1955).
In the present study, in controlled condition
highest broad sense heritability was recorded
in the case of K+ (99.8) followed by plant
height (99.40), days to 50% flowering
(97.87), harvest index(%) (97.48) and grains
per panicle (95.16) (Table 1b) whereas, in
saline condition highest broad sense
heritability was recorded in the case of plant
height (98.97) followed by days to 50%
flowering (98.03) grains per panicle (97.96),
K+ (97.87) and spikelet fertility (%) (94.77)
(Table 2b) Fiyaz et al., (2011), Dhanwani et
al., (2013) and Yadav et al., (2018).
Maximum genetic advance was recorded for
grains per panicle (46.93) followed by
spikelets per panicle (42.54) showed in (table
1b) in controlled condition, whereas, in saline
condition maximum genetic advances was
recorded ingrains per panicle (5.55) followed
by panicle bearing tillers per plant (55.53)
(Table2b) Tiwari et al., (2011). In general
heritability along with genetic advance are
often useful in selection programmes. High
heritability with high genetic advance as
percent of mean indicates that these
characters are largely controlled by additive
gene
action,
which
indicates
that
improvement in these characters is possible
through mass selection and progeny selection.
Table.1 (a) Analysis of variance for randomized block design for 14 characters of rice under
controlled condition
Characters
Sources of variation
Replication
Treatments
Error
2
19
38
Days to 50% flowering
0.47
108.81**
1.16
Plant height (cm)
0.62
1003.00**
1.99
Panicle bearing tillers/plant
1.11
4.63**
0.76
Panicle length (cm)
2.73
24.44**
0.95
Spikelets/panicle
58.31
3258.55**
66.70
Grains/panicle
14.40
2782.26**
46.39
Spikelet fertility (%)
0.14
30.32**
0.94
Test weight (g)
0.20
16.52**
0.31
Biological yield/plant (g)
10.56
182.66**
9.93
Harvest index (%)
1.31
64.26**
0.54
0.02
0.61**
0.04
0.005
55.52**
0.02
0.000
0.002**
0.000
1.27
37.88**
1.54
d.f.
Na
+
K+
+
Na /K
+
Grain yield/plant (g)
*, ** significant at 5 and 1% probability levels, respectively
2717
Int.J.Curr.Microbiol.App.Sci (2020) 9(7): 2714-2721
Table.1 (b) Estimates of general mean, phenotypic coefficient of variability (PCV), genotypic
coefficient of variability (GCV), heritability in broad sense (h2b) and genetic advance in percent
of mean for 14 characters in rice in control condition
Characters
General
Mean ± SE
Days to 50% flowering
Plant height (cm)
Panicle bearing
tillers/plant
Panicle length (cm)
Spikelets/panicle
Grains/panicle
Spikelet fertility (%)
Test weight (g)
Biological yield/plant (g)
Harvest index (%)
Na+
K+
Na+/K+
Grain yield/plant (g)
93.98±0.60
86.14±2.26
11.90±1.04
Coefficient of variation Heritabilit Genetic
(%)
y in broad advance
sense (%)
as % of
PCV
GCV
mean
6.48
6.37
97.87
12.92
18.66
18.60
99.40
38.20
22.14
17.54
62.76
28.63
24.23±0.66
122.24±1.97
113.62±2.69
92.61±1.83
20.43±0.60
31.83±1.45
40.96±2.32
3.36±0.24
24.97±0.89
0.14±0.01
12.70±0.72
14.13
21.95
23.94
3.90
10.06
17.43
11.33
13.43
15.54
21.83
19.14
13.34
21.29
23.35
3.72
9.78
16.10
11.19
12.08
15.53
20.90
18.02
89.14
94.10
95.16
91.24
94.52
85.29
97.48
80.84
99.80
91.64
88.68
25.95
42.54
46.93
7.32
19.59
30.63
22.75
22.37
31.97
41.21
34.96
Table.2 (a) Analysis of variance for randomized block design for 14 characters of rice under
saline condition
Characters
d.f.
Days to 50% flowering
Plant height (cm)
Panicle bearing tillers/plant
Panicle length (cm)
Spikelets/panicle
Grains/panicle
Spikelet fertility (%)
Test weight (g)
Biological yield/plant (g)
Harvest index (%)
Na+
K+
Na+/K+
Grain yield/plant (g)
Replication
2
0.43
0.42
0.62
2.31
10.51
4.48
1.37
0.23
7.08
2.59
0.01
0.21
0.0000
1.19
*, ** significant at 5 and 1% probability levels, respectively
2718
Sources of variation
Treatments
19
185.31**
130.88**
7.42**
28.28**
2832.35**
2284.54**
35.60**
16.58**
63.74**
52.46**
0.76**
42.55**
0.0023**
9.15**
Error
38
1.23
0.45
0.46
1.66
25.20
15.75
0.64
0.44
2.88
2.13
0.07
0.30
0.0001
0.46
Int.J.Curr.Microbiol.App.Sci (2020) 9(7): 2714-2721
Table.2 (b) Estimates of general mean, phenotypic coefficient of variability (PCV), genotypic
coefficient of variability (GCV), heritability in broad sense (h2b) and genetic advance in per cent
of mean for 14 characters in rice in saline condition
Characters
General
Mean ±SE
Days to 50 % flowering
Plant height (cm)
Panicle bearing
tillers/plant
Panicle length (cm)
Spikelets/panicle
Grains/panicle
Spikelet fertility (%)
Test weight (g)
Biological Yield/Plant
(g)
Harvest index (%)
Na+
K+
Na+/K+
Grain yield/plant (g)
101.73±1.31
77.20±2.92
10.58±0.71
Coefficient of variation Heritability
(%)
in broad
sense (%)
PCV
GCV
8.37
8.28
98.03
7.38
7.34
98.97
32.34
29.53
83.36
Genetic
advance as %
of mean
16.89
15.04
55.53
21.33±0.74
113.43±1.17
106.64±2.18
93.24±0.77
19.12±0.60
28.48±0.56
14.78
25.64
27.53
4.21
12.24
15.73
13.57
25.30
27.24
4.10
11.77
14.72
84.22
97.38
97.96
94.77
92.43
87.56
25.65
51.43
55.55
8.23
23.31
28.37
39.99±1.29
3.93±0.18
26.40±1.50
0.15±0.01
11.31±0.34
11.34
13.87
23.36
15.74
16.76
10.68
13.72
21.80
14.62
14.57
88.72
75.62
97.87
87.09
86.25
20.73
27.96
41.90
27.96
26.10
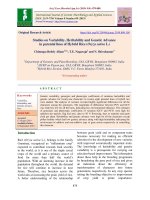
Fig Response of rice genotype under control and saline condition at reproductive stage
2719
Int.J.Curr.Microbiol.App.Sci (2020) 9(7): 2714-2721
In conclusion this investigation included 20
genotypes of rice genotypes was carried out in
order to study the nature and amount of
variability, heritability and genetic advance
for 14 quantitative characters. Analysis of
variance among 20 genotypes showed
significant difference for all characters
studied. Highest genotypic coefficient of
variation (GCV) and phenotypic coefficient
variation (PCV) was observed for grains per
panicle followed by panicle bearing tillers per
plant and spikelet per panicle in controlled
condition, whereas, in saline condition highest
genotypic coefficient of variation (GCV) and
phenotypic coefficient variation (PCV) was
observed for panicle bearing tillers per plant
followed by grains per panicle and spikelets
per panicle. These characters might be used as
selection parameters for crop improvement.
High estimates of heritability were observed
for K+ followed by plant height, days to 50%
flowering, harvest index % and grains per
panicle in controlled condition, whereas, in
saline condition highest broad sense
heritability was recorded in the case of plant
height followed by spikelets per panicle, days
to 50% flowering, grains per panicle, K+ and
harvest index %. In controlled condition high
genetic advance were observed for grains per
panicle followed by spikelets per panicle,
whereas, in saline condition maximum
genetic advances was recorded in grains per
panicle followed by panicle bearing tillers per
plant indicating predominance of additive
gene effects and possibilities of effective
selection for the development of those
characters.
References
Anjaneyulu M, Reddy D. R., Reddy H. P.
(2010) Genetic variability, heritability
and genetic advance inrice(Oryza sativa
L.). Research on Crops. 11(2):415- 416.
Bekele B. D., Rakh S., Naveen G. K., Kundur
P. J., Shashidhar H. E. (2013)
Estimation of genetic variability and
correlation studies for grain zinc
concentrations and yield related traits in
selected rice (Oryza sativa L.)
genotypes. Asian J. of Bio. Sci.,
4(3):391-397.
Burton G. W., De Vane E. H. (1953)
Estimating heritability in tall fescue
from Replicated clone natural materials.
Agronomy Journal., 45:171181.
CSSRI, (2017-18). Annual report central soil
salinity research institute, Karnal.
Dhanwani R. K., Sarawgi A. K., Solanki A.,
Tiwari J. K. (2013) Genetic variability
analysis for various yield attributing and
quality traits in rice (Oryza sativa L.).
The Bioscan 8(4):1403-1407.
Yadav P., Singh P., Harishchandra, Kumar
G., Shivani, Khan N.A., Dwivedi D.K.
(2018).
Estimation
of
genetic
variability, heritability and genetic
advance of thirty rice (Oryza sativa L.)
genotypes in saline and normal
condition. Int. J. Cur. Microbial. App.
Sci., 7: 1531-1539.
Fiyaz R. A., Ramya K. T., Chikkalingaiah,
Ajay B. C., Gireesh C. and Kulkarni R.
S.
(2011)
Genetic
variability,
correlation and path coefficient analysis
studies in rice (Oryza sativa L.) under
alkaline soil condition. Electronic
Journal of Plant Breeding. 2(4):531537.
Gregorio G.B., Senadhira D. and Mendoza
R.D. (1997) Screening rice for salinity
tolerance. IRRI Discussion Paper Series
no. 22. Manila (Philippines): IRRI.1-30.
Hossain M. and Pingali P.L. (1998) Rice
research, technological progress, and
impact on productivity and poverty: an
overview. In: Impact of Rice Research.
Idris A. E., Justin F. J., Dagash M.I.
andAbuali A. I. (2012) Genetic
variability and inter relationship
between yield and yield components in
some rice genotypes. American Journal
2720
Int.J.Curr.Microbiol.App.Sci (2020) 9(7): 2714-2721
of Experimental Agriculture. 2(2):233239.
Johnson H.W., Robinson H.P. and Comstock
R.E. (1955) Estimates of genetic and
environmental variability in Soybeans.
Agron. J., 47: 314-318.
Khatun S. and Flowers T. J. (1995) Effects of
salinity on seed set in rice. Plant, Cell
Envi. 18: 61-67.
Khatun S., Rizzo C. A. and Flowers T. J.
(1995) Genotypic variation in the effect
of salinity on fertility in rice.Plant Soil
173: 239-250.
Mantri N., Patade V., Penna S., Ford R. and
Pang E. (2012) Abiotic stress responses
in plants: Present and future. In: Ahmad
P. and Prasad N. V. Abiotic Stress
Responses in Plants: Metabolism,
Productivity and Sustainability. New
York: Springer: 1–19.
Mengel K. Kirkby E. A., Kosegarten H. and
Appel T. (2001) Principles of plant
nutrition. Kluwer, Dordrecht.
Khush G. S. (2005) What will it take to feed
5.0 billion rice consumers in 2030?
Plant Mol Biol59: 1-6.
Panse V. G andShukhatme P. V. (1967)
Statistical Methods for agricultural
workers, 2nd edition, ICAR, NewDelhi.,
152-157.
Press information Bureau, Government of
India, June, 2017.
Sandhya, Alok K., Rn gare N. R. and
Vidyakar V. (2015) Study of genetic
variability of Indian and exoticrice
germplasm in Allahabad agroclimate.
The Bioscan. 8(4):1345- 135.
Sandhya, Babu S. G. and Kumar R. (2014)
Genetic Variability, Interrelationship
and
Path
Analysis
for
Yield
Improvement of Rice Genotypes. The
Bioscan. 9 (3):1161-1164.
Tiwari R., Suresh B. G., Mishra V. K. and
Kumar A. (2011) Genetic variability
and character association in direct
seeded upland rice (Oryza sativa L.).
Environment and Ecology. 29 (4A):
2132-2135.
USDA-ARS (2008) Research Databases
Bibliography on Salt Tolerance. George
E. Brown, Jr. Salinity Lab. US Dep.
Agric., Agric. Res. Serv. Riverside, CA.
Zeng L., Lesch S. M. and Grieve, C. M.
(2003) Rice growth and yield respond to
changes in water depth and salinity
stress. Agri Water Manage 59: 67-75.
How to cite this article:
Anuj Kumar, D. K. Dwivedi, Pradeep K. Bharti, Vineeta Singh, Preeti Kumari, Archana Devi,
and Khan, N. A. 2020. Evaluation of Rice Genotypes for Genetic Variability, Heritability and
Genetic Advance in Saline and Normal soil Conditions. Int.J.Curr.Microbiol.App.Sci. 9(07):
2714-2721. doi: />
2721