Central improvement of voltage sags in the IEEE 33-Bus distribution system by a number of D-STATCOMS
Bạn đang xem bản rút gọn của tài liệu. Xem và tải ngay bản đầy đủ của tài liệu tại đây (737.34 KB, 6 trang )
Journal of Science & Technology 139 (2019) 012-017
Central Improvement of Voltage Sags in the IEEE 33-Bus Distribution
System by a Number of D-STATCOMS
Bach Quoc Khanh
Hanoi University of Science and Technology - No. 1, Dai Co Viet Str., Hai Ba Trung, Ha Noi, Viet Nam
Received: November 04, 2018; Accepted: November 28, 2019
Abstract
The paper introduces a novel method for “central improvement” of voltage sags due to short-circuits in
distribution system using multiples of D-Statcoms. D-Statcom’s effectiveness for voltage sag mitigation is
modeled basing on the method of Thevenin’s superimposition for the problem of short-circuit calculation in
distribution systems. The paper newly considers the case of using a multiple of D-Statcoms with a proposed
voltage compensating principle that can be practical for large size of distribution system. A multiple of DStatcoms are optimally located and sized on the basis of minimizing the system bus voltage deviation with
regard to the constraint of D-Statcom’s size. The paper uses the IEEE 33-buses distribution feeder as the test
system for voltage sag simulation and results discussion.
Keywords: Distribution System, Voltage Sag, System Voltage Deviation, Distribution Synchronous
Compensation – D-Statcom
1. Introduction 1
using the shunt compensator like D-Statcom, besides
researches on dynamic modeling of D-Statcom with
main regard to the design of controller of D-Statcom
[5-8] for mitigating PQ issues at a specific load site,
there have been researches on using D-Statcom [9-14]
as a systematic solution of PQ. However, no researche
deals a multiple of D-Statcom mitigating voltage sag
due to faults in distribution system.
Voltage sag, according to IEEE1159 [1], is a
phenomenon of power quality (PQ) in which the rms
value of the voltage magnitude drops below 0.9 p.u. in
less than 1 minute. Short-circuits in the power systems
account for more than 90% of voltage sag events.
Various solutions for voltage sag mitigation [2, 3] have
been introduced, particularly for distribution system,
and they are basically clustered into two groups [4]
named “distributed improvement” and “central
improvement”. While the first are mainly applied for
protecting a single sensitive load, the later are
introduced for systematically (or totally) enhancing
PQ in the distribution system (i.e. not only for a single
load, but also for many loads). These solutions,
especially that use custom power devices (CPD) like
the distribution static synchronous compensator (DStatcom) [2], have recently attracted more and more
interest from utilities as the cost of solutions has
gradually declined.
This paper introduces a novel method for system
voltage sag mitigation by the presence of a number of
D-Statcoms in a distribution system. This method
optimizes the size and placement of a multiple of DStatcoms basing on the improved system voltage
deviation index during a short-circuit in the system of
interest. The research uses the IEEE 33-bus
distribution system as the test system. Short-circuit
calculation for the test system as well as the modeling
and solution of the problem of optimization are all
programmed in Matlab.
Toward the above purpose, the paper is organised
as follows: The Section 2 presents the proposal of the
modeling of D-Statcom for short-circuit calculation in
distribution system. The Section 3 defines the problem
of optimization where the modeling of a multiple of DStatcoms is built in short-circuit calculation and
When CPDs are used for totally improving PQ in
distribution system, the problem of optimally selecting
their location and size is always concerned and [4]
summarizes various researches for modeling and
solving the problem by using CPDs for “central
improvement” of PQ in general. For PQ problems
Corresponding author: Tel.: (+84) 904.698.900
Email:
*
12
Journal of Science & Technology 139 (2019) 012-017
2.2. Placing two D-Statcoms in the test system
system voltage sag quantification. Finally, the results
for different scenarios of short-circuit events are
analysed in the Section 4.
2. Modeling of D-Statcom for Short-circuit
Calculation in Distribution System
2.1 Generality
Fig. 1. Test system short-circuit modeling using [Zbus]
with presence of two D-Statcoms
D-Statcom is a FACTS device that is popularly
described as a current source that injects the required
current in the bus needed for voltage compensation [3].
In the case of using two D-Statcoms (Fig. 1)
assumed to connect to bus j and k (such as k>j), the
matrix of additional injected bus current only has two
elements at bus j and bus k that do not equal zero
(∆𝐼𝐼𝑗𝑗 = 𝐼𝐼𝐷𝐷𝐷𝐷𝐷𝐷 ≠ 0 and ∆𝐼𝐼𝑘𝑘 = 𝐼𝐼𝐷𝐷𝐷𝐷𝐷𝐷 ≠ 0). Other elements
equal zero (∆Ii = 0 for ∀i≠j,k). Therefore, (6) can be
rewritten as follows
It’s assumed that the initial state of the test system
is the short-circuit without custom power devices in
general. Thus, we have the system bus voltage
equation (1) as follows
where
(1)
[𝑈𝑈 0 ] = [𝑍𝑍𝑏𝑏𝑏𝑏𝑏𝑏 ] × [𝐼𝐼 0 ]
𝑈𝑈̇
⎡ 𝑠𝑠𝑠𝑠𝑠𝑠.1 ⎤
⎢ ⋮ ⎥
[𝑈𝑈 0 ] = ⎢𝑈𝑈̇𝑠𝑠𝑠𝑠𝑠𝑠.𝑘𝑘 ⎥
⎢
⎥
⎢ ⋮ ⎥
⎣𝑈𝑈̇𝑠𝑠𝑠𝑠𝑠𝑠.𝑛𝑛 ⎦
(2);
𝐼𝐼 ̇
⎡ 𝑓𝑓1 ⎤
⎢ ⋮ ⎥
̇ ⎥
[𝐼𝐼 0 ] = ⎢𝐼𝐼𝑓𝑓𝑓𝑓
⎢ ⎥
⎢ ⋮ ⎥
̇ ⎦
⎣𝐼𝐼𝑓𝑓𝑓𝑓
[I0]: Initial injected bus current matrix (Short-circuit
current).
or
∆𝑈𝑈̇
∆𝐼𝐼 ̇
⎡ 1⎤
⎡ 1⎤
⎢ ⋮ ⎥
⎢ ⋮ ⎥
⎢∆𝑈𝑈̇𝑘𝑘 ⎥ = [𝑍𝑍𝑏𝑏𝑏𝑏𝑏𝑏 ] × ⎢∆𝐼𝐼𝑘𝑘̇ ⎥
⎢ ⋮ ⎥
⎢ ⋮ ⎥
⎣∆𝑈𝑈̇𝑛𝑛 ⎦
⎣∆𝐼𝐼𝑛𝑛̇ ⎦
(8)
̇
=
𝐼𝐼𝐷𝐷𝐷𝐷.𝑘𝑘
̇
=
𝐼𝐼𝐷𝐷𝐷𝐷.𝑗𝑗
𝑍𝑍𝑘𝑘𝑘𝑘 ×�1−𝑈𝑈̇𝑠𝑠𝑠𝑠𝑠𝑠.𝑗𝑗�−𝑍𝑍𝑗𝑗𝑗𝑗 ×�1−𝑈𝑈̇𝑠𝑠𝑠𝑠𝑠𝑠.𝑘𝑘 �
�𝑍𝑍𝑘𝑘𝑘𝑘 ×𝑍𝑍𝑗𝑗𝑗𝑗 −𝑍𝑍𝑗𝑗𝑗𝑗 ×𝑍𝑍𝑘𝑘𝑘𝑘 �
𝑍𝑍𝑗𝑗𝑗𝑗 ×�1−𝑈𝑈̇𝑠𝑠𝑠𝑠𝑠𝑠.𝑘𝑘 �−𝑍𝑍𝑘𝑘𝑘𝑘 ×�1−𝑈𝑈̇𝑠𝑠𝑠𝑠𝑠𝑠.𝑗𝑗�
(9)
�𝑍𝑍𝑘𝑘𝑘𝑘 ×𝑍𝑍𝑗𝑗𝑗𝑗 −𝑍𝑍𝑗𝑗𝑗𝑗 ×𝑍𝑍𝑘𝑘𝑘𝑘 �
The power of corresponding D-Statcoms placed
at buses j and k
�
[𝑈𝑈] = [𝑍𝑍𝑏𝑏𝑏𝑏𝑏𝑏 ] × ([𝐼𝐼 0 ] + [∆𝐼𝐼])
[∆𝑈𝑈] = [𝑍𝑍𝑏𝑏𝑏𝑏𝑏𝑏 ] × [∆𝐼𝐼]
∆𝑈𝑈𝑗𝑗̇ = 1 − 𝑈𝑈̇𝑠𝑠𝑠𝑠𝑠𝑠.𝑗𝑗
∆𝑈𝑈̇𝑘𝑘 = 1 − 𝑈𝑈̇𝑠𝑠𝑠𝑠𝑠𝑠.𝑘𝑘
�
With the presence of D-Statcoms, according to
the Thevenin theorem, the bus voltages should be
calculated as follows [15]:
where
�
(7)
replace (8) to (7) and solve this system of two
equations, we get
[Zbus]: System bus impedance matrix calculated from
the bus admittance matrix: [Zbus]= [Ybus]-1. If the shortcircuit is assumed to have fault impedance, we can add
the fault impedance to [Zbus].
= [𝑈𝑈 0 ] + [∆𝑈𝑈]
̇
̇
+ 𝑍𝑍𝑗𝑗𝑗𝑗 × 𝐼𝐼𝐷𝐷𝐷𝐷𝐷𝐷
∆𝑈𝑈𝑗𝑗̇ = 𝑍𝑍𝑗𝑗𝑗𝑗 × 𝐼𝐼𝐷𝐷𝐷𝐷𝐷𝐷
̇ + 𝑍𝑍𝑘𝑘𝑘𝑘 × 𝐼𝐼𝐷𝐷𝐷𝐷𝐷𝐷
̇
∆𝑈𝑈̇𝑘𝑘 = 𝑍𝑍𝑘𝑘𝑘𝑘 × 𝐼𝐼𝐷𝐷𝐷𝐷𝐷𝐷
The injected currents to bus j and bus k, their bus
voltages can boost Uj and Uk from 𝑈𝑈𝑗𝑗0 = 𝑈𝑈𝑠𝑠𝑠𝑠𝑠𝑠.𝑗𝑗 and
𝑈𝑈𝑘𝑘0 = 𝑈𝑈𝑠𝑠𝑠𝑠𝑠𝑠.𝑘𝑘 up to desired value, say 1p.u. That means
(3)
[𝑈𝑈 0 ]: Initial bus voltage matrix (Voltage sag at all
buses during power system short-circuit)
= [𝑍𝑍𝑏𝑏𝑏𝑏𝑏𝑏 ] × [𝐼𝐼 0 ] + [𝑍𝑍𝑏𝑏𝑏𝑏𝑏𝑏 ] × [∆𝐼𝐼]
�
̇
= 𝑈𝑈𝑗𝑗̇ × 𝐼𝐼̂𝐷𝐷𝐷𝐷.𝑗𝑗
𝑆𝑆𝐷𝐷𝐷𝐷.𝑗𝑗
̇
𝑆𝑆𝐷𝐷𝐷𝐷.𝑘𝑘 = 𝑈𝑈̇𝑘𝑘 × 𝐼𝐼̂𝐷𝐷𝐷𝐷.𝑘𝑘
(10)
The voltage upgrade at other buses i (i≠j,k) can
also be calculated
(4)
(5)
̇
̇
+ 𝑍𝑍𝑖𝑖𝑖𝑖 × 𝐼𝐼𝐷𝐷𝐷𝐷.𝑘𝑘
∆𝑈𝑈̇𝑖𝑖 = 𝑍𝑍𝑖𝑖𝑖𝑖 × 𝐼𝐼𝐷𝐷𝐷𝐷.𝑗𝑗
(11)
𝑈𝑈̇𝑖𝑖 = ∆𝑈𝑈̇𝑖𝑖 + 𝑈𝑈̇𝑖𝑖0 = ∆𝑈𝑈̇𝑖𝑖 + 𝑈𝑈̇𝑠𝑠𝑠𝑠𝑠𝑠.𝑖𝑖
(12)
Finally, the voltage at other buses i (i≠j,k) after
placing two D-Statcoms at buses j and k
(6)
2.2.3. Placing m D-Statcoms in the test system
Assume that M is the set of m buses to connect
to D-Statcom (Fig. 2), so the column matrix of bus
injected current [∆I] in (6) has m non-zero elements
and n-m zero elements. From (6), we have
∆Ui: Bus i voltage improvement (i=1,n) after adding
the CPD in the system.
∆Ii: Additional injected current to the bus i (i=1,n)
after adding CPDs like D-Statcoms in the system.
13
̇
̇
∆𝑈𝑈̇𝑘𝑘 = 𝑍𝑍𝑘𝑘𝑘𝑘 × 𝐼𝐼𝐷𝐷𝐷𝐷.𝑘𝑘
+ ∑𝑗𝑗∈𝑀𝑀,𝑖𝑖≠𝑘𝑘 𝑍𝑍𝑗𝑗𝑗𝑗 × 𝐼𝐼𝐷𝐷𝐷𝐷.𝑗𝑗
(13)
Journal of Science & Technology 139 (2019) 012-017
3.3. The problem of optimization
For bus k, k∈M, the rule of voltage compensation
is as follows
∆𝑈𝑈̇𝑘𝑘 = 𝑈𝑈̇𝑘𝑘 − 𝑈𝑈̇𝑠𝑠𝑠𝑠𝑠𝑠.𝑘𝑘 = 1 − 𝑈𝑈̇𝑠𝑠𝑠𝑠𝑠𝑠.𝑘𝑘
3.3.1. Objective function and constraints
(14)
In this research, the problem of optimizing the
location and size of a multiple D-Statcoms in the test
system where the objective function is to minimize the
total system voltage deviation, is established. It’s seen
as the index of system voltage sag energy [16].
Replace (14) to (13) we have m equations to
calculate m variables IDS.k of m D-Statcoms. Solve this
system of m equations, we get m values of IDS.k.
Replace m values of IDS.k in (6), we can calculate
the voltage upgrade of n-m buses without connecting
to D-Statcoms
̇
∆𝑈𝑈̇𝑖𝑖 = ∑𝑛𝑛𝑖𝑖=1 𝑍𝑍𝑖𝑖𝑖𝑖 × 𝐼𝐼𝐷𝐷𝐷𝐷𝐷𝐷
2
where
(15)
𝐹𝐹 = �∑𝑛𝑛𝑖𝑖=1�𝑈𝑈𝑟𝑟𝑟𝑟𝑟𝑟 − 𝑈𝑈𝑖𝑖 � ⇒ 𝑀𝑀𝑀𝑀𝑀𝑀
(16)
Uref: Reference system voltage, equals 1p.u.
Finally, we calculate voltages of all buses in the system
after placing m D-Statcoms similar to (12).
Ui: Bus i voltage calculated in (14).
For this problem of optimization, the main
variable is the scenario of positions (buses) where DStatcoms are connected. We can see each main
variable as a string of m bus numbers with D-Statcom
connection out of n buses of the test system. Therefore,
the total scenarios of D-Statcom placement to be tested
is the m-combination of set N (n=33):
𝑇𝑇𝑚𝑚 = 𝐶𝐶𝑛𝑛𝑚𝑚 =
Fig. 2. Test system short-circuit modeling using [Zbus]
with the presence of m D-Statcoms (m
33!
𝑚𝑚!×(33−𝑚𝑚)!
(17)
For example, if we consider the placement of 2
D-Statcoms in the test system, m=2, the total scenarios
for placing these two D-Statcoms is as follows
3. Problem Definition
3.1. IEEE 33-Bus Distribution System
This paper uses the IEEE 33-bus distribution
feeder (Fig. 3) as the test system for the research. It
features a balanced three-phase distribution system,
with three-phase lines and loads. This research
assumes: base values are 11kV; 100MVA. The system
voltage is 1pu. System impedance is 0.1pu.
2
𝑇𝑇2 = 𝐶𝐶33
=
33!
2!×(33−2)!
= 528.
Each candidate scenario to be tested is a pair of
buses number k and l out from 33 buses where the two
D-Statcoms are connected (e.g. 1,2; 1,3;…).
The only constraint is that the size of D-Statcom
is limited to a certain maximum value (SDS.max). In this
research D-Statcom’s size is not greater than 0.1p.u.
(or 10MVA). For each bus where D-Statcom can be
connected, if SDS > SDS.max, this bus is not qualified for
D-Statcom placement.
3.3.2. Problem solving
Fig.3. IEEE 33-bus distribution feeder
For such a problem of optimization, under the
assumption of a fault event, the objective function and
the constraint are always determined. So, we use the
method of direct search and testing all candidate
scenarios in the set of scenarios of Tm. The flowchart
of solving this problem in Matlab is given in Fig. 4.
3.2. Short-circuit calculation
According to point 2.2a, Section 2, we assume
the initial status of the test system is a short-circuit in
the system. The paper considers a number of shortcircuit positions with different fault impedance Zf.
Three-phase short-circuit calculations are performed
in Matlab using the method of bus impedance matrix
and resulting bus voltage sags can be calculated.
Each candidate scenario k defines positions
where D-Statcoms are connected. According to this
method, we have to determine the whole set of
candidate scenarios Tm (17). For a candidate scenario
k, we can calculate the D-Statcom’s power (size) and
objective function Fk. We can sweep all candidate
scenarios in Tm for constraint verification and
minimization of the objective function.
With the calculation of system bus voltage in the
short-circuit event with the presence of D-Statcom, we
can define the problem of optimization as follows.
14
Journal of Science & Technology 139 (2019) 012-017
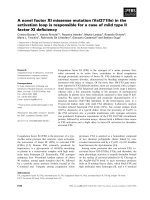
4.2. Result analysis
The proposed method of modeling the system
voltage sag mitigation for the case of using multiples
of D-Statcom in Section 2.2 can be illustrated for the
case of using two D-Statcom. Followings are step-bystep clarification and analysis of the results.
For a better understanding, we consider the case
of fault position at bus 10. The Fig.5 is 3D graphic of
the objective function for all scenarios of placement of
2 D-Statcoms in case of Zf = 1.6p.u. A scenario is a
point with its ordinates equal to D-Statcom’s locations.
Also, because we don’t consider the permutation for
the pair of D-Statcom’s location (e.g. 1-2 is the same
as 2-1), we only consider points on the triangle from
the main diagonal of the matrix of scenarios of
placement of 2 D-Statcoms. The points in the other
triangle of the above said matrix are not considered and
thus its objective function is given a high value (e.g.
F=4p.u.). Besides, for the scenarios that result in the
power of one or both two D-Statcoms greater than
SDSmax, they are also not considered as candidate
scenarios and their objective function is also equal to
4p.u. Objective function gets its minimum of
0.1611p.u. for D-Statcoms placed at buses 9 and 13.
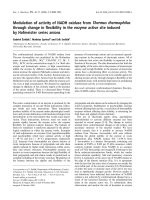
The resulting system bus voltages are all upgraded
above 0.8p.u. (Fig. 6).
Fig. 4. Flowchart of the problem of optimization
In the flowchart, input data that can be seen as
parameters are fault events. “postop” is the
intermediate variable that fixes the optimal scenario of
D-Statcom placement where the objective function is
minimized. The initial solution of objective function
Min equals 4 which is big value for starting the search
process. The method sweeps all cadidate scenarios in
the set of Tm to find the global optimal solution.
4. Result Analysis
4.1. Fault event scenarios
Fig. 5. Objective function for the placement of two DStatcoms for fault position at bus 10, Zf = 1.6p.u.
The research considers the following fault event
scenarios that have significant influence on the DStatcom’s size and objective function:
Short-circuit type and fault impedance: Threephase short-circuit through different values of fault
impedances Zf is considered. Three alternatives of fault
impedances Zf = 1.6(p.u.), 0.8(p.u.) and 0(p.u.) are
considered for analysing its influences in the problem
solutions. The paper mainly discusses the D-Statcom’s
effectiveness on voltage compensation in an event of
short-circuit in general, thus, other short-circuit types
are not considered.
Fig.6. System bus voltage without and with DStatcoms for short-circuit at bus 10, Zf = 1.6p.u.
The main results are summarized in the Table 2.
The system bus voltage before and after placing two
D-Statcoms are also depicted in Fig. 7.
Short-circuit positions: Two fault positions at
buses 10 and 30 are considered.
15
Journal of Science & Technology 139 (2019) 012-017
Table 1. Remarked results for placing two D-Statcoms
Fault impedance Zf (p.u.)
1.6
0.8
0
Objective function (p.u.)
0.1611
0.2825
0.3184
Optimal placement of DS 1
Bus 9
Bus 8
Bus 8
system. D-Statcom modeling for voltage sag
mitigation in short-circuit calculation of power system
is introduced basing on the application of Thevenin’s
superposition theorem. The problem of optimization is
solved on the minimization of objective function
which is the total system voltage deviation as per
“central improvement” approach with regard to DStatcom’s power constraint. This method allows us to
consider using a multiple of D-Statcoms in the case of
large distribution system that helps improve totally
system bus voltage in voltage sag events in distribution
system. Different scenarios of fault event including
short-circuit positions and fault impedances are taken
into account for assessing their influence to the
outcomes of the problem of optimization.
Short-circuit position at bus 10
Size (p.u.) of DS 1
0.0988
0.0822
0.0925
Optimal placement of DS 2
Bus 13
Bus 13
Bus 13
Size (p.u.) of DS 2
0.0965
0.0518
0.0858
Number of buses U > 0.8p.u.
33
33
33
Number of scena. SDS > SDS.max
310
358
423
Objective function (p.u.)
0.1096
0.1247
1.8066
Optimal placement of DS 1
Bus 28
Bus 28
Bus 9
Size (p.u.) of DS 1
0.0707
0.0793
0.0918
Optimal placement of DS 2
Bus 31
Bus 31
Bus 23
Size (p.u.) of DS 2
0.0839
0.094
0.0589
Number of buses U > 0.8p.u.
0.1096
0.1247
1.8066
366
381
404
Short-circuit position at bus 30
Number of scena. SDS > SDS.max
A cost model is not introduced for the problem of
optimization because the benefice from system voltage
sag mitigation is impossibly determined. Research can
be developed with regard to different fault events in
the same time for a better illustration for D-Statcom’s
system voltage sag mitigation.
References
The research considers the voltage tolerance of
0.8p.u. in Table 1 and 2 because we know that the
voltage sag duration is basically defined by
protection’s tripping time and for distribution system,
it’s normally in the range of 0.1-10s. According to
voltage ride through curve (e.g. ITIC [1]), the safe
voltage magnitude is 0.8pu. That’s why for the size of
distribution system as the IEEE 33-bus system, we can
only consider to use up to 2 D-Statcoms for system
voltage sag mitigation.
Fig. 7. System bus voltage without and with two DStatcom placements for short-circuit at buses 10, 30
5. Conclusion
This paper introduces a new method for
considering “central improvement” voltage sag
mitigation by a multiple of D-Statcoms in distribution
16
[1]
IEEE Std. 1159-2009, IEEE Recommended Practice
for Monitoring Power Quality (2009).
[2]
A. Ghosh and G. Ledwich; Power quality enhancement
using custom power devices; Kluwer Academic
Publishers, London (2002).
[3]
Math H. J. Bollen; Understanding power quality
problems: voltage sags and interruptions; IEEE Press,
John Wiley& Sons, Inc. (2000).
[4]
M. Farhoodnea, et al.; A Comprehensive Review of
Optimization Techniques Applied for Placement and
Sizing of Custom Power Devices in Distribution
Networks; PRZEGLĄD ELEKTROTECHNICZNY
R. 88 NR. 11a, (2012).
[5]
E. Babae, et al.; Application of flexible control
methods for D-STATCOM in mitigating voltage sags
and swells, IEEE Proceedings, IPEC 2010 conference,
Singapore, 27-29 Oct. (2010).
[6]
F. Hamoud, et al.; Voltage sag and swell mitigation
using D-STATCOM in renewable energy based
distributed generation systems; IEEE Proceedings,
20th Int’l Conf. EVER, Monaco. 11-13 April (2017).
[7]
P. Jyotishi, et al.; Mitigate Voltage Sag/Swell
Condition and Power Quality Improvement in
Distribution Line Using D-STATCOM; International
Journal of Engineering Research and Applications,
Vol. 3, Issue 6, (2013) 667-674.
[8]
D. K. Tanti et. Al., An ANN Based Approach for
Optimal Placement of D-STATCOM for Voltage Sag
Mitigation; International Journal of Engineering
Science and Technology (IJEST), Vol. 3, No. 2, (2010)
827–835.
Journal of Science & Technology 139 (2019) 012-017
[9]
Y. Thangaraj, et al., Optimal placement and sizing of
DSTATCOM using Harmony Search algorithm,
Elsevier, ScienceDirect; Proceedings, International
Conference on Alternative Energy in Developing
Countries and Emerging Economies, Bangkok,
Thailand (2015).
Power System Performance Improvement; Research
Journal of Applied Sciences, Engineering and
Technology, Vol. 10, No. 5, (2015) 484–494.
[13] Y. Zhang, J. V. Milanovic; Global Voltage Sag
Mitigation With FACTS-Based Devices; IEEE
Transaction on Power Delivery, Vol. 25, No. 4 (2010)
2842–2850.
[10] S. A. Taher, S. A. Afsari; Optimal location and sizing
of DSTATCOM in distribution systems by immune
algorithm, Elsevier, ScienceDirect, International
Journal of Electrical Power & Energy Systems, Vol.
60, No. 3 (2014) 34–44.
[14] B. Q. Khanh, et al.; Using the Norton’s Equivalent
Circuit of DVR in Optimizing the Location of DVR for
Voltage Sag Mitigation in Distribution System;
GMSARN International Journal Vol.12, No. 3 (2018)
139-144.
[11] Y. Thangaraj, Multi-objective simultaneous placement
of DG and DSTATCOM using novel lightning search
algorithm, Elsevier, Journal of Applied Research and
Technology, Vol. 15. No. 5 (2017).
[15] J. J. Grainger, W. D. Stevenson; Power System
Analysis; McGraw-Hill, Inc. (1994).
[16] IEEE 1564-2014 – IEEE Guide for Voltage Sag
Indices (2014).
[12] M. A. Ali, et al.; Optimal Placement of Static
Compensators for Global Voltage Sag Mitigation and
17