Analyzing the shape of the upper part on the middle-aged male body in Ho Chi Minh City – Vietnam
Bạn đang xem bản rút gọn của tài liệu. Xem và tải ngay bản đầy đủ của tài liệu tại đây (317.53 KB, 5 trang )
Journal of Science & Technology 143 (2020) 068-072
Analyzing the Shape of the Upper Part on the Middle-Aged Male Body in
Ho Chi Minh City – Vietnam
Nguyen Mau Tung 1,2, Tran Thi Minh Kieu1*, Pham Thi Thao2, Pham The Bao3
1
Hanoi University of Science and Technology – No. 1, Dai Co Viet Str., Hai Ba Trung, Ha Noi, Viet Nam
Industrial University of Ho Chi Minh City - No. 12 Nguyen Van Bao, Ward 4, Go Vap District, Ho Chi Minh
3
Sai Gon University - 273 An Duong Vuong, Ward 3, 5 District, Ho Chi Minh City
Received: August 10, 2018; Accepted: June 22, 2020
2
Abstract
The cross-sectional research method was used to analyze the shape of the upper body of middle-aged men.
The 3D anthropometric measurements data was collected from 378 different men aged 30-60 in HCMC by
using the 3D Size Stream Body Scanner. Later the data was processed by statistical probability math and
SPSS 25 software. The statistics indicate that most of the surveyed people have higher left shoulder height
than their right shoulder height. The increase in circumference indexes leads to the wide index of the
circumference increase. As people get older, their body height tends to decrease. The older people get, the
bigger their chest size and waist size circumference indexes become with the front part increases more than
the back part.
Keywords: The top of body, middle-aged male, analysis the shape of body, Ho Chi Minh City.
Where: n is the sample number; probability or desired
confidence level (p = 0.95); t is the margin of error or
z-score (t = 1.96), m is the allowed measure error (m
= 0.5), SD standard deviation (SD = 4.96 cm, is the
head height standard deviation of preliminarily
measuring of 150 samples randomly). The research
surveyed 378 males randomly.
1. Introduction
Vietnam's textile and garment industry has been
developing strongly and plays an increasingly
important role in economic growth of the country.
Nowadays, in* Vietnam the garment market is
developing very strongly, serving local consumer
demands. Characteristics of human body plays an
important role in designing costume styles. The
changes in living conditions makes the body shape
change. The Atlat Anthropology of Vietnamese
people in working age since 1986 [1] was no longer
fit with the human body shape these days, therefore,
studying the shape of middle-aged male body aged
30-60 in Ho Chi Minh City has an vital meaning for
the fashion industry to be able to come up with timely
design solutions to meet the demand of beautiful
wear, fit comfortably by consumers.
2.2. Object and scope of the research
Measuring subjects are randomly selected 378
middle-aged men aged 30-60, living in Ho Chi Minh
City working in office and teacher environments.
Study subjects were divided into 3 groups [1]: Group
1: 30-40 years, Group 2: 41-50 years, Group 3: 51-60
years old.
Analyzing the shape of the upper middle-aged
body.
2. Subjects and research methods
2.3. Research Methods
2.1. Subjects of research
Cross-sectional research method. Using the US
3D Size Stream Body Scanner, measuring the
monitoring of anthropometric measurements.
Vietnamese male, Kinh majority, living and
working in Ho Chi Minh City, aged from 30 to 60
years old, voluntarily participated in the survey
randomly. The sample size of the research was
determined according to the formula:
n
Data processing method: statistical probability
math and using SPSS 25 to determine statistical
characteristics: average value (M), standard deviation
(SD), coefficient of variation (CV).
t 2 SD 2 1.96 2 4.96 2
378.038
m2
0, 5 2
3. Research results and discussion
The characteristics of statistics of male body
size from 30 to 60 years (with 3 age groups: group 1
from 30-40 years old, group 2 from 41-50 years old,
group 3 from 51-60 years old) after data processing
by SPSS25 are shown in Table 1.
*
Corresponding author: Tel.: (+84) 988.709.885
Email:
68
Journal of Science & Technology 143 (2020) 068-072
Table 1. The value of HCMC middle-aged male body measurements from 30 to 60 years old
Measurement
The neck part
1
2
3
4
5
6
7
8
9
10
11
12
The arm part
13
14
15
16
17
The chest and back part
18
19
20
21
22
23
24
25
The stomach
26
27
28
29
30
Head_height (cm)
Neck height (cm)
Neck Circumference
(cm)
Neck Width (cm)
Neck Thickness (cm)
Shoulder Height (cm)
Shoulder Slope (cm)
Back Shoulder Width
Horizontal (cm)
Shoulder Length (cm)
Shoulder Angle (°)
Arm Length (cm)
Elbow Length (cm)
Arm Hole
Circumference (cm)
Bicep Circumference
(cm)
Elbow Circumference
(cm)
Forearm
Circumference (cm)
Wrist Circumference
(cm)
Chest Height (cm)
Upper Bust Girth (cm)
Chest / Bust
Circumference (cm)
Across Chest Arm to
Arm (cm)
Across Back Arm to
Arm (cm)
Bust to Bust Length
(cm)
Chest Width (cm)
Chest Thickness (cm)
Abdomen
Circumference (cm)
Neck to Back Waist
(cm)
Neck to Front Waist
(cm)
Front Abdomen
Circum ference (cm)
Back Abdomen
Circum ference (cm)
Symbol
M
Min
Max
SD
Me
Mo
CV%
Hh
Nh
23.61
7.88
19.55
4.25
27.72
11.77
1.56
1.47
23.56
7.86
23.62
7.76
6.62
18.66
Nc
41.43
37.21
48.86
1.93
41.13
41.48
4.65
Nw
Nt
Sh
Ss
13.39
12.98
136.91
4.82
11.86
11.43
125.65
3.13
15.96
15.57
149.61
6.84
0.84
0.75
4.73
0.82
13.32
12.95
136.44
4.84
13.43
12.85
136.46
4.84
6.25
5.75
3.45
16.94
Bsw
43.73
38.46
49.20
2.24
43.33
43.64
5.12
Sl
Sa
Al
El
14.14
19.96
56.78
32.56
10.53
13.05
50.56
28.15
18.09
27.47
63.88
37.68
1.29
3.17
2.62
1.96
14.13
19.71
56.75
32.51
14.08
19.77
56.75
32.54
9.11
15.88
4.62
6.01
Ahc
45.33
37.49
53.90
3.06
45.51
45.55
6.74
Bc
29.65
24.50
35.63
2.16
29.76
29.91
7.30
Ec
26.96
22.65
31.74
1.53
26.94
26.94
5.69
Fc
26.71
22.64
30.99
1.42
26.56
26.79
5.32
Wc
17.00
14.21
20.99
1.03
16.94
16.78
6.08
Ch
Ub
121.64
99.42
111.24
85.62
133.58
114.01
4.39
4.81
121.11
98.94
121.43
99.75
3.61
4.84
Cc
96.12
83.48
109.74
5.03
95.86
96.13
5.23
Aca
36.35
32.52
40.21
1.52
36.24
36.33
4.19
Aba
38.73
34.74
43.23
1.66
38.65
38.87
4.28
Btb
19.96
16.82
23.98
1.24
19.89
19.46
6.24
Cw
Ct
34.30
23.81
29.45
19.68
39.23
28.19
1.68
1.64
34.15
23.76
34.63
24.09
4.89
6.88
Ac
88.08
73.65
103.77
6.09
88.02
88.06
6.92
Nbw
49.04
41.76
56.93
2.60
49.04
49.02
5.31
Nfw
47.47
40.03
55.29
2.76
47.51
47.48
5.81
Fac
45.40
35.08
57.93
3.58
45.05
45.04
7.89
42.68
34.12
51.27
2.95
42.38
42.85
6.91
Bac
69
Journal of Science & Technology 143 (2020) 068-072
City is 7.88 cm, head height (Hh) is 23.61cm, thus the
neck is in the form of average high neck.
3.1. Characteristics of the neck
The shape of neck is evaluated based on the
ratio of neck width (Wn) to the neck thickness (Nt)
[3]. Previous research [3] showed the ratio to classify
male neck into 3 groups of neck types as follow: (1)
the wide neck with ratio is 1 ± 0.05; (2) the average
neck with ratio is 0.9 ± 0.05; (3) the slender neck with
ratio is 0.8 ± 0.05.
3.2. Shoulder part characteristics
Characteristics of shoulder measurements for
three age groups are summarized in Table 3 and
Table 4.
Table 3. The average value of the shoulder part
measurements
Table 2. The average value of neck measurements
Measure
-ment
(cm)
The
age
group
Nh
Group 1
8.38
13.20
12.86
41.02
1.03
Group 2
7.81
13.49
12.94
41.53
1.04
Group 3
7.33
13.52
13.16
41.82
1.03
M
7.88
13.39
12.98
41.43
1.03
Nw
Nt
Nc
Size symbols Group 1 Group 2 Group 3
(Nw/
Nt)
M
Bsw(cm)
43.83
43.71
43.63
43.73
Sl (cm)
14.40
14.03
13.94
14.14
Sa (°)
19.00
20.32
20.78
19.96
Ss (cm)
4.68
4.87
4.95
4.82
Evaluating the balance between right and left
shoulders for the three age groups is shown by the
dimensions in Table 4.
Table 4. The average value of right and left shoulder
height, shoulder slope.
Summarizing the value of the size and the
proportion of the neck of the three age groups of
HCMC middle age men, is shown in Table 2. The
result showed that:
Age
group
Size
symbols
- The higher the age, the shorter the height of the
neck (Nh)
Sh (cm)
- Neck circumference (Nc), neck width (Nw),
neck thickness (Nt) are increasing with age gradually.
Sa (°)
Group 1
Group 2
Group 3
Left Right
Left
Right
Left Right
should- should- should- should- should- shoulder
er
er
er
er
er
138.32 137.66 137.17 136.29 136.12 135.36
18.52
19.48
19.78
20.86
20.13
21.42
The results from Table 3 and Table 4 affirm
some facts are:
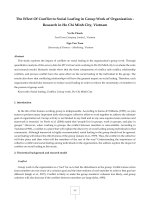
- Classification of neck shape: The ratio between
the neck width and the neck thickness of HCMC
middle-aged ranges from 1.03 -1.04, inferring the
cross-sectional area of the circle type as in Figure.1a.
That means their neck shape is a kind of wide.
- The shoulder width (Bsw) and the shoulder
length (Sl) are shorter when older.
- The shoulder width (Bsw) or shoulder angle (Sa)
gradually increases with age, but this increasing
number is not large, only from 4.68 cm to 4.95cm.
The shoulder angle (Sa) from 19.0(°) to 20.78(°)
increases by nearly 2(°), because of the older, the
shoulder and the shoulder heigth are sluggish but not
significant.
- The shoulders shape of HCMC middle-aged
male can be classified as the average shoulder. Their
shoulder shape could be described: there is a large
slope from the shoulder intersecting neck point to the
shoulder point, and from the shoulder point to the
point of the shoulder outer edge is almost horizontal.
Fig. 1. Cross section of the neck
- According to the authors of research “Perception
of body appearance and its relation to clothing” [2],
the neck height is about 1/3 higher than the head
height. Also, according to Table 1, the average value
of middle-aged neck height (Nh) in Ho Chi Minh
- The right shoulder height (Sh) is lower than the
left; The right shoulder has a shoulder angle (Sa)
higher than the left. Therefore, it could be summed up
with a a result that the right shoulder is saggier than
the left shoulder.
70
Journal of Science & Technology 143 (2020) 068-072
- Bust to bust (Btb) gradually increases with age,
because of the fat
3.3. Arm part characteristics
The average values of the arm measurements of
HCMC middle-aged male are presented in Table 5.
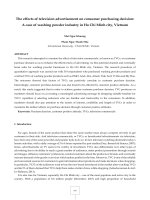
- Body form for male are evaluated based on the
Lorent Index [3]. Reference shows that: Lorent index
= Chest circumference at armpit level (Cc) – Waist
circumference (Wc). The characteristic of male body
form is classified according to Lorent Index: when
Lorent index > 14 is a thin person; Lorent Index = 14
is the average person; Lorent Index <14 is fat person.
When evaluate the body form by Lorent Index, the
results of HCMC in three age groups are 13.28, 11.5,
8.75 in relation to group 1, grops 2, group 3, as
showed in Figure 2. All are lower than 14 and this is
meant that HCMC middle-age male have the fat body
form when evaluate the body form by Lorent Index.
Table 5. The average values of arm measurements
Measurement
symbols (cm)
Al
El
Ahc
Bc
Ec
Fc
Wc
Group 1 Group 2 Group 3
57.02
32.81
44.90
29.40
26.57
26.79
16.82
56.96
32.75
45.34
29.72
26.69
26.90
16.97
56.28
32.06
45.86
29.91
26.89
27.24
17.23
M
56.78
32.56
45.33
29.65
26.71
26.96
17.00
- Chest circumference (Cc), chest thickness (Ct),
chest width (Cw) have important implications for the
shape of the chest. Through Table 6 and Figure 3, it is
realized ratio Aba/Aca is 1.06 and 1.07, which
belongs to the average chest type.
The characteristics of arm measurements for
three age groups are summarized as follow:
- Length of the arm: The older the length of the
arm (Al), the shorter the arm is.
- The classification of middle-aged chest shape:
Group 1 has more back muscles than the following
two groups, because the Aba/Aca ratio is the lowest.
- Armhole circumference (Ahc), biceps
circumference (Bc), elbows circumference (Ec),
forearm circumference (Fc) and wrist circumference
(Wc): all measurements are increasing with age. It is
because the older people get the more fat accumulate.
- Classification by arm length: Through table 5,
we can see that the Arm length of middle-aged male
in Ho Chi Minh City is in the range of 56,28 cm 57,02 cm and is classified as medium arm length.
3.4. Characteristics of chest and back
Fig. 2. Lorent index of HCMC middle-age male
Table 6 presents the average value of the
measurements for the chest part of HCMC middleaged male. The values showed that:
- The chest height (Ch) is getting lower when
person is getting older, because the intervertebral disc
between the vertebrae gradually collapses over time.
- The chest circumference (Cc) gradually
increases with age, because the older the age of 50-60
years of excess fat accumulates more.
Fig. 3. Aba/Aca ratio of three age groups of HCMC
middle-aged male
Table 6. The average value of chest measurements
Measurement
symbols
(cm)
The
age group
Ch
Ubg
Btb
Cc
Aba
Aca
Ac
Cw
Ct
Group 1
122.82
99.16
19.59
95.12
38.43
36.28
85.88
34.19
23.54
Group 2
121.51
99.43
19.99
95.87
38.86
36.34
87.93
34.23
23.71
Group 3
120.30
99.72
20.38
97.62
38.99
36.45
90.98
34.51
24.24
M
121.64
99.42
19.96
96.12
38.73
36.35
88.08
34.30
23.81
71
Journal of Science & Technology 143 (2020) 068-072
- The characteristics of the back can be seen
through measurements depth waist length and the
difference (Nbw) – (Nfw).
between the front waist and back waist is getting
larger.
- When person is getting older, his chest and
abdomen become bigger, but the abdomen is
increasing bigger than the chest.
- Depth waist length: value front waist length
(Nfw) and the back-waist length (Nbw) of group 3 for
this measurement is lower than other groups, thus
proving that the older person get, the back length is
reduced, because the disc between the vertebrae is
collapsed.
Thus, according to Table 8, the abdomen of
HCM City middle-aged male is convex.
4. Conclusion
- The difference between the back waist length
(Nbw) and front waist length (Nfw) and the gradually
increases with age as showed in Table 7, thus proving
that the older person is getting, the back is getting
more curved.
Researched 378 HCMC middle-aged male
subjects according to 3 age groups. Analyzing the
upper body shape according to 30 main
measurements. All measurements were measured by
Size Stream 3D scanner.
Table 7. Difference between the back waist length
and the front waist length
Characteristics of the neck: the cross-sectional
area appeared round shape, wide-neck type with an
average high neck.
Measurement
Symbols
(cm)
Nbw
Nfw
(Nbf - Nfw)
Shoulder characteristics: The slope of shoulder
increases when age increases. The shoulders are in
the common shape, the right shoulder is shorter than
the left shoulder.
The age group
Group 1
49.68
48.25
1.43
Group 2
48.89
47.30
1.59
Group 3
48.40
46.67
1.73
M
49.04
47.47
1.57
Characteristics of the chest and abdomen: The
circumference increases when age increases, leading
to the width also increases. The front part
circumference increases more than the back part.
Characteristics of the back: When person gets
older, the back is curved more leading to the bigger
difference between the back waist and front waist.
Table 8. Summarize the average value of abdominal
sections
Fac
Bac
Ac
Cc
Characteristics of arm: armhole, bicep
circumference, elbow and wrist circumference are
gradually increasing with age. The arm length is
medium form.
Measure
-ment
(cm)
The
age
group
Group 1
(Cc–
Ac)
44.01
41.87
85.88
95.12
9.24
Group 2
45.18
42.75
87.93
95.87
7.94
Acknowledgement
Group 3
47.37
43.61
90.98
97.62
6.64
M
45.40
42.68
88.08
96.12
8.04
This research is funded by the Hanoi University
of Science and Technology (HUST) under project
number T2018-PC-048.
The result of this study is an important basis for
application of suitable clothing design for Ho Chi
Minh City middle-aged male.
3.5. Abdominal characteristics
References
Research results of abdominal measurements are
shown in Table 8. Results were analysed and
discussed as follow:
[1]
Atlat Anthropology of Vietnamese people in working
age (1986) - Hanoi Science and Technology
Publishing House.
- As the age increases, waist circumference (Ac)
increases. HCMC male in the age of 50-60 have the
largest waist in compared to other groups. They have
front waist is larger than the back waist. Research
also found that when person gets older, difference
[2]
J. Fan, W. Yu and L. Hunter (2004). Perception of
body appearance and its relation to clothing,
published by Woodhead Publishing Limited in
association with The Textile Institute.
[3]
ГОСТ 17522-72 – Типовые фигуры женщин.
Размерные признаки для проектирования одежды.
72