Economic evaluation of the breast cancer screening programme in the Basque Country: Retrospective cost-effectiveness and budget impact analysis
Bạn đang xem bản rút gọn của tài liệu. Xem và tải ngay bản đầy đủ của tài liệu tại đây (867.2 KB, 9 trang )
Arrospide et al. BMC Cancer (2016) 16:344
DOI 10.1186/s12885-016-2386-y
RESEARCH ARTICLE
Open Access
Economic evaluation of the breast cancer
screening programme in the Basque
Country: retrospective cost-effectiveness
and budget impact analysis
Arantzazu Arrospide1,2,3*, Montserrat Rue3,4, Nicolien T. van Ravesteyn5, Merce Comas3,6, Myriam Soto-Gordoa1,
Garbiñe Sarriugarte7 and Javier Mar1,2,3,8
Abstract
Background: Breast cancer screening in the Basque Country has shown 20 % reduction of the number of BC
deaths and an acceptable overdiagnosis level (4 % of screen detected BC). The aim of this study was to evaluate
the breast cancer early detection programme in the Basque Country in terms of retrospective cost-effectiveness
and budget impact from 1996 to 2011.
Methods: A discrete event simulation model was built to reproduce the natural history of breast cancer (BC). We
estimated for lifetime follow-up the total cost of BC (screening, diagnosis and treatment), as well as quality-adjusted
life years (QALY), for women invited to participate in the evaluated programme during the 15-year period in the
actual screening scenario and in a hypothetical unscreened scenario. An incremental cost-effectiveness ratio was
calculated with the use of aggregated costs. Besides, annual costs were considered for budget impact analysis. Both
population level and single-cohort analysis were performed. A probabilistic sensitivity analysis was applied to assess
the impact of parameters uncertainty.
Results: The actual screening programme involved a cost of 1,127 million euros and provided 6.7 million QALYs
over the lifetime of the target population, resulting in a gain of 8,666 QALYs for an additional cost of 36.4 million
euros, compared with the unscreened scenario. Thus, the incremental cost-effectiveness ratio was 4,214€/QALY.
All the model runs in the probabilistic sensitivity analysis resulted in an incremental cost-effectiveness ratio lower
than 10,000€/QALY. The screening programme involved an increase of the annual budget of the Basque Health
Service by 5.2 million euros from year 2000 onwards.
Conclusions: The BC screening programme in the Basque Country proved to be cost-effective during the
evaluated period and determined an affordable budget impact. These results confirm the epidemiological
benefits related to the centralised screening system and support the continuation of the programme.
Keywords: Breast cancer, Screening, Cost-effectiveness, Budget impact analysis, Simulation, Modelling,
Evaluation, Public health
* Correspondence:
1
Gipuzkoa AP-OSI Research Unit, Integrated Health Organization Alto Deba,
Avda Navarra 16, 20500 Arrasate-Mondragón, Gipuzkoa, Spain
2
Aging and Chronicity Health Services Research Group, BIODONOSTIA
Research Institute, Paseo Dr Beguiristain s/n, 20014 Donostia, Gipuzkoa, Spain
Full list of author information is available at the end of the article
© 2016 The Author(s). Open Access This article is distributed under the terms of the Creative Commons Attribution 4.0
International License ( which permits unrestricted use, distribution, and
reproduction in any medium, provided you give appropriate credit to the original author(s) and the source, provide a link to
the Creative Commons license, and indicate if changes were made. The Creative Commons Public Domain Dedication waiver
( applies to the data made available in this article, unless otherwise stated.
Arrospide et al. BMC Cancer (2016) 16:344
Background
The evaluation of breast cancer (BC) screening is the
subject of a controversial debate regarding its benefit
and harms [1, 2]. The BC Screening Programme in the
Basque Country (BCSPBC) invited more than 400,000
women from its start in 1996 through 2011 involving
more than 1.3 million mammograms. Therefore a great
annual investment was assigned in order to obtain future
health benefit. During this period (1996–2011) the
screening programme reduced 20 % the number of BC
deaths whereas 4 % of screen detected BC were overdiagnosed, which has been found to be an acceptable
level [1, 3]. Although, these figures support the continuity of the programme, such a mass preventive intervention must be evaluated also in economic terms to
warrant that the allocated resources are a worthwhile investment for the entire population [4].
As BC screening has been employed differently
throughout the world [5], its evaluation needs to be fitted to the features of the actual women screened and to
the implementation of the programme in reality. It is necessary to adopt a population-based approach in order
to reflect all the demographic, epidemiological and clinical characteristics of the target population. In contrast
with single cohort models, population-based models
allow taking into account the heterogeneous composition of the population [6]. At the same time, this approach involves modelling the costs and benefits of all
patients comprising both the cohort starting screening
in the current year and those already undergoing screening from previous years [7]. Moreover, the interaction of
population dynamics and heterogeneity, specially related
to aging, could have a substantial effect on the final result of the evaluation [6, 8]. Although Markov modelling
is the most common approach in cost-effectiveness
analysis, discrete-event simulation models permit more
flexible structures which allows including all these characteristics in a single model [9, 10]. Using discrete-event
simulation an artificial entity is created for each woman
included in the BCSPBC and it is permitted to assign all
kind of attributes to this entity in order to specify the
evolution of that woman related to breast cancer and
the correspondent effect of screening. By including the
whole amount of entities that individually represent the
invited women, the target population can be reproduced.
Allowing multi-cohort modelling is a key advantage of
discrete-event simulation in order to carry out economic
evaluation of public health programmes.
In the context of the BCSPBC, we can retrospectively
examine the cost and effectiveness for the period 1996
through 2011. Recently, a simulation model was developed with the aim of estimating the effect of the
BCSPBC mainly in terms of BC mortality decrease and
overdiagnosed cases [3]. We have used the same model,
Page 2 of 9
already calibrated and validated, to estimate overall costs
and quality adjusted life years (QALY) attributable to the
screening programme. Additional information in terms
of budget impact analysis will help decision-makers to
fully understand the economic impact of the screening
programme on the budget of the Basque health system.
Cost-effectiveness analysis and budget impact analysis
provide complementary information and both are necessary when a large volume of the population is involved
in the assessed intervention [11].
The aim of this study was to carry out the evaluation
of the BC early detection programme in the Basque
Country in terms of cost-effectiveness and budget impact from 1996 to 2011.
Methods
A discrete event simulation model [9, 10] was built to
reproduce the natural history of BC according to the key
characteristics of the female population invited into the
programme from its beginning in 1996 through 2011
[3]. The screening test for BCSPBC consisted of mammography with double projection carried out biennially
on all women aged 50 to 69 years. The target population
comprised multiple cohorts of women; not only women
who were invited to the programme for the first time
but also successive invitations for those already included
in the BCSPBC [7, 12], thus a multiple-cohort model
(dynamic model) was used to represent the whole population including women invited in different calendar
years. The model allowed lifetime follow-up for each
woman invited to the programme to measure both the
long-term costs and benefits of screening. The evaluation period was defined as 1996 through December 31,
2011, as the target population of the programme was
changed during 2012 and extended to women in their
40’s with a first-degree family history of BC. However,
the simulation model allowed lifetime follow-up in order
to estimate the future effects of the screening during the
evaluated period. The Ethics Committee for Clinical
Research in Gipuzkoa Health Area evaluated and approved the study.
Model overview
We modelled the natural history of BC using the approach of Lee et al. [13]. Four main states of health were
distinguished: (1) disease-free or undetectable BC; (2)
asymptomatic BC that could be diagnosed by screening;
(3) symptomatic BC diagnosed clinically; and (4) death
from BC. Time-to-event distributions used for the modelling of the natural history of BC were obtained from
previous studies [13–15]. All-cause mortality, excluding
breast cancer specific mortality was also included as a
competing risk [16].
Arrospide et al. BMC Cancer (2016) 16:344
Page 3 of 9
Other model input data, such as the exact number of
women invited for the first time and their age at the first
invitation, programme sensitivity and specificity, the
number of positive mammography results and the additional diagnostic tests carried out, and age- and stagespecific cancer incidence were obtained from the BCSPBC
database. The final model was calibrated to obtain the
closest possible results to observed data. A full description
of the model has already been published [3], however a
Methodology Appendix (Additional file 1) which describes
the main model details and contains a simplified diagram
of the model is also available online.
Utilities
Due to the lack of quality of life estimations in women
affected by BC we decided to apply the methodology described by Stout et al to estimate the age-specific
quality-of-life utility weights for the different health
states [17]. The first step consisted of obtaining agespecific EuroQol EQ-5D quality-of-life utility weights for
general Spanish women population [18]. Following the
aforementioned approach, specific percentages were applied to general population utilities in order to estimate
the potential negative effects of a BC diagnosis during
the first year of treatment and end of life (Table 1). We
considered end of life equivalent to the metastatic stage
in terms of quality of life and duration.
Costs
The perspective of the Basque National Health Service
was considered for the economic evaluation. We included both BC diagnosis (screening and additional
diagnosis tests) and treatment costs (initial, follow-up
and end of life), based on resource consumption and
unit costs of the Basque Health Services. The methodology of calculating the unitary costs is fully described
elsewhere by Arrospide et al. [19].
The diagnostic costs included screening mammography (42.28€) and other diagnostic tests carried out in
the reference hospital such as echography (44.14€), fine
needle aspiration (113.49€), core needle biopsy (127.46€)
and surgical biopsy (2,594€). Attendants were classified
in 5 groups according to screening mammography evidence for BC. Women in the highest groups (3 to 5)
Table 1 Quality of life weights in Spanish women population
and its reduction due to breast cancer detection
Health state
Age
Healthy [18]
In Situ or Stage I
Stage II or III
Stage IV
50–64
0.824
0.742
0.618
0.495
65–74
0.770
0.693
0.578
0.462
75–84
0.682
0.614
0.512
0.409
>84
0.563
0.507
0.422
0.338
were assigned additional tests, one or several, according
to the probability observed in the programme data base
for the correspondent evidence group.
Treatment costs for BC detected in a clinical stage
other than IV were divided into initial and 5-year
follow-up costs. When BC was the cause of death, we incorporated the increased costs of the last year of life
using the cost of metastatic stage. Initial treatment costs
included surgery, radiotherapy and chemotherapy.
Pharmacological treatment and medical consultations
were incorporated in follow-up costs. For cases of metastatic BC, only annual follow-up costs were calculated.
The initial cost was 9.838€ for stage 0, 17.273 for I,
22.145 for II, and 28.776 for III. The follow-up annual
cost was 172€ for stage 0, 908 for 1,994 for II, and 1,166
for III. The annual cost for stage IV was 17,879€.
Cost-effectiveness analysis
Two identical populations were created and followed
until death to estimate lifetime costs and QALYs in the
screened and unscreened populations. Women in the
screened arm were invited according to BCSPBC implementation and no screening mammography was simulated from year 2011 onwards. However, lifetime time
horizon was applied to the model to include long-term
screening effects. According to the approach applied by
Stout et al, during this 15-year period (retrospective
time), neither costs nor QALYs were discounted, and a
3 % annual discount rate was applied prospectively to
both costs and QALYs, beginning from the end of the
evaluated period (31st December 2011) until death
[17, 20]. In addition, a complementary scenario with no
discount (0 % discount) applied was also considered.
The same model was employed to calculate the ICER
for the case of a single cohort of 50,000 women aged
50 years invited to join the programme for the first time
in 1996. We used the same alternatives as in the population level approach (with and without screening). As
cost-effectiveness analysis is generally applied for a single cohort, these complementary results permit comparison with published data.
Probabilistic sensitivity analysis
The probabilistic feature of the model was based on
varying the main variables randomly at the same time
[21]. Each variable was assigned a distribution fitting the
range of all possible values and at the beginning of each
simulation a random generator selected the value for
each variable from the specified distribution. This permitted to examine the effect of joint uncertainty in the
variables of the model through cost-effectiveness plane
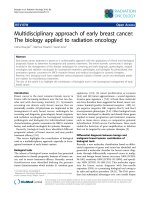
and acceptability curve [21]. The cost-effectiveness plane
displays the incremental cost (vertical axis) and effectiveness (horizontal axis) results of 1,000 simulation runs
Arrospide et al. BMC Cancer (2016) 16:344
(Fig. 1). The mean value and 95 % confidence intervals
(CI) were shown for the total costs and QALYs, for the
differences between the results for the two scenarios,
and for the ICER. The distributions used for the main
parameters varied in the probabilistic sensitivity analysis
were detailed in the Methodology Appendix (Additional
file 1).
Variability in participation rates was not included in
the main probabilistic sensitivity analysis as variability
was assumed very small. However, as we were concerned
about the interest on the variation of this parameter we
ran cost-effectiveness analysis for the main single-cohort
model in two more scenarios with lower participation
rates: 50 and 30 %.
Budget impact analysis
The simulation model built for multi-cohort costeffectiveness analysis was used simultaneously for budget
impact analysis. Cost-effectiveness analysis allows estimating the additional benefit of a new treatment in
relationship with its cost and permit comparing the
results to those obtained for already accepted treatments. Undoubtedly, the framework described for costeffectiveness analysis is accepted by experts panels all
over the world [8, 22]. However there are some doubts
Page 4 of 9
about its real application when health services management is based on a fixed budget. Budget impact analysis
provides a new tool to estimate the effect of the decision
hold on the future budget of the health services. As defined by Mauskopf et al. budget impact analysis assesses
the impact of a new intervention in annual costs, annual
health benefits and other important outcomes from its
implementation onwards [11, 23].
The model was developed to calculate the annual costs
for BC diagnosis and treatment in both the screened and
unscreened populations. Diagnostic resources included
screening or symptomatic mammograms, as well as
other additional diagnostic tests that were implemented
in the reference hospital. Treatment costs involved the
initial treatment of the BC detected each year and
follow-up therapy for prevalent BC, as well as end-of-life
costs for those who died from BC. As the budget impact
analysis presented financial streams over time, it was not
necessary to discount the costs [11].
Results
The results of the population-level cost-effectiveness
analysis are shown in Table 2. The 15-year evaluation
demonstrated a cost of 1,126.6 million euros (1,608.7
million euros, undiscounted) and a provision of 6.70
Fig. 1 Short title: Cost-effectiveness plane for the period from 1996 through 2011. Detailed legend: Cost-effectiveness plane showing the variability in
population-level cost-effectiveness analysis for the period from 1996 through 2011
Arrospide et al. BMC Cancer (2016) 16:344
Page 5 of 9
Table 2 Cost-effectiveness analysis of breast cancer screening using the multi-cohort (population level) approach
0 % discounta
Mean
3 % discounta
95 % CI
Mean
95 % CI
Screened population
Total costs (Million Euros)
1,608.7
1,566.0
1,651.7
1,126.6
1,097.8
1,155.3
Screening mammography costs
55.3
55.2
55.5
55.3
55.2
55.5
Screening diagnosis workup
12.1
11.5
12.7
12.1
11.5
12.7
Clinical cancers diagnosis workup
26.1
25.2
27.0
18.3
17.6
18.9
Treatment costs
1,515.1
1,472.8
1,557.5
1,040.9
1,012.5
1,069.3
8,845,493
8,828,791
8,862,195
6,696,959
6,684,899
6,709,019
1,584.3
1,538.8
1,629.8
1,090.2
1,059.2
1,121.3
Screening mammography costs
0.00
0.00
0.00
0.0
0.0
0.0
Screening diagnosis workup
0.00
0.00
0.00
0.0
0.0
0.0
Clinical cancers diagnosis workup
30.2
29.2
31.11
22.2
21.5
22.9
Treatment costs
1,554.1
1,509.0
1,599.24
1,068.0
1,037.3
1,098.8
8,834,785
8,818,066
8,851,504
6,688,293
6,676,240
6,700,347
QALYs
Unscreened population
Total costs (Million Euros)
QALYs
Difference (Screened - Unscreened)
Total costs (Million Euros)
Screening mammography costs
24.4
8.5
40.3
36.4
24.6
1,557.5
55.3
55.2
55.5
55.3
55.2
55.5
Screening diagnosis workup
12.1
11.5
12.7
12.1
11.5
12.7
Clinical cancers diagnosis workup
−4.0
−5.1
−2.9
−3.9
−4.8
−3.1
Treatment costs
−39.0
−54.8
−23.1
−27.1
−38.9
−15.4
QALYs
10,708
9,499
11,917
8,666
7,746
9,586
ICER
2,294
738
3,850
4,214
2,703.41
5,725
CI confidence interval, QALY quality-adjusted life years, ICER incremental cost-effectiveness ratio
a
Discount applied beginning from the end of the evaluated period until death
million QALYs (8.84 million QALYs, undiscounted) for
lifetime follow-up. In the non-screened scenario, these
values were reduced to 1,090.2 million euros and 6.69
million QALYs. Thus, the ICER was 4,214€ per QALY
(2,294€/QALY, undiscounted). When disaggregated costs
are analysed, 92 % of the total costs were attributed to
BC treatment in the screened population. Over the entire study period more than 55 million euros were
invested in BC screening mammography, with an additional 12 million for further diagnostic tests, whereas
only four million euros were saved in clinical or
symptomatic diagnosis. Early detection also involved a
savings of more than 27 million euros in the treatment of BC detected in the evaluated population.
When a usual single-cohort cost-effectiveness analysis
was carried out, the final results were similar in terms
of ICER (Table 3).
Incremental costs and incremental effectiveness in
each of the 1,000 simulations carried out in probabilistic
sensitivity analysis are shown graphically in Fig. 1. All
the simulations resulted in an ICER lower than 10,000€
per QALY. In addition, the related acceptability curve
(Methodology Appendix) showed that in 3 % of the simulations screening was dominant (saved costs) both for
the single-cohort and multiple-cohort models when no
discount was applied. However, this percentage increased up to 21 % for the single-cohort model and 27 %
with population level approach when costs and QALYs
were discounted (3 % discount). On the other hand, incremental costs and effectiveness proportionally decreased when lower participation rates were applied in
the single-cohort model, therefore the incremental costeffectiveness ratio result similar in the three scenarios
(Table 4).
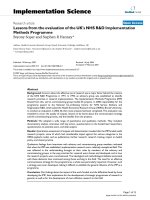
Annual total costs for budget impact analysis are
shown in Fig. 2. In 2011, more than 36 million euros
were necessary to continue with the BCSPBC and the
treatment costs related to previously detected BC; this
estimation is growing yearly. As a consequence of the
implementation of the screening programme, it had
been necessary to add up to 9.2 million euros to the
budget of the Basque Health Service in 1998. However,
this figure became relatively stable from year 2000 onwards in annual 5.2 million euros.
Arrospide et al. BMC Cancer (2016) 16:344
Page 6 of 9
Table 3 Cost-effectiveness analysis of breast cancer screening using a single cohort
0 % discounta
Mean
3 % discounta
95 % CI
Mean
95 % CI
Screened population
Total costs (Million Euros)
Screening mammography costs
213.0
204.7
221.3
161.9
155.9
167.8
12.5
12.458
12.5
12.5
12.5
12.5
Screening diagnosis workup
2.9
2.7
3.1
2.9
2.8
3.1
Clinical cancers diagnosis workup
3.0
2.9
3.2
2.2
2.1
2.3
Treatment costs
194.5
186.3
202.8
144.2
138.3
150.1
1,231,858
1,228,748
1,234,968
997,681
995,195
1,000,168
206.7
197.4
216.0
153.2
146.5
160.0
Screening mammography costs
0.0
0.0
0.0
0.0
0.0
0.0
Screening diagnosis workup
0.0
0.0
0.0
0.0
0.0
0.0
QALYs
Non-screened population
Total costs (Million Euros)
Clinical cancers diagnosis workup
3.9
3.7
4.1
3.1
2.9
3.2
Treatment costs
202.8
193.6
212.1
150.2
143.5
156.9
1,229,578
1,226,441
1,232,715
995,803
993,304
998,301
QALYs
Difference (Screened - Unscreened)
Total costs (Million Euros)
Screening mammography costs
6.3
2.5
10.1
8.6
5.7
202.8
12.5
12.5
12.5
12.5
12.5
12.5
Screening diagnosis workup
2.9
2.7
3.1
2.9
2.8
3.1
Clinical cancers diagnosis workup
−0.9
−1.1
−0.7
−0.9
−1.0
−0.7
Treatment costs
−8.3
−12.1
−4.5
−6.0
−8.9
−3.0
QALYs
2,280
1,986
2,575
1,879
1,650
2,108
ICER
2,778
974
4,582
4,623
2,830
6,416
CI confidence interval, QALY quality-adjusted life years, ICER incremental cost-effectiveness ratio
a
Discount applied beginning from the end of the evaluated period until death
Discussion
The BC screening programme in the Basque Country
proved cost-effective during the evaluation period with
both multi-cohort and single-cohort approaches assuming the recommended threshold of 30,000€ per QALY
[24]. When a 3 % discount was applied to costs and
Table 4 Cost-effectiveness analysis for a single cohort in
different attendance rate scenarios
Participation rate
Incremental costs
(Million Euros)
Incremental
effectivenes (QALYs)
ICER
Base Case
6.3
2,280
2,778
50 % attendance
3.2
1,715
1,888
30 % attendance
1.7
1,136
1,453
Base Case
8.6
1,879
4,623
50 % attendance
5.1
1,409
3,601
30 % attendance
2.9
934
3,051
0 % discount
3 % discounta
QALY quality-adjusted life years, ICER incremental cost-effectiveness ratio
a
Discount applied beginning from the end of the evaluated period until death
utilities from 2011 on, the ICER increased slightly but it
was still far below the established threshold. The simultaneous use of a combined and a single-cohort approach
was helpful to compare the efficiency of BC screening in
real population dynamics (multi-cohort model) and incident cohort (single-cohort). In both cases, the results are
valid only if the follow-up is long enough to achieve a
steady state in the interaction between the natural history of BC and all its determinants that are modified by
the screening. The steady state is defined as the time
when each recently observed behaviour of the system
(trade-off between short-term costs and long-term benefits) will remain constant in the future [25].
In a comparison of different screening programmes,
De Koning pointed out the dependence of the costeffectiveness on the attendance rate and the quality of the
programme [5]. Thus, this ICER is within the range of the
best programmes as the high participation rate (80 %) and
other quality indicators of the Basque programme fit well
the recommended guidelines [26, 27]. As noted in the
literature, some of those favourable figures are related to
the centralised system applied by the Basque Health
Arrospide et al. BMC Cancer (2016) 16:344
Page 7 of 9
Fig. 2 Short title: Budget impact analysis for the period from 1996 through 2011. Detailed legend: Budget impact analysis for the period from
1996 through 2011 for the scenarios with and without screening
Service to implement the BCSPBC [5]. Our results are
similar to other studies carried out in the Spanish context
that used ordinary, single-cohort cost-effectiveness analysis. Carles et al. obtained an ICER of 4,469€/QALY [28]
in Catalonia. The MIcrosimulation SCreening ANalysis
(MISCAN) model was developed in the 1980’s to evaluate
the effects of breast cancer screening in the Netherlands
[29] and applied to Navarra [30] resulted in an ICER of
2,650€/life-year gained (LYG), whereas, when the MISCAN model was applied to Catalonia, it resulted in 4,475
€/LYG [31]. Interestingly, application of the MISCAN
model in the Netherlands with the same strategy (women
aged 50–70 invited every 2 years) resulted in a similar
ICER (3,400€/QALY) [32].
Current guidelines for health economic evaluation and
modelling have not adequately addressed the issue of cohort definition [33]. Although the standard approach is
to use a single cohort, different authors have underlined
the advantages of a multi-cohort method to reproduce
real-world populations [7, 34]. Kuntz et al. [33] noted
that if no substantial heterogeneity is found on the basis
of characteristics of the screened women in the prevalent and incident cohorts, both approaches render similar results [33] and our results are in line with this
affirmation. Similarly, O’Mahony et al. [12] highlighted
how the ICER is influenced by the number of birth
cohorts under differential discounting [34]. As we have
used the same discounting, aggregating cohorts did not
produce differences.
All investment decisions involve an opportunity cost,
and therefore, a decision to spend on one option
deprives the beneficiaries of another option [8]. Thus,
investment in health care, curative and public health
requires evidence of effectiveness and cost-effectiveness
of competing interventions [35]. When we take into account both the 67.4 million euros invested in the screening programme during its first 15 years and the total
cost of roughly 1,000 million euros (36 million euros in
excess), it seems clear that an explicit statement is
needed regarding the best use of those resources. Actually, due to the increase in BC incidence and longer survival times achieved by early detection, an increase in
the prevalence of treated cancers occurred and thus,
overall costs increased considerably. In addition, treatment costs would have continued, even if the screening
programme had stopped in 2011. The complementary
budget impact analysis showed how the overall annual
costs varied in the first years of implementation and the
difference between scenarios stabilized after 2000 at
approximately five million euros. The small increase in
2007 is the result of the increased screening age of
70 years. The overall diagnosis and treatment cost of the
BC for the women included in the programme in the
Basque Country increased to 36.6 million euros in 2011.
The high attendance rate for the programme helped to
reduce disparities in BC survival [36, 37]. Screening rejection has been proposed on the supposition that new
cutting-edge treatments can offset the delay in diagnosis,
thus, making it unnecessary to treat at an earlier stage
[2]. This theory has not yet been confirmed, and, even if
established, such an approach would not guarantee that
innovative therapies would be available to all women
Arrospide et al. BMC Cancer (2016) 16:344
with BC. On the contrary, high attendance rates in
screening programmes means that the benefit now
reaches every female subject in the programme without
considering her socioeconomic level.
The retrospective nature of the design of this study
posed some doubts about how to deal with discounting
[8, 12, 17, 33]. Following the method of Stout et al, we
discounted only the future costs and benefits [17]. In
other words, the results (costs and QALYs) during the
evaluation period (1996 to 2011) were directly aggregated, because they had already occurred, but we did
discount the follow-up of women living after 2012 to
their death as future costs and included QALYs. Although the ICER calculated without any discount changed from 4,214 to 2,294€ per QALY, the difference was
not significant, because both figures were far below the
usual threshold (30,000€/QALY). Similarly, from both
single-cohort and multi-cohort models, we obtained
almost the same ICER (4,600 and 4,200€/QALY), which
underlines the efficiency of the programme.
The growing budget impact indicates that during these
years women included in the programme progressively
represented a larger portion of the treatment costs of
BC. The more years of follow-up included in the
programme, the closer the budget is to arriving at a plateau, as these figures include only screened women.
These figures highlight that after 15 years of screening
the difference between budgets in the two scenarios
(screened and unscreened population) could still vary in
the future.
Conclusions
Our economic results confirm the epidemiological benefits related to the centralised screening system and support, first, the continuation of the programme and,
second, the long follow-up required to fully evaluate the
benefit of the programme. In terms of cost-effectiveness
the ICER obtained in both population level evaluation
and single-cohort assessment were far below the threshold used for decision making. However, in order to make
the final decision it is necessary to take into account that
five million Euros more were required annually in average in the budget of the Basque Health Services due to
the implementation of the screening programme.
Additional file
Additional file 1: Model description. This file includes 465 the detailed
description of the simulation model built for 4667 this study. (PDF 429 kb)
Abbreviatons
BC, breast cancer; BCSPBC, breast cancer screening programme in the
Basque Country; CI, confidence interval; ICER, incremental cost-effectiveness
ratio; LYG, life years gained; MISCAN, microsimulation screening analysis;
QALY, quality adjusted life years.
Page 8 of 9
Acknowledgements
We would like to acknowledge the support from Ester Vilaprinyó in the
competing risks analysis and the natural history of breast cancer model.
We also want to thank Sally Ebeling for editorial assistance. Finally, we
thank the Basque Cancer Registries for providing breast cancer incidence
data and the Basque Mortality Registry for providing mortality data.
Funding
This study was funded by the grant 2010111007 from the Health
Department of the Basque Government.
Availability of data and materials
The dataset(s) supporting the conclusions or this article are included within
the article and the Additional file 1.
Authors’ contribution
Study concept and design: AA, JM, MR, MC, MS. Acquisition of data: MR,
GS, JM. Model construction and validation: AA, MR, NvR, MC. Statistical
analysis and interpretation of the results: AA, MS, MR, NvR. Drafting of the
manuscript: AA, JM. Critical revision of the manuscript: MR, NvR, MC, MS, GS.
All the authors have read and approved the final version of the manuscript.
Competing interests
The authors declare that they have no competing interests.
Consent for publication
Not applicable.
Ethics approval and consent to participate
Not applicable.
Author details
1
Gipuzkoa AP-OSI Research Unit, Integrated Health Organization Alto Deba,
Avda Navarra 16, 20500 Arrasate-Mondragón, Gipuzkoa, Spain. 2Aging and
Chronicity Health Services Research Group, BIODONOSTIA Research Institute,
Paseo Dr Beguiristain s/n, 20014 Donostia, Gipuzkoa, Spain. 3REDISSEC (Red
de Investigación en Servicios de Salud en Enfermedades Crónicas – Spanish
Health Services Research on Chronic Patients Network), Bilbao, Bizkaia, Spain.
4
Basic Medical Sciences department, Biomedical Research Institute of Lleida,
University of Lleida, Avda. Rovira Roure 80, 25198 Lleida, Spain. 5Department
of Public Health, Erasmus University Medical Center Rotterdam, Dr
Molewaterplein 50, 3015, GE, Rotterdam, The Netherlands. 6Evaluation and
Epidemiology Department, Hospital del Mar – IMIM (Hospital del Mar
Medical Research Institute), Passeig Maritim 25-29, 08003 Barcelona, Spain.
7
Breast Cancer Early Detection Programme, Public Health Division of Bizkaia,
Basque Government, Alameda Rekalde 39, 48008 Bilbao, Bizkaia, Spain.
8
Health Management Service, Integrated Health Organization Alto Deba,
Avda Navarra 16, 20500 Arrasate-Mondragón, Gipuzkoa, Spain.
Received: 17 September 2015 Accepted: 25 May 2016
References
1. Paci E. EUROSCREEN Working Group. Summary of the evidence of breast
cancer service screening outcomes in Europe and first estimate of the
benefit and harm balance sheet. J Med Screen. 2012;19 Suppl 1:5–13.
2. Biller-Andorno N, Jüni P. Abolishing mammography screening programmes?
A view from the Swiss Medical Board. N Engl J Med. 2014;370:1965–7.
3. Arrospide A, Rue M, van Ravesteyn NT, Comas M, Larrañaga N, Sarriugarte G,
Mar J. Evaluation of health benefits and harms of the breast cancer
screening programme in the Basque Country. BMC Cancer. 2015;15:671.
4. Russell LB, Gold MR, Siegel JE, Daniels N, Weinstein MC. The role of costeffectiveness analysis in health and medicine. JAMA. 1996;276:1172–7.
5. De Koning HJ. Breast cancer screening; cost-effective in practice? Eur J
Radiol. 2000;33:32–7.
6. Ethgen O, Standaert B. Population- versus cohort-based modelling
approaches. Pharmacoeconomics. 2012;30:171–81.
7. Hoyle M, Anderson R. Whose costs and benefits? Why economic
evaluations should simulate both prevalent and all future incident
patient cohorts. Med Decis Making. 2010;30:426–37.
Arrospide et al. BMC Cancer (2016) 16:344
8.
9.
10.
11.
12.
13.
14.
15.
16.
17.
18.
19.
20.
21.
22.
23.
24.
25.
26.
27.
28.
29.
30.
31.
Gold M, Siegel J, Russell L, editors. Cost-effectiveness in health and
medicine. New York: Oxford University Press; 1996.
Karnon J, Stahl J, Brennan A, Caro JJ, Mar J, Möller J. Modeling using
discrete event simulation: a report of the ISPOR-SMDM Modeling Good
Research Practices Task Force-4. Med Decis Making. 2012;32:701–11.
Stahl JE. Modelling methods for pharmacoeconomics and health.
Pharmacoeconomics. 2008;26:131–48.
Sullivan SD, Mauskopf JA, Augustovski F, Jaime Caro J, Lee KM, Minchin M,
Orlewska E, Penna P, Rodriguez Barrios JM, Shau WY. Budget impact
analysis-principles of good practice: report of the ISPOR 2012 Budget
Impact Analysis Good Practice II Task Force. Value Health. 2014;17:5–14.
O’Mahony JF, van Rosmalen J, Zauber AG, van Ballegoijen M. Multicohort
models in cost-effectiveness analysis: why aggregating estimates over
multiple cohorts can hide useful information. Med Decis Making. 2013;33:
407–14.
Lee S, Zelen M. A stochastic model for predicting the mortality of breast
cancer. J Natl Cancer Inst Monogr. 2006;36:79–86.
Rue M, Vilaprinyo E, Lee S, Martinez-Alonso M, Carles MD, Marcos-Gragera R,
Pla R, Espinas JA. Effectiveness of early detection on breast cancer mortality
reduction in Catalonia (Spain). BMC Cancer. 2009;9:326–35.
Vilaprinyo E, Rue M, Marcos-Gragera R, Martinez-Alonso M. Estimation of
age- and stage-specific Catalan breast cancer survival functions using US
and Catalan survival data. BMC Cancer. 2009;9:98–111.
Vilaprinyo E, Gispert R, Martínez-Alonso M, Carles M, Pla R, Espinàs JA,
Rué M. Competing risks to breast cancer mortality in Catalonia. BMC
Cancer. 2008;8:331–8.
Stout NK, Rosenberg MA, Trentham-Dietz A, Smith MA, Robinson SM,
Fryback DG. Retrospective cost-effectiveness analysis of screening
mammography. J Natl Cancer Inst. 2006;98:774–82.
Oliva-Moreno J, Lopez-Bastida J, Worbes-Cerezo M, Serrano-Aguilar P.
Health related quality of life of Canary Island citizens. BMC Public
Health. 2010;10:675.
Arrospide A, Soto-Gordoa M, Acaiturri T, Lopez-Vivanco G, Abecia LC, Mar J.
Coste del tratamiento del cancer de mama por estadío clínico en el País
Vasco. Rev Esp Salud Pública. 2015;89:1–5.
National Institute for Health and Care Excellence (NICE). Guide to the
methods of technology appraisal 2013. London. 2013. Available in:
Accessed 29 Dec 2014.
Briggs A, Schulpher M, Claxton K. Decision modelling for health economic
evaluation. New York: Oxford University Press; 2006.
Lopez-Bastida J, Oliva J, Antoñanzas F, García-Altés A, Gisbert R, Mar J,
Puig-Junoy J. Spanish recommendations on economic evaluation of
health technologies. Eur J Health Econ. 2010;11:513–20.
Mauskopf J, Earnshaw S, Mullins CD. Budget impact analysis: review of the
state of art. Expert Rew Pharmacoeconomics Outcomes Res. 2005;5:65–79.
Sacristan JA, Oliva J, del Llano J, Prieto L, Pinto JL. ¿Qué es una tecnología
sanitaria eficiente en España? Gac Sanit. 2002;4:334–43.
Asmussen S, Glynn PW. Stochastic Simulation: Algorithms and Analysis.
Series Stochastic Modelling and Applied Probability. New York: Springer
Edits; 2007. p. 57.
Del Turco MR, Ponti A, Bick U, Biganzoli L, Cserni G, Cutuli B, Decker T,
Dietel M, Gentilini O, et al. Quality indicators in breast cancer care. Eur J
Cancer. 2010;46:2344–56.
Canadian Partnership Against Cancer. Report from the Evaluation Indicators
Working Group: Guidelines for Monitoring Breast Cancer Screening
Programme Performance. 3rd ed. Toronto: Canadian Partnership Against
Cancer; 2013.
Carles M, Vilaprinyo E, Cots F, Gregori A, Pla R, Román R, Sala M, Macià F,
Castells X, Rue M. Cost-effectiveness of early detection of breast cancer in
Catalonia (Spain). BMC Cancer. 2011;11:192–203.
Habbema JD, van Oortmarssen GJ, Lubbe JT, van der Maas PJ. Model
building on the basis of Dutch cervical cancer screening data. Maturitas.
1985;7:11–20.
Van den Akker-van Marle ME, Reep-van den Bergh CM, Boer R, Del Moral A,
Ascunce N, de Koning HJ. Breast cancer screening in Navarra: interpretation
of a high detection rate at the first screening round and a low rate at the
second round. Int J Cancer. 1997;73:464–9.
Beemsterboer PMM, Warmerdam PG, Boer R, Borras JM, Moreno V, Viladiu P,
de Koning HJ. Screening for breast cancer in Catalonia. Which policy is to
be preferred? Eur J Public Health. 1998;8:241–6.
Page 9 of 9
32. De Koning HJ, van Ineveld BM, van Oortmarssen GJ, de Haes JCJM, Collette
HJA, Hendriks JHCL, van der Maas PJ. Breast cancer screening and costeffectiveness; policy alternatives, quality of life considerations and the
possible impact of uncertain factors. Int J Cancer. 1991;49:531–7.
33. Kuntz KM, Fenwick E, Briggs A. Appropriate cohorts for cost-effectiveness
analysis: to mix or not to mix? Med Decis Making. 2010;30:424–5.
34. Dewilde S, Anderson R. The cost-effectiveness of screening programmes
using single and multiple birth cohort simulations: a comparison using a
model of cervical cancer. Med Decis Making. 2004;24:486–92.
35. Maynard A. Public health and economics: a marriage of necessity. J Public
Health Res. 2012;1:11–3.
36. Baeten SA, Baltussen RM, Uyl-de Groot CA, Bridges JF, Niessen LW. Reducing
disparities in breast cancer survival–the effect of large-scale screening of the
uninsured. Breast J. 2011;17:548–9.
37. Pacelli B, Carretta E, Spadea T, Caranci N, Di Felice E, Stivanello E, et al. Does
breast cancer screening level health inequalities out? A population-based
study in an Italian region. Eur J Public Health. 2014;24:280–5.
Submit your next manuscript to BioMed Central
and we will help you at every step:
• We accept pre-submission inquiries
• Our selector tool helps you to find the most relevant journal
• We provide round the clock customer support
• Convenient online submission
• Thorough peer review
• Inclusion in PubMed and all major indexing services
• Maximum visibility for your research
Submit your manuscript at
www.biomedcentral.com/submit