Dehydroxymethylepoxyquinomicin, a novel nuclear factor-κB inhibitor, prevents the development of cyclosporine A nephrotoxicity in a rat model
Bạn đang xem bản rút gọn của tài liệu. Xem và tải ngay bản đầy đủ của tài liệu tại đây (9.52 MB, 12 trang )
Morita et al. BMC Pharmacology and Toxicology
/>
(2020) 21:60
RESEARCH ARTICLE
Open Access
Dehydroxymethylepoxyquinomicin, a novel
nuclear factor-κB inhibitor, prevents the
development of cyclosporine A
nephrotoxicity in a rat model
Shinya Morita1,2†, Kazunobu Shinoda1,3*† , Tadashi Yoshida2, Masayuki Shimoda4, Yoshihiko Kanno5,
Ryuichi Mizuno1, Hidaka Kono6, Hiroshi Asanuma1, Ken Nakagawa6, Kazuo Umezawa7 and Mototsugu Oya1,2
Abstract
Background: Cyclosporine A (CsA) is an essential immunosuppressant in organ transplantation. However, its
chronic nephrotoxicity is an obstacle to long allograft survival that has not been overcome. Nuclear factor-κB (NFκB) is activated in the renal tissue in CsA nephropathy. In this study, we aimed to investigate the effect of the
specific NF-κB inhibitor, dehydroxymethylepoxyquinomicin (DHMEQ), in a rat model of CsA nephrotoxicity.
Methods: We administered CsA (15 mg/kg) daily for 28 days to Sprague-Dawley rats that underwent 5/6
nephrectomy under a low-salt diet. We administered DHMEQ (8 mg/kg) simultaneously with CsA to the treatment
group, daily for 28 days and evaluated its effect on CsA nephrotoxicity.
Results: DHMEQ significantly inhibited NF-κB activation and nuclear translocation due to CsA treatment. Elevated
serum urea nitrogen and creatinine levels due to repeated CsA administration were significantly decreased by
DHMEQ treatment (serum urea nitrogen in CsA + DHMEQ vs CsA vs control, 69 ± 6.4 vs 113.5 ± 8.8 vs 43.1 ± 1.1 mg/
dL, respectively, p < 0.0001; serum creatinine in CsA + DHMEQ vs CsA vs control, 0.75 ± 0.02 vs 0.91 ± 0.02 vs 0.49 ±
0.02 mg/dL, respectively, p < 0.0001), and creatinine clearance was restored in the treatment group (CsA + DHMEQ
vs CsA vs control, 2.57 ± 0.09 vs 1.94 ± 0.12 vs 4.61 ± 0.18 ml/min/kg, respectively, p < 0.0001). However, DHMEQ
treatment did not alter the inhibitory effect of CsA on urinary protein secretion. The development of renal fibrosis
due to chronic CsA nephrotoxicity was significantly inhibited by DHMEQ treatment (CsA + DHMEQ vs CsA vs
control, 13.4 ± 7.1 vs 35.6 ± 18.4 vs 9.4 ± 5.4%, respectively, p < 0.0001), and these results reflected the results of renal
functional assessment. DHMEQ treatment also had an inhibitory effect on the increased expression of chemokines,
monocyte chemoattractant protein-1, and chemokine (c-c motif) ligand 5 due to repeated CsA administration,
which inhibited the infiltration of macrophages and neutrophils into the renal tissue.
Conclusions: These findings suggest that DHMEQ treatment in combination therapy with CsA-based
immunosuppression is beneficial to prevent the development of CsA-induced nephrotoxicity.
Keywords: Cyclosporine, Nephrotoxicity, NF-κB, NF-κB inhibitor
* Correspondence:
†
Shinya Morita and Kazunobu Shinoda contributed equally to this work.
1
Department of Urology, Keio University School of Medicine, Tokyo, Japan
3
Department of Nephrology, Toho University Faculty of Medicine, 7-5-23
Omorinishi Ota-ku, Tokyo 143-0015, Japan
Full list of author information is available at the end of the article
© The Author(s). 2020 Open Access This article is licensed under a Creative Commons Attribution 4.0 International License,
which permits use, sharing, adaptation, distribution and reproduction in any medium or format, as long as you give
appropriate credit to the original author(s) and the source, provide a link to the Creative Commons licence, and indicate if
changes were made. The images or other third party material in this article are included in the article's Creative Commons
licence, unless indicated otherwise in a credit line to the material. If material is not included in the article's Creative Commons
licence and your intended use is not permitted by statutory regulation or exceeds the permitted use, you will need to obtain
permission directly from the copyright holder. To view a copy of this licence, visit />The Creative Commons Public Domain Dedication waiver ( applies to the
data made available in this article, unless otherwise stated in a credit line to the data.
Morita et al. BMC Pharmacology and Toxicology
(2020) 21:60
Background
Although immunosuppression induced by calcineurin
inhibitors (CNIs) has remarkably improved short-term
graft survival in kidney transplantation, satisfactory
long-term graft survival has yet to be obtained [1].
Although several lines of evidence have demonstrated
that cyclosporine A (CsA), a CNI, elicits both acute
and chronic nephrotoxicity, these problems remain
unaddressed [2–5]. This unfavorable effect of CsA
treatment has also been observed in patients treated
with tacrolimus [6]. Multifactorial mechanisms underlie the histological damage due to CNI nephropathy
[7], and nephrotoxicity induced by CsA in particular
has been widely investigated.
Among the several molecular mechanisms directly affected by CsA, the activation of a key transcription factor, nuclear factor-κB (NF-κB), is critical. CsA is known
to inhibit the NF-κB signaling that promotes the production of interleukin 2 in T cells [8, 9]. However, in tubular
epithelial cells, CsA activates NF-κB and induces inflammation, eventually leading to tubulointerstitial fibrosis
[10–12]. Transcriptomic analysis showed that CNIs upregulate the NF-κB signaling and its target genes, including monocyte chemoattractant protein-1 (MCP-1),
Rantes, and interleukin 6 [13]. The authors found that
CNI induced NF-κB activation through four different
signaling pathways, the TLR4/Myd88/IRAK, JAK2/
STAT3, TAK1/JNK/AP-1 pathways and the unfolded
protein response, and investigated the effects of CNIs
on each pathway [13]. Thus, NF-κB signaling regulation is the key to preventing the development of CNI
nephropathy.
Our group has applied a newly designed inhibitor of
NF-κB activation, dehydroxymethylepoxyquinomicin
(DHMEQ), to several experimental models [14–17]. The
mechanism of DHMEQ has been extensively studied.
DHMEQ covalently binds to the specific cysteine residue
of NF-κB components to inhibit their DNA binding [18,
19] and nuclear translocation [20, 21]. Drug activity of
DHMEQ is highly NF-κB specific. DHMEQ has protective effects against renal ischemia reperfusion injury and
unilateral ureteral obstruction injury [14, 16]. We have
also shown that DHMEQ inhibits the activation of macrophages and the maturation of dendritic cells [15, 22].
Macrophage infiltration is one of the mechanisms by
which chronic CsA nephrotoxicity develops [23]. Thus,
DHMEQ is expected to act on both tubuloepithelial cells
and immune cells. In the present study, we aimed to investigate whether CsA nephrotoxicity is ameliorated by
DHMEQ treatment. We employed a rat CsA nephrotoxicity model, because DHMEQ is a preclinical drug and
because rodent models with repeated CsA administration under low-sodium conditions have been shown to
closely reproduce human CsA nephropathy [24].
Page 2 of 12
Methods
Animals
8–10-week-old male Sprague-Dawley rats were purchased from CLEA Japan, Inc. (Tokyo, Japan). All rats
were maintained under pathogen-free conditions in
filter-topped cages with an automatic water system
throughout the experiments. If rats underwent surgical
treatment, each rat was housed in a single cage for 24 h.
In other situations, 2–3 rats were housed in a single
cage. All rats were cared for according to the Guidelines
for Animal Experimentation of Keio University School
of Medicine and current laws in Japan (Act on Welfare
and Management of Animals). All animal experiments
were approved by the Animal Ethics Committee at Keio
University (approved number: 08061–7).
Chronic CsA nephrotoxicity model
Rats were fed a semisynthetic low-sodium diet (0.01%
sodium) during the course of the experiment. Lowsodium conditions have been shown to augment the severity of CsA nephropathy in a rodent model by activating the renin-angiotensin system [24–26]. To decrease
the number of nephrons, we performed 5/6 nephrectomy (right nephrectomy and segmental resection of the
upper and lower poles of the left kidney) under inhalation anesthesia with 3% sevoflurane one week after beginning the feeding of the low-sodium diet. The rats
were then treated with CsA (15 mg/kg) or 5% glucose by
intraperitoneal administration daily for 28 days (Fig. 1).
The dose of CsA was decided according to previous reports [24–26]. This dose is three-four times fold of that
utilized in human clinical kidney transplantation [27].
Drugs
CsA was obtained as a commercial product (Sandimmun, Novartis, Switzerland), dissolved in 5% glucose,
and administered via intraperitoneal injection to each
animal at a dose of 15 mg/kg.
DHMEQ was synthesized as previously described [28].
The purity was 95.3%, which was measured by HPLC by
Tecno Chem CO., LTD. (Tokyo, Japan). DHMEQ was
dissolved in DMSO to prepare a 10 mg/ml stock solution, diluted in olive oil, and administered via intraperitoneal injection to each animal at a dose of 8 mg/kg.
Experimental protocol
The experimental protocol is shown in Fig. 1. All rats
underwent 5/6 nephrectomy and were fed a lowsodium diet (0.01% sodium) as described above.
Eighteen rats were randomly assigned and divided
into three groups as follows: a control group treated
with 5% glucose for 28 days (n = 6), CsA group treated
with CsA (15 mg/kg daily) for 28 days (n = 6), and
Morita et al. BMC Pharmacology and Toxicology
(2020) 21:60
Page 3 of 12
Fig. 1 Schematic representation of the experimental design. Rats underwent 5/6 nephrectomy 7 days after the feeding with a low-sodium diet
(0.01% NaCl) began. In the CsA treatment group (15 mg/kg), CsA administration began on the day of surgery and continued daily for 28 days. If
the rats were cotreated with DHMEQ (8 mg/kg), DHMEQ administration began on the same day and continued daily for 28 days
CsA + DHMEQ group treated with CsA (15 mg/kg
daily) and DHMEQ (8 mg/kg daily) for 28 days (n = 6).
On day 28, we placed rats in metabolic cages for 24 h
and collected urine and blood sample to measure urine
volume, serum levels of urea nitrogen (UN) and creatinine (Cr), creatinine clearance (CCr), and urinary protein
extraction. Finally, we administered inhalation anesthesia
with 3% sevoflurane, removed kidney samples for further
evaluation, and euthanized the animals by cutting abdominal aorta.
Measurement of NF-κB (p65) DNA-binding activity
Renal cortical tissue was homogenized, and nuclear and
cytoplasmic extracts from the homogenized sample were
prepared using nuclear and cytoplasmic extraction reagents (NE-PER, Thermo Fisher Scientific, Waltham,
MA, USA). The DNA-binding activity of NF-κB (p65)
was measured using a nonradioactive NF-κB-specific
DNA-binding enzyme-linked immunosorbent assay
(ELISA) kit (TransAM NF-κB p65 transcription factor
assay kit, Active Motif, CA, USA), as previously described [16]. The results are shown as the relative ratio
of NF-κB (p65) DNA-binding activity in the nucleus divided by that in the cytoplasm (binding activity in the
nucleus / binding activity in the cytoplasm) (Fig. 2a).
Histological assessment
The kidney samples were cut into halves and prepared
for histological evaluation. One sample was fixed in 10%
formalin and embedded in paraffin, and the other was
embedded and frozen in OCT compound (Sakura Finetek USA Inc., Torrance, CA) before being stored at −
80 °C. The paraffin-embedded samples were sectioned
into 4 μm sections and stained with Masson’s trichrome
to evaluate the renal fibrosis area. The ratio of the renal
fibrosis area in each region was calculated as follows.
Ten areas of the cortex in each sample were randomly
selected by a pathologist and captured digitally by light
microscopy at 100× magnification. Image processing and
analysis were performed by using ImageJ (NIH). The fibrosis area, which was defined as the collagen fiber-rich
region, was stained blue, and the border of the fibrosis
area was manually demarcated with ImageJ by an evaluator (Fig. 4g). The demarcated area was automatically
quantitated, and the proportion of the fibrosis area in
each field was calculated. If an essential structure of the
kidney (e.g., glomeruli, tubules, peritubular capillaries, or
vessels) was stained blue and seemed to be morphologically normal, this area was excluded from the fibrosis
area. The pathologist and evaluator were blinded to information about the treatment of each sample.
Immunohistochemistry
The paraffinized sections (4 μm thickness) were also processed for staining for NF-κB (p65) (clone F-6, mouse
IgG1, Santa Cruz Biotechnology, CA, USA) and CD68
(clone ED1, mouse IgG1, Bio-Rad Laboratories, CA,
USA). Cryosections (4 μm thickness) were also prepared
using the frozen unfixed blocks described above. These
cryosections were processed for granulocyte staining
(clone HIS48, mouse IgM, Bio-Rad Antibodies, CA, USA).
The p65 staining protocol was as follows [29]. After
deparaffinization in xylene, sections were rehydrated by
incubation through a decreasing graded ethanol series
(100%, changed 3 times, 5 min each; 95%, changed twice,
5 min each; and 70%, changed once, 5 min) and distilled
water for 5 min. For antigen retrieval, the sections were
soaked in unmasking solution (Vector Laboratories, CA,
USA) and heated by microwave for 20 min. After endogenous peroxidase was blocked with 3% H2O2 for 10
min and nonspecific antibody (Ab) binding was blocked
with 5% horse serum for 1 h, the sections were incubated
Morita et al. BMC Pharmacology and Toxicology
(2020) 21:60
Page 4 of 12
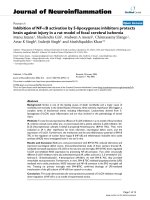
Fig. 2 Analyses of the effect of DHMEQ treatment on NF-κB activity in CsA nephropathy. a DNA-binding activity of NF-κB (p65) in nuclear and
cytoplasmic extracts, as determined by nonradioactive NF-κB-specific DNA-binding ELISA. The results are shown as the relative ratio of DNAbinding activity of NF-κB (p65) in the nucleus to that in the cytoplasm. b Representative immunohistochemical staining of p65 in the control. c
Representative immunohistochemical staining of p65 in the CsA group. d Representative immunohistochemical staining of p65 in the CsA +
DHMEQ group. All photos are magnified 100×. Arrows indicate nuclei positive for p65 staining. e The graph indicates the number of nuclei
positively stained for p65 in each group. The circular, rectangular, and triangular dots represent the data in the control, CsA, and CsA + DHMEQ
groups, respectively. The bars represent the mean values ± s.e.m.s.
with primary Ab (p65 F-6, 1:100 dilution) for 1 h at
room temperature. After washing with phosphatebuffered saline, the sections were incubated with secondary Ab (biotinylated anti-mouse IgG, Vector Laboratories, CA, USA). Then, staining was detected using a
Vectastatin ABC Kit (Vector Laboratories, CA, USA)
and DAB solution. Nuclei were then counterstained with
Mayer’s hematoxylin.
The CD68 staining protocol was as follows. The
deparaffinization and rehydration steps were performed
as described above. Antigen retrieval was performed
using proteinase K for 15 min at room temperature.
After endogenous peroxidase was blocked with 3% H2O2
for 10 min and nonspecific Ab binding was blocked with
6% skim milk for 15 min, the sections were incubated
with primary Ab (ED1, 1:100 dilution) overnight at 4 °C.
Morita et al. BMC Pharmacology and Toxicology
(2020) 21:60
After washing with phosphate-buffered saline, the sections were incubated with peroxidase-conjugated secondary Ab (Histofine Simple Stain Rat Max- PO,
Nichirei Co, Tokyo, Japan). Then, staining was detected
using a DAB solution.
The granulocyte staining protocol was as follows. Each
cryosection was dried and fixed in acetone for 10 min.
After nonspecific Ab binding was blocked with Protein
Block Serum-Free (DAKO, Agilent Pathology Solutions,
CA, USA) for 10 min, the sections were incubated with
primary Ab (HIS48, 1:20 dilution) for 1 h at room
temperature. After washing with 0.05 mol/L Tris-HCl
(pH 7.6) containing 0.15 mol/L NaCl, the endogenous
peroxidase reaction was blocked with 0.3% H2O2/methanol for 30 min. After washing, the sections were incubated with biotinylated secondary antibody for 15 min at
room temperature, and staining was detected using a
Universal LSAB2 Kit/HRP (DAKO, Agilent Pathology
Solutions, CA, USA) and DAB solution. Nuclei were
then counterstained with Mayer’s hematoxylin.
Ten areas of the cortex in each sample were randomly
selected by a pathologist and captured digitally by light
microscopy at 100× magnification. One evaluator manually counted positively stained cells in each field. The
pathologist and evaluator were blinded to information
about the treatment of each sample.
Real-time quantitative polymerase chain reaction (PCR)
The mRNA expression for MCP-1 and chemokine (c-c
motif) ligand 5 (CCL5) was evaluated. We isolated total
RNA from kidney samples by using RNAiso Plus kit
(TaKaRa Bio, Shiga, Japan) and transcribed the RNA
into cDNA. We performed real-time PCR by using a
TaqMan Gene Expression Assay specific for each gene
of interest and TaqMan Fast Universal PCR Master Mix
on a StepOnePlus Real-Time PCR System (Applied Biosystems). Primer and probe sets were as follows: MCP-1
(Rn00580555_m1), CCL5 (Rn00579590_m1), and
glyceraldehyde-3-phosphate dehydrogenase (GAPDH)
(Rn01775763_g1) as an endogenous control. Relative
quantification was performed by comparing the threshold cycle values of samples with those of serially diluted
standards. Each result was normalized to GAPDH. The
results are ratios (mean values ± s.e.m.s) of levels in the
CsA nephropathy and DHMEQ groups to those in the
control group, with average values in the control group
set as 1.0.
Statistical analysis
Data were collected and analyzed from all animals
(100%) in each group. Results are given as the mean ±
s.e.m. Variables among groups were compared using
analysis of variance (ANOVA), with p < 0.05 indicating a
significant difference. When the ANOVA test indicated
Page 5 of 12
significance, Tukey-Kramer’s test was used as a post hoc
test. Only significant p values are shown in each figure.
These analyses were performed with dedicated statistical
software (JMP v13.2.0, SAS Institute, Inc., Cary, NC,
USA), and statistical figures were prepared using GraphPad Prism v5.0 (GraphPad Software, San Diego, CA,
USA).
Results
DHMEQ treatment significantly inhibited the nuclear
translocation of p65 in rat kidney tissue
The major form of NF-κB is a heterodimer (p65/p50)
that is inactivated when bound to IκB in the cytoplasm;
this heterodimer is translocated to the nucleus after the
phosphorylation and degradation of IκB via activation
signals from the cell surface membrane [30]. DHMEQ
has been shown to inhibit nuclear translocation of the
activated NF-κB heterodimer (p65/p50) [17, 20]. Therefore, we investigated whether DHMEQ treatment inhibited the nuclear translocation of p65 in a CsA
nephropathy model. We did not observe any adverse
events (e.g. phenotypical or behavioral abnormalities) on
animals in each group due to drug administration.
We separated the nuclear and cytoplasmic proteins
from digested kidney samples and evaluated the activity
of NF-κB in the nuclear and cytoplasmic fractions by
ELISA. As suggested in several previous reports [11, 12],
NF-κB activation and the nuclear translocation of p65 in
the kidneys of rats treated with CsA were significantly
increased compared with those in the control rats (control vs CsA, 0.83 ± 0.11-fold vs 4.33 ± 0.84-fold increase,
relative ratio of p65 DNA-binding activity in the nucleus
to that in the cytoplasm, respectively, p = 0.0005, Fig.
2a). However, the nuclear translocation of p65 in the rat
kidney was significantly inhibited by cotreatment with
DHMEQ compared with CsA monotherapy (CsA +
DHMEQ vs CsA, 1.34 ± 0.23-fold vs 4.33 ± 0.84-fold increase, relative ratio of p65 DNA-binding activity in the
nucleus to that in the cytoplasm, respectively, p = 0.0022,
Fig. 2a). There was no significant difference of p65
DNA-binding activity between the control and the
CsA + DHMEQ group (control vs CsA + DHMEQ,
0.83 ± 0.11-fold vs 1.34 ± 0.23-fold, respectively, p =
0.7623, Fig. 2a).
We also evaluated the effect of NF-κB activation on
the histology by immunohistochemical staining. In accordance with the results obtained by ELISA, the nuclear
translocation of p65 was increased in rats treated with
CsA compared with control untreated rats (control vs
CsA, 9.5 ± 1.8 vs 56.7 ± 7.7 nuclear counts/field, respectively, p < 0.0001, Fig. 2b, c, e). The affected area was
mostly in the tubular epithelial cells (Fig. 2c). However,
DHMEQ treatment effectively inhibited the nuclear
translocation of p65 due to the administration of CsA
Morita et al. BMC Pharmacology and Toxicology
(2020) 21:60
(CsA + DHMEQ vs CsA, 18.3 ± 2.7 vs 56.7 ± 7.7 nuclear
counts/field, respectively, p = 0.0001, Fig. 2c, d, e). There
was no significant difference of the nuclear translocation
of p65 between the control and the CsA + DHMEQ
group (control vs CsA + DHMEQ, 9.5 ± 1.8 vs 18.3 ± 2.7,
respectively, p = 0.4198, Fig. 2b, d, e).
DHMEQ treatment ameliorated renal function
deterioration by CsA
The growth of the rats in each group that was assumed
from body weight increases from the baseline and to the
day of euthanasia was not statistically different in each
group (Δ weight in control vs CsA vs CsA + DHMEQ,
61.7 ± 38.9 vs 26.2 ± 41.9 vs 15.8 ± 21.8 g, p = 0.0931 by
ANOVA, supplementary Table 1). Repeated administration of CsA (15 mg/kg/day for 28 days) and low-sodium
conditions caused the deterioration of renal function in
a 5/6 nephrectomized rat model. Serum UN levels in the
CsA nephropathy group were significantly increased
compared with those in the control group (control vs
CsA, 43.1 ± 1.1 vs 113.5 ± 8.8 mg/dL, respectively, p <
0.0001, Fig. 3a). The serum Cr level was also increased
in the CsA nephropathy group compared with the control group (control vs CsA, 0.49 ± 0.02 vs 0.91 ± 0.02 mg/
dL, respectively, p < 0.0001, Fig. 3b). We calculated the
CCr and normalized the results by body weight (kg).
Normalized CCr in the CsA nephropathy group was decreased compared with the control group (control vs
CsA, 4.61 ± 0.18 vs 1.94 ± 0.12 ml/min/kg, respectively,
p < 0.0001, Fig. 3c).
Page 6 of 12
However, DHMEQ treatment significantly ameliorated renal function deterioration caused by repeated
CsA administration. Serum UN levels in the CsA +
DHMEQ group were significantly decreased compared
with those in the CsA group (CsA + DHMEQ vs CsA,
69 ± 6.4 vs 113.5 ± 8.8 mg/dL, respectively, p = 0.0004,
Fig. 3a). The serum Cr level in the CsA + DHMEQ
group was also significantly decreased compared with
that in the CsA group (CsA + DHMEQ vs CsA,
0.75 ± 0.02 vs 0.91 ± 0.02 mg/dL, respectively, p =
0.0003, Fig. 3b). In addition, CCr was significantly increased in the CsA + DHMEQ group compared with
the CsA group (CsA + DHMEQ vs CsA, 2.57 ± 0.09 vs
1.94 ± 0.12 ml/min/kg, respectively, p = 0.013, Fig. 3c).
However, DHMEQ treatment did not completely restore renal function to the control level (serum UN,
Cr, and CCr in control vs CsA + DHMEQ; 43.1 ± 1.1
vs 69 ± 6.4 mg/dL, p = 0.0275; 0.49 ± 0.02 vs 0.75 ±
0.02 mg/dL, p < 0.0001; 4.61 ± 0.18 vs 2.57 ± 0.09 ml/
min/kg, p < 0.0001; respectively, Fig. 3A, B, and C).
In contrast, the urine volume in each group was not
significantly different (control vs CsA vs CsA + DHMEQ,
28.3 ± 1.5 vs 30.6 ± 3.6 vs 27.6 ± 3.1 ml, Fig. 3d). Interestingly, urinary protein extraction was significantly decreased in the CsA nephropathy group compared with
the control group (control vs CsA, 17.7 ± 2.6 vs 10.6 ±
1.8 mg/24 h, respectively, p = 0.0328, Fig. 3e). DHMEQ
treatment did not offset the inhibitory effect of urinary
protein extraction due to CsA (CsA + DHMEQ vs CsA,
9.7 ± 1.0 vs 10.6 ± 1.8 mg/24 h, p = 0.9255; control vs
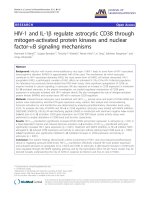
Fig. 3 Analyses of renal function. Comparison of the serum UN level (a), serum creatinine level (b), creatinine clearance (c), urine volume (d), and
urinary protein extraction (e) in each group. The circular, rectangular, and triangular dots represent the data in the control, CsA, and CsA + DHME
Q groups, respectively. The bars represent the mean values ± s.e.m.s.
Morita et al. BMC Pharmacology and Toxicology
(2020) 21:60
CsA + DHMEQ, 17.7 ± 2.6 vs 9.7 ± 1.0 mg/24 h, p =
0.0237; respectively, Fig. 3e).
DHMEQ treatment significantly inhibited the
development of renal fibrosis due to CsA
Next, we investigated whether the deterioration of renal
function was associated with renal tissue fibrosis among
the three groups. Surgical treatment with 5/6 nephrectomy (control), which was intended to reduce the number of nephrons, did not affect renal fibrosis formation
(Fig. 4a, b). In contrast, renal fibrosis developed in the
kidneys of rats treated with CsA (Fig. 4c, d). Typical
Page 7 of 12
striped renal fibrosis from the corticomedullary boundary to the surface of the cortex was observed (Fig. 4c).
The renal fibrosis area was significantly increased in the
CsA group compared with the control group (control vs
CsA, 9.4 ± 5.4 vs 35.6 ± 18.4%, respectively, p < 0.0001,
Fig. 4h). However, renal fibrosis formation was remarkably inhibited by DHMEQ treatment (Fig. 4e, f). The
renal fibrosis area was significantly decreased in the
CsA + DHMEQ group compared with the CsA group
(CsA + DHMEQ vs CsA, 13.4 ± 7.1 vs 35.6 ± 18.4%, respectively, p < 0.0001, Fig. 4h). There was no significant
difference in the renal fibrosis area between the control
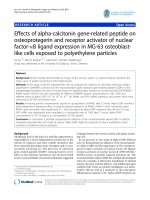
Fig. 4 Evaluation of the renal fibrosis area. a, c, and e show representative Masson’s trichrome staining in the control, CsA, and CsA + DHMEQ
groups, respectively. a, c, and e are magnified 20×. The areas highlighted in the small boxes in the left panels (a, c, e) are shown in the right
panels (b, d, f) at a magnification of 100×. g We demarcated the border (red line in the photo) of the blue stained area in the interstitium and
excluded essential kidney structures (e.g., the glomeruli, tubules, peritubular capillaries, or vessels). The border was drawn manually with ImageJ
software. h The graph indicates the percentage of the fibrosis area in each group. The circular, rectangular, and triangular dots represent the data
in the control, CsA, and CsA + DHMEQ groups, respectively. The bars represent the mean values ± s.e.m.s.
Morita et al. BMC Pharmacology and Toxicology
(2020) 21:60
and CsA + DHMEQ (control vs CsA + DHMEQ, 9.4 ±
5.4 vs13.4 ± 7.1%, respectively, p = 0.157, Fig. 4h).
DHMEQ treatment significantly inhibited inflammatory
cell infiltration
We further evaluated inflammatory cell infiltration in
the kidneys of rats in the three groups. First, we evaluated the transcription of chemokines, MCP-1 and CCL5
in each group. MCP-1 mRNA expression levels in the
CsA group were higher than those in the control group
(control vs CsA, 1.00 ± 0.13 vs 1.82 ± 0.35, Fig. 5a). However, MCP-1 mRNA expression levels in the CsA +
DHMEQ group were lower than those in the CsA group,
although this difference was not statistically significant (CsA + DHMEQ vs CsA, 1.14 ± 0.24 vs 1.82 ±
0.35, Fig. 5a). The same tendency was observed for
CCL5 (control vs CsA vs CsA + DHMEQ, 1.00 ± 0.10
vs 1.98 ± 0.42 vs 1.28 ± 0.17, Fig. 5b).
Next, we investigated whether these changes in chemokine expression were associated with inflammatory
cell infiltration in the renal tissue. Macrophage (ED1positive cells) infiltration in the CsA group was significantly increased compared with that in the control
group (control vs CsA, 1.1 ± 0.26 vs 25.1 ± 1.65 positive
cells/field, respectively, p < 0.0001, Fig. 6a, b, d). However, macrophage infiltration in the CsA + DHMEQ
group was significantly decreased compared with that in
the CsA group (CsA + DHMEQ vs CsA, 4.2 ± 0.48 vs
25.1 ± 1.65 positive cells/field, respectively, p < 0.0001,
Fig. 6b, c, d), and there was no significant difference of
macrophage infiltration between the control and CsA +
DHMEQ (control vs CsA + DHMEQ, 1.1 ± 0.26 vs 4.2 ±
0.48 positive cells/field, respectively, p = 0.0751, Fig. 6a,
c, d). These findings were in accordance with the
changes in MCP-1 expression.
We subsequently evaluated granulocyte infiltration in
the renal tissue. Granulocyte (HIS48 positive cells)
Page 8 of 12
infiltration in the CsA group was significantly increased
compared with that in the control group (control vs
CsA, 6.3 ± 0.68 vs 41.8 ± 4.1 positive cells/field, respectively, p < 0.0001, Fig. 6e, f, h). In contrast, granulocyte
infiltration was significantly decreased in the CsA +
DHMEQ group compared with the CsA group (CsA +
DHMEQ vs CsA, 18.4 ± 1.01 vs 41.8 ± 4.1 positive cells/
field, respectively, p < 0.0001, Fig. 6f, g, h), although
DHMEQ treatment did not completely inhibit granulocyte infiltration to the control level (control vs CsA +
DHMEQ, 6.3 ± 0.68 vs 18.4 ± 1.01 positive cells/field, respectively, p = 0.0025, Fig. 6e, g, h).
Discussion
In this study, we showed that DHMEQ treatment significantly ameliorated the deterioration of renal function
and renal fibrosis due to CsA nephrotoxicity. The inhibition of macrophage and granulocyte infiltration by
DHMEQ probably contributed to the protection of the
kidney against histopathological and functional damages
due to the administration of CsA.
The NF-κB transcriptional signaling was activated in
the renal tissue over the course of CsA-induced renal
damage, as several previous studies have suggested [11–
13]. The immunohistochemical results in the present
study revealed that the activated p65 translocated to the
nuclei in mainly tubular epithelial cells. Renal histological injury is likely to be caused by the indirect effects
of CsA; typical finding is prolonged arteriolar vasoconstriction, leading to local hypoxia, ischemia, and the production of free radicals or reactive oxygen species (ROS)
[31–33]. More recently, direct cellular damage due to
CsA has been demonstrated. In vitro studies revealed
that CsA directly affects tubular epithelial cells, leading
to the secretion of ROS, transforming growth factor-β,
and procollagen and the activation of apoptotic genes
[34–39]. Several studies have suggested that the NF-κB
Fig. 5 Real-time PCR assessment of chemokines in renal tissue. The graphs indicate the mRNA expression of MCP-1 (a) and CCL-5 (b). Each result
was normalized to GAPDH as an endogeneous control. The results are ratios (mean values ± s.e.m.s) of levels in the CsA nephropathy and DHME
Q groups to those in the control group, with average values in the control group set as 1.0. The circular, rectangular, and triangular dots
represent the data in the control, CsA, and CsA + DHMEQ groups, respectively. The bars represent the mean values ± s.e.m.s.