Pharmacokinetic and metabolomic analyses of Mangiferin calcium salt in rat models of type 2 diabetes and non-alcoholic fatty liver disease
Bạn đang xem bản rút gọn của tài liệu. Xem và tải ngay bản đầy đủ của tài liệu tại đây (5.89 MB, 12 trang )
Lin et al. BMC Pharmacology and Toxicology
/>
(2020) 21:59
RESEARCH ARTICLE
Open Access
Pharmacokinetic and metabolomic analyses
of Mangiferin calcium salt in rat models of
type 2 diabetes and non-alcoholic fatty
liver disease
He Lin1*, Houlei Teng2, Wei Wu2, Yong Li1, Guangfu Lv1, Xiaowei Huang1, Wenhao Yan1 and Zhe Lin1*
Abstract
Background: Non-alcoholic fatty liver is one of the most common comorbidities of diabetes. It can cause
disturbance of glucose and lipid metabolism in the body, gradually develop into liver fibrosis, and even cause liver
cirrhosis. Mangiferin has a variety of pharmacological activities, especially for the improvement of glycolipid
metabolism and liver injury. However, its poor oral absorption and low bioavailability limit its further clinical
development and application. The modification of mangiferin derivatives is the current research hotspot to solve
this problem.
Methods: The plasma pharmacokinetic of mangiferin calcium salt (MCS) and mangiferin were monitored by HPLC.
The urine metabolomics of MCS were conducted by UPLC-Q-TOF-MS.
Results: The pharmacokinetic parameters of MCS have been varied, and the oral absorption effect of MCS was
better than mangiferin. Also MCS had a good therapeutic effect on type 2 diabetes and NAFLD rats by regulating
glucose and lipid metabolism. Sixteen potential biomarkers had been identified based on metabolomics which
were related to the corresponding pathways including Pantothenate and CoA biosynthesis, fatty acid biosynthesis,
citric acid cycle, arginine biosynthesis, tryptophan metabolism, etc.
Conclusions: The present study validated the favorable pharmacokinetic profiles of MCS and the biochemical
mechanisms of MCS in treating type 2 diabetes and NAFLD.
Keywords: Mangiferin calcium salt, Diabetes, NAFLD, Pharmacokinetics, Metabolomics, Bioavailability
Background
Diabetes is one of the most common chronic metabolic
diseases, and its incidence is gradually increasing. According to the International Diabetes Federation, the
463 million people with diabetes worldwide account for
about 9.3% of the global population in 2019, of which
80% come from low- and middle-income countries. It is
* Correspondence: ;
1
College of Pharmacy, Changchun University of Chinese Medicine,
Changchun, China
Full list of author information is available at the end of the article
estimated that 700 million people will account for 10.9%
of the world population by 2045 [1]. Non-alcoholic fatty
liver (NAFLD) is a metabolic stress liver injury, including non-alcoholic simple fatty liver, non-alcoholic steatohepatitis and related cirrhosis [2, 3]. NAFLD is currently
the most common liver disease in the world and the
common comorbidities of diabetes. It accounts for about
75% of patients with type 2 diabetes [4, 5]. It can cause
further disorders of glucose and lipid metabolism, and
gradually progress to liver fibrosis, and even cause Cirrhosis [6]. The coexistence of two diseases could affect
© The Author(s). 2020 Open Access This article is licensed under a Creative Commons Attribution 4.0 International License,
which permits use, sharing, adaptation, distribution and reproduction in any medium or format, as long as you give
appropriate credit to the original author(s) and the source, provide a link to the Creative Commons licence, and indicate if
changes were made. The images or other third party material in this article are included in the article's Creative Commons
licence, unless indicated otherwise in a credit line to the material. If material is not included in the article's Creative Commons
licence and your intended use is not permitted by statutory regulation or exceeds the permitted use, you will need to obtain
permission directly from the copyright holder. To view a copy of this licence, visit />The Creative Commons Public Domain Dedication waiver ( applies to the
data made available in this article, unless otherwise stated in a credit line to the data.
Lin et al. BMC Pharmacology and Toxicology
(2020) 21:59
the health of patients seriously [7]. Insulin resistance
(IR) is currently recognized as one of the main risk factors for non-alcoholic fatty liver. It refers to the reduced
sensitivity of the body to insulin, the inability to effectively synthesize and metabolize glucose. Then excessive
insulin is compensatively secreted into the blood, causing hyperinsulinemia [8, 9]. Meanwhile IR prevents insulin from efficiently inhibiting lipase activity. The increase
of lipase activity will cause a large amount of adipose tissue to be broken down, and excess free fatty acids will
enter the liver through the hepatic portal vein, causing
fatty liver [10, 11]. IR can also trigger oxidative stress, inflammation that promotes the deterioration of NAFLD,
causing inflammation infiltration, necrosis, and even fibrosis in the liver [12, 13].
Mangiferin (2-beta-D-glucopyranosyl-1,3,6,7-tetrahydroxyxanthone, MGN) is a natural C-glucoside xanthone, which is predominantly in the fruits, leaves, and
bark of Mangifera indica L. and some other medical
plants including Anemarrhena asphodeloides Bge.,
Belamcanda chinensis (L.) DC etc. [14, 15]. It has shown
many kinds of biological activities and pharmacological
actions such as antioxidative, antidiabetic, hypolipidemic,
antiviral, immunomodulatory, anticancer, analgesic and
hepatoprotective effects [16–20]. But the characteristic
of its low aqueous solubility and low fat solubility can
affect the absorption process of drugs in vivo, which
leads to a low bioavailability [21, 22]. It makes us have
to suffer such problems like mangiferin is hard to further develop a new medicine and its clinical application
has certain limitation.
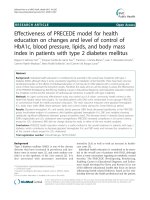
Mangiferin calcium salt (MCS) is a new salt of mangiferin which proposed to be an insulin sensitizer (Fig. 1)
[23, 24]. In the present study, the pharmacokinetic profiles of MCS in rats were evaluated to clarify the impact
of single and repeated administration on its main pharmacokinetic parameters. A comparison between the
major pharmacokinetic between MCS and mangiferin
Fig. 1 Chemical structure of mangiferin calcium salt
Page 2 of 12
was subsequently executed. Metabolomics was performed with rats urine samples collected from oral administration of MCS. As our knowledge, this is the first
integrated study of pharmacokinetics and metabolomics
on MCS. The results of this assessment will contribute
to further development of MCS as pharmaceutical products and explore the underlying mechanism of MCS in
the treatment of type 2 diabetes and NAFLD.
Methods
Chemicals and materials
Mangiferin calcium salt (MCS, yellow green powder,
purity: 95.25%), Mangiferin (yellowish powder, purity:
98%) was provided by Changzhou Deze Pharmaceutical
Research Co. Ltd. (Changzhou, China). Mangiferin (purity: 98.1%), rutin (purity: 91.9%) as reference substance
were obtained from the National Institute for the Control of Pharmaceutical and Biological Products (Beijing,
China). Heparin sodium was obtained from Shanghai
Huishi biochemical reagent Co., Ltd. (Shanghai, China).
Acetonitrile Methanol and formic acid (HPLC grade)
were obtained from Tedia Company, Inc. (Ohio, USA).
Ultrapure water was produced using a Milli-Q plus (Milford, MA, USA) water purification system. Leucine
enkephalin was obtained from Waters (Milford, USA).
Xanthurenic acid, 5-L-Glutamyl-taurine, Citric acid,
Pantothenic acid, Uric acid, Riboflavin and 3Hydroxyanthranilic acid were obtained from SigmaAldrich (St. Louis, MO, USA).
Animals
Sprague-Dawley rats (male and female, weighting 200230 g) were obtained from Changchun Yisi Laboratory
Animal Technology Co., Ltd. (Changchun, China). Rats
were housed with free access to food and water under
standard conditions (temperature 20–24 °C, humidity
40–60%, 12-h light/dark cycle). All experimental animals
were finally euthanized by CO2 inhalation. The study
Lin et al. BMC Pharmacology and Toxicology
(2020) 21:59
complied with the guidelines of the research commitment institution and its administrative region, as the
Jilin Province Experimental Animal Management Ordinance and Changchun University of Chinese Medicine
Laboratory Animal Management Measures. All experiments were approved by the Laboratory Animals Ethics
Committee, Changchun University of Chinese Medicine.
Administration and plasma samples collection
MCS and mangiferin were given by gavages according to
60 mg/kg, 240 mg/kg, 960 mg/kg doses as single administration. Rats were fasted 12 h before the experiment and
water was taken freely. In the experiment day the administration was according to the predetermined dose. Serial
blood samples were collected from the orbital venous
plexus (0.3–0.5 mL) at 0 h, 0.5 h, 1.0 h, 1.5 h, 2.0 h, 3.0 h,
4.0 h, 6.0 h, 10.0 h, 12.0 h, 24.0 h after administration.
MCS and mangiferin were given by gavages according
to 240 mg/kg dose, once a day for 7 days as multiple administrations. Blood samples were collected from the orbital venous plexus (0.3–0.5 mL) on 1, 2, 3, 4, 5, 6 days
before dosing. For the last administration, Serial blood
samples were collected at 0 h, 0.5 h, 1.0 h, 1.5 h, 2.0 h,
3.0 h, 4.0 h, 6.0 h, 10.0 h, 12.0 h, 24.0 h.
The blood samples placed in a centrifuge tube with
heparin, 10,000 rpm centrifuge 10 min. After the centrifugation, reserve the plasma in − 20 °C refrigerator.
Pharmacokinetic analysis
The 200 μL of plasma sample was placed in a 1.5 mL
centrifuge tube, added internal standard solution (10 μg/
mL rutin standard solution) 25 μL, (0 h plasma used
methanol 25 μL to instead), methanol 25 μL (added
mangiferin standard solution 25 μL), added 0.9 mL
Acetonitrile-acetic acid (9: 1), swirl mixed 3 min, 6000
rpm centrifuged 10 min, supernatant was dried in vacuum at 50 °C, added mobile phase 100 μL to the residue,
swirl mixed 2 min, 6000 rpm centrifuged 10 min, the
supernatant was injected into High performance liquid
chromatography (HPLC). Chromatographic separations
were achieved using a Discovery C18 column (250*4.60
mm I.D, 5 μm, Supelco Company, USA). The mobile
phase used for the separation consisted of Acetonitrile
and 0.10% phosphoric acid (25:75, v/v) delivered at 1 ml/
min flow rate. The detection wavelength was set at 318
nm and all measurements were performed at 30 °C.
The pharmacokinetic parameters were calculated using
DAS software, and select the weighting factors to fit the
atrioventricular model.
Type 2 diabetes and NAFLD model construction and
administration
The SD rats were fed high-fat feed (recipe: 12% lard,
0.5% cholate, 1% cholesterol, 5% sucrose, 81.5% basic
Page 3 of 12
nutritional feed). At the end of the 12th week, streptozotocin (STZ) (30 mg/kg) was intraperitoneally injected into
rats to induce type 2 diabetes complicated with NAFLD
model. The rats were randomly divided into the following
four groups: Blank control group (BG, n = 7), model control group (MG, n = 7) were administered with distilled
water intragastrically. MCS High-dose group (MHG, n =
7), Medium dose group (MMG, n = 7), Low-dose group
(MLG, n = 7) were administered intragastrically with MCS
at doses of 480 mg/kg, 240 mg/kg, 120 mg/kg.
Pharmacodynamics
Blood was collected and centrifuged at 4500 rpm low
temperature centrifuge for 15 min to separate serum.
Detect the fasting blood glucose (FBG), fasting insulin
(FINS), triglyceride (TG), total cholesterol (TC), aspartate aminotransferase (AST), alanine aminotransferase
(ALT) and gamma-glutamyl transpeptadase (GGT) content in rat serum. The rat liver was taken stained with
hematoxylin and eosin (H&E).
Metabolomics analysis
Urine samples were collected and centrifuged at 10,000
rpm for 10 min, filtered through a 0.22 μm filter membrane. Supernatant was transferred to fresh vials for ultraperformance liquid chromatography coupled with quadrupole time-of-flight mass spectrometry (UPLC-Q-TOFMS) analysis. For metabolomics analysis, the samples
(each 5 μL) were injected onto a Waters ACQUITY UPLC
BEH C18 Column (1.7 m, 2.1 mm × 50 mm) kept at 30 °C
and at a flow rate of 0.4 mL/min using a Waters
ACQUITY UPLC system coupled with a Q-TOF SYNA
PT G2 High Definition Mass Spectrometer (Waters,
USA). Acetonitrile (A) and 0.1% aqueous formic acid (v/v)
(B) were used as gradient mobile phase. The gradient elution of A was performed as follows: 5–30% A at 0–6 min,
30–60% A at 6–10 min, 60–100% A at 10–12 min, 100–
5% A at 12–12.1 min and then kept at 5% A for 3 min.
The positive and negative ion (ESI) modes were used in
MS analysis. The source temperature was set to 120 °C.
The desolvation gas temperature was set to 400 °C and the
flow was set to 800 L/h. The capillary, cone and extraction
cone voltages were 3.0 kV, 35 V, 5.0 V in positive ion
mode and 2.0 kV, 35 V, 5.0 V in negative ion mode. The
full-scan mode was from 100 to 1000 Da. Accurate mass
was maintained by Leucine enkephalin. MSE was applied
for the MS/MS analysis with the high collision energy on
25-35 eV and the low collision energy on 4 eV.
The quality control (QC) samples were used for
method validation, which were obtained by mixing
100 μL of each sample. In order to avoid errors during
the entire analysis process, the QC samples were run
once every 5 samples to measure the stability of the
system.
Lin et al. BMC Pharmacology and Toxicology
(2020) 21:59
Data processing and statistical analysis
The sample was detected by UPLC-Q-TOF-MS to obtain the total ion current chromatogram of the sample.
The raw data files were processed with MassLynx V4.1
and MarkerLynx Application Manager (Waters, USA)
for peak detection, alignment and normalization. Multivariate analysis was performed by principal component
analysis (PCA) and orthogonal projection to latent structures squares-discriminant analysis (OPLS-DA) with the
EZinfo 2.0 software. All values are expressed as the
mean ± SD. An independent sample t-test between
groups was used to evaluate the significant difference
(p < 0.05)using SPSS statistics 13.0 software.
Results
Comparison of pharmacokinetic parameters after single
administration of MCS and mangiferin
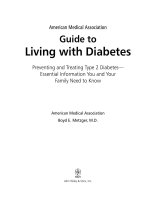
The mean plasma concentration-time curves of MCS
and mangiferin in different dosage are showed in Fig. 2.
The main pharmacokinetic parameters are summarized
in Table 1. As be seen in Table 1, after a single
Page 4 of 12
administration of 240 mg/kg, compared with AUC(0-t)
(9187.50 μg/L•h), AUC(0-∞) (9723.18 μg/L•h), Tmax
(4.02 h), Cmax (1.18 μg/ml) of mangiferin, AUC(0-t) (28,
126.50 μg/L•h), AUC(0-∞) (30,981.65 μg/L•h), Cmax
(3.42 μg/ml) of MCS are significantly increased (P <
0.05), Tmax (2.99 h) is significantly decreased (P < 0.05).
MCS has better oral absorption than mangiferin.
Comparison of pharmacokinetic parameters after multiple
administration of MCS and mangiferin
The comparison of mean plasma concentration-time
curves of MCS and mangiferin after multiple oral administration in dosage of 240 mg/kg are showed in Fig. 3.
The main pharmacokinetic parameters are summarized
in Table 2. As be seen in Table 2, after a multiple administration of 240 mg/kg, compared with AUC(0-t)
(9075.00 μg/L•h), AUC(0-∞) (9729.04 μg/L•h), Tmax
(4.05 h), Cmax (1.16 μg/ml) of mangiferin, AUC(0-t) (27,
871.50 μg/L•h), AUC(0-∞) (30,789.50 μg/L•h), Cmax
(3.42 μg/ml) of MCS are significantly increased (P <
0.05), Tmax (3.02 h) is significantly decreased (P < 0.05).
In addition, the main pharmacokinetic parameters of
multiple and single administration of MCS have no significant difference, indicating that the absorption of
MCS in rats is constant basically, and don’t change with
continuous administration. MCS almost has no accumulation in the body after multiple doses of administration.
Pharmacodynamics study
Fig. 2 The mean plasma concentration-time curves of MCS and
mangiferin in different dosage. a MCS, b mangiferin
Type 2 diabetes patients with NAFLD often suffered
from glucose and lipid metabolism disorder, and present
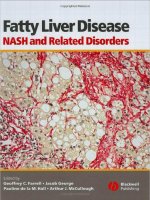
with abnormally high fasting blood glucose, fasting insulin and HOMA-IR [25]. As our previous study (Fig. 4)
[26], the serum FBG and FINS content of MG were
higher than BG significantly (P < 0.01). Compared with
MG, the level of serum FBG, FINS in MHG and MMG
decreased significantly after treated with MCS (P < 0.05).
It revealed that MCS could better improve insulin resistance. Dyslipidemia is also one of the important clinical
manifestations of type 2 diabetes patients with NAFLD.
Compared with BG, significant increase could be observed in serum TG, TC level in MG (p < 0.01). After
the treatment with MCS, the concretion of serum TG,
TC in MHG and MMG decreased significantly (p <
0.05). It revealed that MCS could reduce the blood lipid
in model rats. ALT, AST, GGT are the most significant
diagnostic indicator for patients with NAFLD. Compared
with BG, serum ALT and GGT activities of MG increased significantly (p < 0.01). After the treatment with
MCS, the activities of serum ALT and GGT in MHG
and MMG decreased significantly (p < 0.01, p < 0.05). It
revealed that MCS could improve abnormal liver function in model rats.
Lin et al. BMC Pharmacology and Toxicology
(2020) 21:59
Page 5 of 12
Table 1 Pharmacokinetic parameters after single administration of Mangiferin calcium salt (MCS) and mangiferin in rats (n = 6)
Parameters
Mangiferin calcium salt (MCS) (Mean ± SD)
Mangiferin (Mean ± SD)
60 mg/kg
240 mg/kg
960 mg/kg
60 mg/kg
240 mg/kg
960 mg/kg
AUC(0-t)(μg/L·h)
6988.35 ± 1537.44
28,126.50 ± 6750.48*
111,771.00 ± 32,413.59
2200.00 ± 462.89
9187.50 ± 2021.15
37,077.50 ± 11,494.23
AUC(0-∞)(μg/L·h)
7714.49 ± 2005.77
30,981.65 ± 8674.40*
123,314.62 ± 38,227.53
2366.16 ± 567.88
9723.18 ± 2430.80
39,101.95 ± 12,121.60
MRT(0-t)(h)
7.28 ± 1.67
7.27 ± 0.96
7.28 ± 0.98
6.90 ± 1.45
6.89 ± 1.58
6.94 ± 1.87
MRT(0-∞)(h)
9.73 ± 0.98
9.65 ± 0.77
9.71 ± 1.94
8.69 ± 2.17
8.25 ± 2.47
8.21 ± 1.89
T1/2(kα)(h)
1.59 ± 0.13
1.60 ± 0.19
1.57 ± 0.20
1.66 ± 0.22
1.70 ± 0.19
1.72 ± 0.24
T1/2(ke)(h)
3.27 ± 0.52
3.34 ± 0.47
3.36 ± 0.47
3.15 ± 0.41
3.29 ± 0.46
3.30 ± 0.46
Tmax(h)
3.11 ± 0.25
2.99 ± 0.21*
3.06 ± 0.12
4.11 ± 0.33
4.02 ± 0.28
3.97 ± 0.36
Cmax(μg/ml)
0.86 ± 0.21
3.42 ± 0.65*
13.73 ± 3.57
0.28 ± 0.04
1.18 ± 0.28
4.73 ± 1.37
V/F(c) (L/kg)
43.50 ± 8.27
45.11 ± 13.98*
45.54 ± 14.12
134.17 ± 41.59
142.41 ± 41.30
133.34 ± 34.67
CL/F(S)(L/kg·h)
9.23 ± 1.57
9.36 ± 2.53*
9.40 ± 2.54
29.55 ± 7.68
30.05 ± 8.71
28.00 ± 7.12
Compared with mangiferin dosage of 240 mg/kg group, *p < 0.05
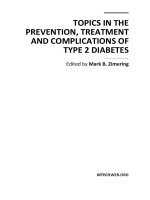
Histological analysis showed that livers of the MG rats
had lobular structures with blurred boundaries, Irregular
cell cords, and hepatic sinusoidal compression became
smaller or disappears, liver cells showed diffuse fat-like
changes, a large number of inflammatory cells infiltration could be seen in the liver lobule, even several inflammatory necrosis merged with each other (Fig. 5).
Metabolomics study
The system of UPLC-Q-TOF-MS is used for urinary
sample separation and data collection. Metabolic profiling was acquired in the ESI+ and ESI- modes. The representative based peak intensity (BPI) chromatograms in
positive and negative ion modes are showed in Fig. 6a, b.
PCA was performed as an unsupervised pattern recognition method to analyze the holistic metabolic variations
in different groups and QCs. It can be seen from the
PCA score chart (Fig. 6c, d) that the urine samples of
four groups can be clearly separated in the positive ion
mode (R2X = 0.679, Q2 = 0.410) and the negative ion
mode (R2X = 0.596, Q2 = 0.402). The QC samples are
relatively compact in both positive ion mode and negative ion mode, revealing that the stability of the analytical system is good. BG and MG are distributed
obviously in different regions, indicating that the metabolism of type 2 diabetes with NAFLD model rats has
changed. MHG and MMG are close to BG which implies
that the metabolic profile of MHG and MMG are
returning to normal after administration of MCS.
Potential biomarkers and metabolic pathway analysis
OPLS-DA analysis was performed on the MG and MHG
to find biomarkers for MCS treatment of type 2 diabetes
with NAFLD. The OPLS-DA model is of good quality,
and the model evaluation indexes in positive ion mode
Table 2 Pharmacokinetic parameters after multiple
administration of Mangiferin calcium salt (MCS) and mangiferin
in rats (n = 6)
Parameters
Mangiferin calcium salt (MCS)
Mangiferin
240 mg/kg (Mean ± SD)
Fig. 3 The comparison of mean plasma concentration-time curves
of MCS and mangiferin after multiple oral administrations in dosage
of 240 mg/kg
AUC(0-t)(μg/L·h)
27,871.50 ± 9197.60*
9075.00 ± 2631.75
AUC(0-∞)(μg/L·h)
30,789.48 ± 11,084.21*
9729.04 ± 2724.13
MRT(0-t)(h)
7.31 ± 1.82
6.93 ± 0.97
MRT(0-∞)(h)
9.77 ± 2.40
8.63 ± 1.05
T1/2(kα)(h)
0.77 ± 0.08
0.84 ± 0.11
T1/2(ke)(h)
5.54 ± 0.72
4.92 ± 0.63
Tmax(h)
3.02 ± 0.09*
4.05 ± 0.36
Cssmin(μg/ml)
0.12 ± 0.02*
0.03 ± 0.01
Cmax(μg/ml)
3.42 ± 1.19*
1.16 ± 0.20
Cavg(μg/ml)
1.16 ± 0.09*
0.38 ± 0.03
V/F(c) (L/kg)
75.73 ± 18.93*
215.53 ± 40.95
CL/F(S)(L/kg·h)
9.48 ± 1.52*
30.36 ± 8.50
FI(%)
2.84 ± 0.19
2.97 ± 0.21
Compared with mangiferin group, *p < 0.05
Lin et al. BMC Pharmacology and Toxicology
(2020) 21:59
Page 6 of 12
Fig. 4 The effect of MCS on type 2 diabetes patients with NAFLD model rat. a content of serum FBG and FINS, b level of serum TG and TC, c
activities of serum ALT, AST and GGT
are R2Y = 0.95, Q2 = 0.83, and the model evaluation indexes in negative ion mode are R2Y = 0.91, Q2 = 0.85. In
the OPLS-DA score chart (Fig. 7a, b), the MG and MHG
can be clearly divided into two parts, indicating that the
difference between the groups is much larger than the
difference between the groups. In S-plot (Fig. 7c, d), the
points at both ends of the S-type are potential biomarkers, and the VIP > 1.0 and p-value< 0.05 between
DG, MG and MHG are used as the criterion for another
biomarker. Finally, 16 endogenous metabolites were
Lin et al. BMC Pharmacology and Toxicology
(2020) 21:59
Page 7 of 12
Fig. 5 The histological examination of liver tissue (magnification×200). The data are representative H&E stained sections from each group. a Blank
control group, BG, b model control group, MG, c MCS High-dose group, MHG, d Medium dose group, MMG
identified as potential biomarkers (Table 3). Metabolic
pathways affected by the biomarkers can be obtained by
MetPA ( analysis, including Taurine and hypotaurine metabolism, Pantothenate
and CoA biosynthesis, Alanine, aspartate and glutamate
metabolism, Riboflavin metabolism, Arginine biosynthesis, Citrate cycle (TCA cycle), Glyoxylate and dicarboxylate metabolism, Tryptophan metabolism, Primary
bile acid biosynthesis, Fatty acid biosynthesis and Purine
metabolism (Fig. 8a). Searching these metabolic
Fig. 6 PCA score plots of urine metabolic profiling of BG (red), MG (green), MHG (blue), MMG (violet) and QCs (black) in positive mode (a) and
negative mode (b)
Lin et al. BMC Pharmacology and Toxicology
(2020) 21:59
Page 8 of 12
Fig. 7 OPLS-DA score plots of urine metabolic profiling of MG (■) and MHG (*) in positive mode (a) and negative mode (b) and OPLS-DA S-plots
in positive mode (c) and negative mode (d)
pathways and biomarkers in KEGG database and establishing the metabolic correlation network and heatmap
of metabolites affected by MCS treatment (Fig. 8b, c).
Discussion
Mangiferin is widely found in many edible and medicinal
plants and has many pharmacological activities, such as
antitussive, expectorant, antiasthmatic, central depression, anti-diabetic, antioxidant, anti-inflammatory,
bacteriostatic, anti-viral, anti-tumor, choleretic and immunomodulatory, so it has attracted the attention of researchers [14, 19]. Especially it has a good improvement
effect on metabolic diseases such as diabetes, nonalcoholic fatty liver and hyperuricemia [27]. It has been
reported that mangiferin under hypoxic conditions can
promote the absorption of glucose by cells and improve
insulin resistance and damage in fat cells [28]. It can significantly reduce blood glucose levels, increase glucose
Table 3 Identification results of potential biomarkers
Mode
ESI+
ESI-
RT
Measured mass
VIP
Formula
Error (ppm)
Identification
Trenda
7.19
206.0438
4.78
C10H7NO4
1.0
Xanthurenic acid
up
2.59
338.1134
3.07
C7H14N2O6S
3.0
5-L-Glutamyl-taurine
up
2.30
105.0414
2.91
C10H18N4O6
-6.7
Argininosuccinic acid
down
1.18
220.1181
2.86
C9H17NO5
0.9
Pantothenic acid
up
1.93
162.0673
2.80
C12H22N2O6S
0.6
D-Pantothenoyl-L-cysteine
down
0.51
191.0206
2.18
C6H8O7
-2.0
Citric acid
up
3.08
164.0711
2.13
C9H9NO2
-3.0
3-Methyldioxyindole
up
8.04
426.3567
1.77
C25H47NO4
2.6
Vaccenyl carnitine
up
1.70
135.0641
1.70
C5H10O4
-8.1
2,3-Dihydroxyvaleric acid
down
2.74
143.1067
6.68
C8H16O2
-7.7
Caprylic acid
up
0.48
167.0201
3.11
C5H4N4O3
6.0
Uric acid
down
6.37
377.1454
2.79
C17H20N4O6
0.8
Riboflavin
up
3.30
173.0808
2.32
C8H14O4
-6.4
Suberic acid
down
0.40
124.0067
2.29
C2H7NO3S
6.4
Taurine
up
1.13
154.0505
1.53
C7H7NO3
2.6
3-Hydroxyanthranilic acid
up
2.24
157.0882
1.28
C8H14O3
1.9
3-Oxooctanoic acid
down
Metabolite change trend in MHG compared with MG
Lin et al. BMC Pharmacology and Toxicology
(2020) 21:59
Page 9 of 12
Fig. 8 Correlation networks of potential biomarkers and heatmap of metabolites responding to MCS. a Metabolic pathway enrichment analysis
(from a to k are Taurine and hypotaurine metabolism, Pantothenate and CoA biosynthesis, Alanine, aspartate and glutamate metabolism,
Riboflavin metabolism, Arginine biosynthesis, Citrate cycle (TCA cycle), Glyoxylate and dicarboxylate metabolism, Tryptophan metabolism, Primary
bile acid biosynthesis, Fatty acid biosynthesis and Purine metabolism), b Metabolic pathway networks analysis (the red color indicates upregulated level; the green color indicates down-regulated level), c Heatmap of metabolites
tolerance, increase serum insulin levels, and promote islet
regeneration and β cell proliferation, and inhibit β cell
apoptosis [29, 30]. In addition, mangiferin can reduce insulin resistance by regulating the redistribution of sarcolemma and intracellular fatty acid transfer enzymes in
skeletal muscle [31]. It still can inhibit liver diacylglycerol
acyltransferase gene expression, reduce liver quality and
liver TG and TC levels, and inhibit excessive accumulation of lipid in the liver [32]. Although mangiferin has
many pharmacological effects, due to its low solubility, it
cannot be completely dissolved in the aqueous phase and
the oil phase, has poor oral absorption, and has low bioavailability, which limits further clinical development and
application [33]. At present, the modification of mangiferin derivatives and their metabolic active products may
be an important direction for in-depth research and clinical application for it [34]. Mangiferin calcium salt (MCS)
is a derivative of mangiferin, which may be an effective
way to solving the above problems.
Therefore, we detected the blood drug concentration
of MCS and mangiferin in single and multiple doses,
and calculated their pharmacokinetic parameters in different time. Compared with mangiferin, the Tmax of
MCS was advanced, and the AUC, Cmax of MCS increased significantly indicating that the degree of oral
absorption of MCS was improved.
Shorter peak time showed that the rate of absorption of MCS was faster than the monomer of mangiferin. Moreover MCS has higher bioavailability than
mangiferin. Compared the pharmacokinetic parameters between single and multiple dose oral administration of MCS, MRT and T1/2 had no significant
change, which indicated that the absorption of MCS
in rats is basically constant, and it will not change
with continuous administration. These results showed
that compared to mangiferin, MCS had a faster absorption rate, better absorption degree and its absorption was more constant.
Lin et al. BMC Pharmacology and Toxicology
(2020) 21:59
IR plays a very key role in the pathogenesis of type 2
diabetes and NAFLD [35]. IR causes the body to produce compensation and secrete more insulin due to the
body’s decreased glucose regulation function. This result
leads to the hydrolysis of triglycerides in the body and
the increase of plasma fatty acid content, which ultimately promotes the increase of blood sugar and is excreted from the kidney [36, 37]. At the same time, IR
prevents insulin from efficiently inhibiting lipase activity.
The increase in this enzyme activity will cause a large
amount of fat to be broken down and enter the liver
through the hepatic portal vein, causing simple fatty
liver, which is related to oxidative stress Lipid peroxidation and the further action of inflammatory factors will
lead to increased triglyceride content and destroy liver
function [38–40]. Our previous research results show
that MCS can significantly reduce fasting blood glucose
and fasting insulin levels in rats with type 2 diabetes and
NAFLD, reduce serum lipid levels, improve liver function, repair liver damage, and significantly increase the
antioxidant capacity of model rats Ability to reduce oxidative stress and lipid peroxidation damage in model
rats. It reveals that MCS has a certain therapeutic effect
on type 2 diabetes and NAFLD. Moreover, 16 potential
biomarkers related to type 2 diabetes and NAFLD were
changed in the urine of MCS treated rats in our metabolomic study.
Among these metabolites, D-Pantothenoyl-L-cysteine
is involved in the biosynthetic pathway of pantothenic
acid and CoA, and is a synthetic precursor of Pantothenic acid that is a water-soluble vitamin required for life
support. It is involved in the synthesis of acetyl-CoA and
plays an important role in the metabolism of protein, fat,
and sugar in the body [41]. Riboflavin is a prosthetic
group of flavinases in the electron transfer process of the
respiratory chain, which has anti-lipid peroxidation effect. As an important oxidoreductase in the body, flavinase participates in sugar oxidation metabolism and
promotes the conversion of pyruvate to acetyl-CoA
Process, thereby improving energy supply [42]. The average content of riboflavin in the urine of type 2 diabetes
patients is generally lower than that of the normal population [43]. Caprylic acid, suberic acid and 3-oxooctanoic
acid are important unsaturated fatty acids in the body.
They regulate metabolism and cell signal transduction in
the body, participate in the synthesis, decomposition and
metabolism of fatty acids, and are converted into acetylCoA through beta oxidation into the citric acid cycle
[44, 45]. Vaccenyl carnitine is a long-chain acyl fatty acid
derivative of carnitine. Mitochondrial carnitine palmitoyl
transferase II deficiency patients accumulate long-chain
acyl fatty acid derivatives in the cytoplasm and serum
[46]. It is a normal recessive disease of fatty acid metabolism. Abnormal oxidation of mitochondrial fatty acids
Page 10 of 12
can lead to hypoglycemia, liver dysfunction, myopathy,
cardiomyopathy and encephalopathy [47, 48]. Argininosuccinic acid is a metabolite in the main biochemical
pathway of lysine. It is an intermediate for the metabolism of lysine and sucralose. Studies in rats have shown
that the level of argininosuccinic acid increases in prediabetes, so aminoadipate can be used as a predictive
biomarker for the development of diabetes [49].
Xanthurenic
acid,
3-Methyldioxyindole,
3Hydroxyanthranilic acid are metabolite of tryptophan
metabolism. Tryptophan and its metabolites play an
important role in various physiological processes in
the body, which mainly affect the immune system
and nervous system. It is closely related to various
diseases such as autoimmune diseases, abnormal
liver function, CNS diseases and cancer [50]. 5-LGlutamyl taurine is an intermediate of taurine metabolism. Taurine has many biological functions,
such as cell membrane stabilizers and ion transmission accelerators, which can affect body fat metabolism, reduce inflammation and oxidative stress. Uric
acid is a product of purine metabolism [51]. Abnormal purine metabolism can cause uric acid accumulation in the body, leading to gout, chronic kidney
disease, diabetes, hyperlipidemia, hypertension and
other diseases [52].
These metabolites are closely related to the occurrence
and development of type 2 diabetes and NAFLD. In this
study, MCS can exert its therapeutic effect by regulating
the above metabolites.
Conclusions
In summary, our results showed that the pharmacokinetic profiles of MCS were better than mangiferin. Also
MCS had a good therapeutic effect on type 2 diabetes
with NAFLD rats by regulating glycolipid metabolism.
The metabolomics could provide effective information
for metabolic changes in model rats after administration
of MCS in urine. However the animal models do not
fully reflect human NAFLD, and there are still some debates about the occurrence of NAFLD in T2DM. Our
results might help to provide useful evidence for mechanism and clinical applications of MCS acting on type 2
diabetes and NAFLD.
Abbreviations
MCS: Mangiferin calcium salt; NAFLD: Non-alcoholic fatty liver; IR: Insulin
resistance; MGN: Mangiferin; HPLC: High performance liquid
chromatography; STZ: Streptozotocin; BG: Blank control group; MG: Model
control group; MHG: MCS High-dose group; MMG: Medium dose group;
MLG: Low-dose group; FBG: Fasting blood glucose; FINS: Fasting insulin;
TG: Triglyceride; TC: Total cholesterol; AST: Aspartate aminotransferase;
ALT: alanine aminotransferase; GGT: gamma-glutamyl transpeptadase;
H&E: Hematoxylin and eosin; UPLC-Q-TOF-MS: Ultra-performance liquid
chromatography coupled with quadrupole time-of-flight mass spectrometry;
QC: Quality control; PCA: Principal component analysis; OPLS-DA: Orthogonal
projection to latent structures squares-discriminant analysis
Lin et al. BMC Pharmacology and Toxicology
(2020) 21:59
Acknowledgments
Not applicable.
Authors’ contributions
Research design: XH and ZL; research implementation: WY, GL and HL; data
analysis: WW, WY and HT; writing—original draft preparation: HL;
writing—review and editing: YL and HL. All authors read and approved the
final manuscript.
Funding
This research was funded by the Jilin Province Jilin Province Industrial
Technology Project (grant number 2013C017–2 and 20200032–2), Jilin
Province Science and Technology Development Project (grant number
20200801028GH). The funding body had no role in the design of this study
and collection, analysis, and interpretation of the data, as well as in the
preparation of the manuscript.
Availability of data and materials
The datasets used and/or analyzed during the current study are available
from the corresponding author on reasonable request.
Ethics approval and consent to participate
The study complied with the guidelines of the research commitment
institution and its administrative region, as the Jilin Province Experimental
Animal Management Ordinance and Changchun University of Chinese
Medicine Laboratory Animal Management Measures. All experiments were
approved by the Laboratory Animals Ethics Committee, Changchun
University of Chinese Medicine.
Consent for publication
Not applicable.
Competing interests
The authors declare no conflict of interest.
Author details
1
College of Pharmacy, Changchun University of Chinese Medicine,
Changchun, China. 2Changzhou Deze Drug Research Co., Ltd, Changzhou,
China.
Received: 20 June 2020 Accepted: 27 July 2020
References
1. Pinchevsky Y, et al. Demographic and clinical factors associated with
development of type 2 diabetes: a review of the literature. Int J Gen Med.
2020;13:121–9.
2. Kumar R, Priyadarshi RN, Anand U. Non-alcoholic fatty liver disease: growing
burden, adverse outcomes and associations. J Clin Transl Hepatol. 2020;8(1):
76–86.
3. Ke W, et al. Dietary Platycodon grandiflorus Attenuates Hepatic Insulin
Resistance and Oxidative Stress in High-Fat-Diet Induced Non-Alcoholic
Fatty Liver Disease. Nutrients. 2020;12(2):480.
4. Tuong TTK, et al. Non-Alcoholic Fatty Liver Disease in Patients with Type 2
Diabetes: Evaluation of Hepatic Fibrosis and Steatosis Using Fibroscan.
Diagnostics (Basel). 2020;10(3):159.
5. Matsuzaka T, Shimano H. A new perspective on type 2 diabetes,
dyslipidemia, and non-alcoholic fatty liver disease. J Diabetes Investig. 2020;
11(3):533–4.
6. Saponaro C, Gaggini M, Gastaldelli A. Nonalcoholic fatty liver disease and
type 2 diabetes: common pathophysiologic mechanisms. Curr Diab Rep.
2015;15(6):607.
7. Cusi K. Treatment of patients with type 2 diabetes and non-alcoholic fatty
liver disease: current approaches and future directions. Diabetologia. 2016;
59(6):1112–20.
8. Tao Z, et al. High-fat diet from perilla oil induces insulin resistance despite
lower serum lipids and increases hepatic fatty acid oxidation in rats. Lipids
Health Dis. 2014;13:15.
9. Byeon SK, et al. High-throughput and rapid quantification of lipids by
nanoflow UPLC-ESI-MS/MS: application to the hepatic lipids of rabbits with
nonalcoholic fatty liver disease. Anal Bioanal Chem. 2016;408(18):4975–85.
Page 11 of 12
10. Sun R, et al. Silybin ameliorates hepatic lipid accumulation and modulates
global metabolism in an NAFLD mouse model. Biomed Pharmacother.
2020;123:109721.
11. Soder J, et al. Indication of metabolic inflexibility to food intake in
spontaneously overweight Labrador retriever dogs. BMC Vet Res. 2019;15(1):
96.
12. Dhibi M, et al. The intake of high fat diet with different trans fatty acid
levels differentially induces oxidative stress and non alcoholic fatty liver
disease (NAFLD) in rats. Nutr Metab. 2011;8:65.
13. Chai SY, et al. Differential patterns of insulin secretion and sensitivity in
patients with type 2 diabetes mellitus and nonalcoholic fatty liver disease
versus patients with type 2 diabetes mellitus alone. Lipids Health Dis. 2014;
13:7.
14. Imran M, et al. Mangiferin: a natural miracle bioactive compound against
lifestyle related disorders. Lipids Health Dis. 2017;16(1):84.
15. Rasool M, et al. Mangiferin, a natural polyphenol protects the hepatic
damage in mice caused by CCl4 intoxication. Comp Clin Pathol. 2011;21(5):
865–72.
16. Marquez L, et al. Mangiferin decreases inflammation and oxidative damage
in rat brain after stress. Eur J Nutr. 2012;51(6):729–39.
17. Li HW, et al. Protective effects of mangiferin in subchronic developmental
lead-exposed rats. Biol Trace Elem Res. 2013;152(2):233–42.
18. Liu YW, et al. Suppression of methylglyoxal hyperactivity by mangiferin can
prevent diabetes-associated cognitive decline in rats. Psychopharmacology.
2013;228(4):585–94.
19. Du S, et al. Mangiferin: an effective therapeutic agent against several
disorders (review). Mol Med Rep. 2018;18(6):4775–86.
20. Szandruk M, Merwid-Lad A, Szelag A. The impact of mangiferin from
Belamcanda chinensis on experimental colitis in rats.
Inflammopharmacology. 2018;26(2):571–81.
21. Kammalla AK, et al. Comparative pharmacokinetic study of mangiferin after
oral administration of pure mangiferin and US patented polyherbal
formulation to rats. AAPS PharmSciTech. 2015;16(2):250–8.
22. Liu M, et al. Solubility, Antioxidation, and Oral Bioavailability Improvement
of Mangiferin Microparticles Prepared Using the Supercritical Antisolvent
Method. Pharmaceutics. 2020;12:2.
23. Xu G; Hainan Deze Pharmaceutical Research Co., Ltd. Mangiferin Salt and
Method of Preparing the Same and Use Thereof. CN101108869B; 2008.
24. Telang M, et al. Therapeutic and cosmetic applications of mangiferin: a
patent review. Expert Opin Ther Patents. 2013;23(12):1561–80.
25. Nar A, Gedik O. The effect of metformin on leptin in obese patients with
type 2 diabetes mellitus and nonalcoholic fatty liver disease. Acta Diabetol.
2009;46(2):113–8.
26. LIN H, et al. Effect of Mangiferin calcium salt on type 2 diabetes mellitus
and nonalcoholic fatty liver in rats. Chinese J Clin Pharmacol. 2018;34(13):
1543–6.
27. Apontes P, et al. Mangiferin stimulates carbohydrate oxidation and protects
against metabolic disorders induced by high-fat diets. Diabetes. 2014;63(11):
3626–36.
28. YANG C-Q, et al. Mangiferin ameliorates insulin resistance by inhibiting
inflammation and regulatiing adipokine expression in adipocytes under
hypoxic condition. Chin J Nat Med. 2017;15(9):0664–73.
29. Costes S. Targeting protein misfolding to protect pancreatic beta-cells in
type 2 diabetes. Curr Opin Pharmacol. 2018;43:104–10.
30. Wang HL, et al. Mangiferin facilitates islet regeneration and beta-cell
proliferation through upregulation of cell cycle and beta-cell regeneration
regulators. Int J Mol Sci. 2014;15(5):9016–35.
31. Zhou L, et al. Mitigation of insulin resistance by Mangiferin in a rat model of
fructose-induced metabolic syndrome is associated with modulation of
CD36 redistribution in the skeletal muscle. J Pharmacol Exp Ther. 2016;
356(1):74–84.
32. Xing X, et al. Mangiferin treatment inhibits hepatic expression of acylcoenzyme a:diacylglycerol acyltransferase-2 in fructose-fed spontaneously
hypertensive rats: a link to amelioration of fatty liver. Toxicol Appl
Pharmacol. 2014;280(2):207–15.
33. Khurana RK, et al. Improving the biopharmaceutical attributes of mangiferin
using vitamin E-TPGS co-loaded self-assembled phosholipidic nano-mixed
micellar systems. Drug Deliv Transl Res. 2018;8(3):617–32.
34. Quadri F, Telang M, Mandhare A. Therapeutic and cosmetic applications of
mangiferin: an updated patent review (patents published after 2013). Expert
Opin Ther Pat. 2019;29(6):463–79.
Lin et al. BMC Pharmacology and Toxicology
(2020) 21:59
35. Na LX, et al. Curcumin improves insulin resistance in skeletal muscle of rats.
Nutr Metab Cardiovasc Dis. 2011;21(7):526–33.
36. Zhang Q, et al. Mangiferin improved Palmitate-induced-insulin resistance by
promoting free fatty acid metabolism in HepG2 and C2C12 cells via
PPARalpha: Mangiferin improved insulin resistance. J Diabetes Res. 2019;
2019:2052675.
37. Wang C, et al. The compound of Mangiferin-Berberine salt has potent
activities in modulating lipid and glucose metabolisms in HepG2 cells.
Biomed Res Int. 2016;2016:8753436.
38. Wang H, et al. Mangiferin ameliorates fatty liver via modulation of
autophagy and inflammation in high-fat-diet induced mice. Biomed
Pharmacother. 2017;96:328–35.
39. Li J, et al. Mangiferin improves hepatic lipid metabolism mainly through its
metabolite-Norathyriol by modulating SIRT-1/AMPK/SREBP-1c signaling.
Front Pharmacol. 2018;9:201.
40. Stanford KI, Goodyear LJ. Exercise and type 2 diabetes: molecular
mechanisms regulating glucose uptake in skeletal muscle. Adv Physiol Educ.
2014;38(4):308–14.
41. Oxenkrug G. Insulin resistance and Dysregulation of tryptophan–Kynurenine
and Kynurenine–Nicotinamide adenine dinucleotide metabolic pathways.
Mol Neurobiol. 2013;48(2):294–301.
42. Mazur-Bialy AI, Pochec E. Riboflavin Reduces Pro-Inflammatory Activation of
Adipocyte-Macrophage Co-culture. Potential Application of Vitamin B2
Enrichment for Attenuation of Insulin Resistance and Metabolic Syndrome
Development. Molecules. 2016;21:12.
43. Zhou SS, et al. B-vitamin consumption and the prevalence of diabetes and
obesity among the US adults: population based ecological study. BMC
Public Health. 2010;10:746.
44. ARUOMA OI, et al. The antioxidant action of taurine, hypotaurine and their
metabolic precursors. Biochem J. 1988;256:251–5.
45. Casquel De Tomasi L, et al. Pathological hypertrophy and cardiac
dysfunction are linked to aberrant endogenous unsaturated fatty acid
metabolism. PLoS One. 2018;13(3):e0193553.
46. GEMPEL K, et al. Screening for carnitine palmitoyltransferase II deficiency by
tandem mass spectrometry. J Inherit Metab Dis. 2002;25:17–27.
47. SHEN JJ, et al. Acylcarnitines in fibroblasts of patients with long-chain 3hydroxyacyl-CoA dehydrogenase deficiency and other fatty acid oxidation
disorders. J Inherit Metab Dis. 2000;23:27–44.
48. Spiekerkoetter U, et al. Changes in blood carnitine and acylcarnitine profiles
of very long-chain acyl-CoA dehydrogenase-deficient mice subjected to
stress. Eur J Clin Investig. 2004;34:191–6.
49. Yuan W, et al. Amine metabolomics of hyperglycemic endothelial cells
using capillary LC-MS with isobaric tagging. J Proteome Res. 2011;10(11):
5242–50.
50. Platten M, et al. Tryptophan metabolism as a common therapeutic target in
cancer, neurodegeneration and beyond. Nat Rev Drug Discov. 2019;18(5):
379–401.
51. Murakami S. Role of taurine in the pathogenesis of obesity. Mol Nutr Food
Res. 2015;59(7):1353–63.
52. Mortada I. Hyperuricemia, type 2 diabetes mellitus, and hypertension: an
emerging association. Curr Hypertens Rep. 2017;19(9):69.
Publisher’s Note
Springer Nature remains neutral with regard to jurisdictional claims in
published maps and institutional affiliations.
Page 12 of 12