Prediagnostic serum glucose and lipids in relation to survival in breast cancer patients: A competing risk analysis
Bạn đang xem bản rút gọn của tài liệu. Xem và tải ngay bản đầy đủ của tài liệu tại đây (563.7 KB, 9 trang )
Wulaningsih et al. BMC Cancer (2015) 15:913
DOI 10.1186/s12885-015-1928-z
RESEARCH ARTICLE
Open Access
Prediagnostic serum glucose and lipids in
relation to survival in breast cancer
patients: a competing risk analysis
Wahyu Wulaningsih1*†, Mariam Vahdaninia1†, Mark Rowley2, Lars Holmberg1,3,4, Hans Garmo1,4, Håkan Malmstrom5,
Mats Lambe4,6, Niklas Hammar5,7, Göran Walldius8, Ingmar Jungner9, Anthonius C. Coolen2 and
Mieke Van Hemelrijck1,5
Abstract
Background: Abnormal glucose and lipids levels may impact survival after breast cancer (BC) diagnosis, but their
association to other causes of mortality such as cardiovascular (CV) disease may result in a competing risk problem.
Methods: We assessed serum glucose, triglycerides (TG) and total cholesterol (TC) measured prospectively
3 months to 3 years before diagnosis in 1798 Swedish women diagnosed with any type of BC between 1985 and
1999. In addition to using Cox regression, we employed latent class proportional hazards models to capture any
heterogeneity of associations between these markers and BC death. The latter method was extended to include
the primary outcome (BC death) and competing outcomes (CV death and death from other causes), allowing latent
class-specific hazard estimation for cause-specific deaths.
Results: A lack of association between prediagnostic glucose, TG or TC with BC death was observed with Cox
regression. With latent class proportional hazards model, two latent classes (Class I and II) were suggested. Class I,
comprising the majority (81.5 %) of BC patients, had an increased risk of BC death following higher TG levels
(HR: 1.87, 95 % CI: 1.01–3.45 for every log TG increase). Lower overall survival was observed in Class II, but no
association for BC death was found. On the other hand, TC positively corresponded to CV death in Class II,
and similarly, glucose to death from other causes.
Conclusion: Addressing cohort heterogeneity in relation to BC survival is important in understanding the
relationship between metabolic markers and cause-specific death in presence of competing outcomes.
Keywords: Breast cancer, Glucose, Lipid, Competing risk, Survival, Latent class
Background
Disorders in glucose and lipid metabolism have been
suggested as a mechanism linking obesity and breast
cancer (BC) [1, 2]. In addition to their roles in carcinogenesis, increasing evidence suggests that abnormal
levels of serum glucose and lipids impact survival in BC
patients [3–5]. Most of these studies investigated all* Correspondence:
†
Equal contributors
1
Cancer Epidemiology Group, Division of Cancer Studies, King’s College
London, London, UK
Full list of author information is available at the end of the article
cause mortality as the outcome of interest. When BCspecific death is studied as the primary outcome, information on other causes of death such as cardiovascular
(CV) disease is rarely addressed in the analysis [4]. Given
the high survivorship of BC [6, 7] and how glucose and
lipids are linked to CV mortality [8, 9], one must consider the possibility of competing risks. For instance, a
competing risk situation arises when a person has a
common risk factor of dying from both BC and CV disease (and other causes), so that any earlier outcome will
‘prevent’ the individual from developing others [10].
Interpreting survival data thus becomes difficult because
commonly used methods, i.e., Kaplan-Meier survival estimates and Cox’ proportional hazards, rely on the
© 2015 Wulaningsih et al. Open Access This article is distributed under the terms of the Creative Commons Attribution 4.0
International License ( which permits unrestricted use, distribution, and
reproduction in any medium, provided you give appropriate credit to the original author(s) and the source, provide a link to
the Creative Commons license, and indicate if changes were made. The Creative Commons Public Domain Dedication waiver
( applies to the data made available in this article, unless otherwise stated.
Wulaningsih et al. BMC Cancer (2015) 15:913
assumption of non-informative censoring. When this assumption is met, any censoring due to non-primary
events does not affect one’s risk of developing the primary outcome, thus such a risk is proportional to the
levels of risk factors or covariates observed. However,
when competing risks are an issue a heterogeneous association between covariates and the primary outcome may
exist, reflecting subpopulations or classes with different
mortality risk profiles. This heterogeneity within a cohort
is scarcely studied in the context of cancer survival.
The objectives of the present study were to investigate
how prediagnostic serum glucose, triglycerides (TG) and
total cholesterol (TC) are associated to BC death, and to
capture heterogeneity of associations between these
markers and BC death which may indicate a competing
risk situation. We used prospectively collected data from
the Apolipoprotein Mortality Risk (AMORIS) Study and
utilised 1) Cox proportional hazards model to assess the
link between serum glucose, TG and TC with BC death,
and 2) latent class proportional hazards models with BC
death as the primary outcome and deaths from CV disease and other causes as non-primary outcomes to capture heterogeneity of BC mortality risk.
Methods
Study population
The Apolipoprotein Mortality Risk (AMORIS) Study has
been described in detail elsewhere [11, 12]. Briefly, the
recently updated AMORIS database comprises 812,073
individuals with blood samples sent for laboratory testing to the Central Automation Laboratory (CALAB) in
Stockholm, Sweden. Individuals recruited were mainly
from the greater Stockholm area, and either healthy and
having laboratory testing as a part of general check-up,
or outpatients referred for laboratory testing. None of
the participants were inpatients at the time the samples
were analysed. In the AMORIS study, the CALAB database was linked to Swedish national registries such as
the Swedish National Cancer Register, the Hospital Discharge Register, the Cause of Death Register, the consecutive Swedish Censuses during 1970–1990, and the
National Register of Emigration using the Swedish 10digit personal identity number, providing complete
follow-up information until 31 December 2011.
From the AMORIS population, we selected 1798
women with an incident diagnosis of BC between 1985
and 1999 who had baseline measurements of serum glucose, TG and TC within 3 months to 3 years prior to diagnosis. Diagnosis of BC was obtained from the Swedish
National Cancer Register using the Seventh Revision of
the International Classification of Diseases code (ICD7 code: 174), and information on cause-specific deaths
(BC death, CV death) was obtained from the Swedish
Cause of Death Register. Follow-up time was defined as
Page 2 of 9
the time from diagnosis until death from any causes, emigration, or end of study (31 December 2011), whichever occurred first. The ethics review board of the
Karolinska Institute approved the study, and permits
were obtained from Swedish Data Inspection to correlate laboratory results with Swedish national registers. Anonymity of participants was maintained
throughout the study. Participant informed consent
was not required for this register linkage study [13].
Serum glucose and lipids measurements
Serum levels of glucose (mmol/L), TG (mmol/L), and
TC (mmol/L) were measured enzymatically with standard methods [12]. All three markers were measured at
the same day, within 3 months to 3 years prior to diagnosis. This timeframe was selected to capture metabolic
derangements during ongoing malignancy process while
excluding effects of breast cancer diagnostic or treatment interventions. All measurements were fully automated with automatic calibration and performed at one
accredited laboratory [11]. TG levels were not normally
distributed, and therefore we used log-transformed
values of all markers in addition to their quartiles in the
analysis.
Covariates
Information on fasting status at baseline measurements
(fasting, non-fasting, unknown) was obtained from the
CALAB database. Socioeconomic status (SES; white collar, blue collar, unemployed or unknown) was based on
occupational groups in the Population and Housing
Census and classified all gainfully employed subjects as
manual workers and non-manual workers, which were
referred to as blue collar and white collar workers, respectively [14].
Statistical analysis
We began by employing multivariable Cox proportional
hazards regression to assess the association between logtransformed values and quartiles of glucose, TG and TC
and the risk of BC death as the primary outcome, CV
death and other death as competing outcomes. Adjustment was performed for potential confounders including
age at diagnosis, SES, and fasting status at baseline measurements. Glucose, TG and TC were each analysed
while adjusting for the other two markers as continuous
variables. The proportionality of hazards assumption
was met after assessing time-varying covariates which
were the cross-products of each variable and time. To
assess any potential competing risk, we used cumulative
incidence functions to display the proportions of deaths
from BC, CV disease and other causes by quartiles of
glucose, TG, and TC.
Wulaningsih et al. BMC Cancer (2015) 15:913
Page 3 of 9
disease and other causes as non-primary outcomes into
the latent class proportional hazards model. Class membership probabilities were retrospectively predicted
based on associations between covariates and events. Independent samples T-test and Chi2 test were used to assess differences in characteristics of study participants by
predicted class membership. We further displayed latent
class-specific cumulative incidence functions for BC, CV
and other death by quartiles of the three markers. Finally, hazard ratios for BC, CV and other death by levels
of glucose, TG, and TC were estimated for each latent
class according to the maximum-a-posteriori (MAP)
likelihood, which took into account all three outcomes
[19]. More details on the latent class survival analysis
are available as Additional file 1.
Descriptive analysis and Cox proportional hazards
model were performed with Statistical Analysis Software
(SAS) release 9.3 (SAS Institute, Cary, NC) and R
We further investigated the association between serum
glucose, TG and TC and BC survival using a latent class
proportional hazards model. Latent class analysis has
been used to identify different classes or latent variables
within a given population which underlies the pattern of
association between observed covariates [15]. In medical
research, the latent class variable has been incorporated
into various regression analyses, including Cox proportional hazards models, to allow identification of subgroups with different risk profiles [16–18]. To capture
heterogeneity in the context of BC survival, we extended
the proportional hazards model to encompass the latent
class variable in addition to glucose, TG and TC, which
were assessed as continuous variables. The number of
latent classes present in the cohort was identified with
Bayesian model selection. To assess BC-specific death
whilst accounting for competing risks, we incorporated
BC death as the primary outcome and deaths from CV
Table 1 Descriptive characteristics of study participants overall and by causes of death
All BC
Overall death
BC death
CV death
Other death
(n = 1798)
(n = 861)
(n = 425)
(n = 179)
(n = 257)
No.
%
No.
%
No.
%
No.
%
No.
%
Age, years
Mean
58.1
62.4
56.5
71
66.2
SD
11.8
13.2
12.5
10.3
11.4
Mean
13.3
8.3
6.4
9.3
10.6
SD
6.9
5.9
5.0
6.5
6.0
Follow-up time, years
Interval between measurements and diagnosis, months
Mean
18.3
18.1
18.3
17.6
17.9
SD
9.2
9.2
9.0
9.5
9.2
SES
White collar
648
36.0
235
27.3
147
34.6
30
16.8
58
22.6
Blue collar
894
49.7
405
47.0
222
52.2
61
34.1
122
47.5
Unemployed or unknown
256
14.3
221
25.7
56
13.2
88
49.1
77
29.9
Fasting status
Fasting
1027
57.1
508
59.0
242
56.9
107
59.7
159
62.9
Non-fasting
568
31.6
254
29.5
133
31.3
52
29.1
69
26.8
Unknown
203
11.3
99
11.5
50
11.8
20
11.2
29
11.3
Glucose, mmol/L
Mean
5.1
5.2
5.0
5.5
5.4
SD
1.2
1.4
1.0
1.2
1.8
Mean
1.3
1.4
1.3
1.6
1.4
SD
0.8
0.9
0.9
0.9
0.8
Mean
5.9
6.1
5.9
6.5
6.2
SD
1.2
0.8
1.2
1.2
1.2
TG, mmol/L
TC, mmol/L
Wulaningsih et al. BMC Cancer (2015) 15:913
Page 4 of 9
version 3.0.2 (R Project for Statistical Computing,
Vienna, Austria). Latent class proportional hazards
model were performed with Advanced Survival Analysis
software version 0.2.16 (A.C.C. Coolen, M. Rowley, M.
Inoue, London, UK).
Results
At the end of follow up (mean: 13 years), a total of 861
(47.9 %) study participants were deceased. Among these
women, 425 died from BC, 179 from CV disease, and
257 from other causes. The mean age of all participants
was 58 at BC diagnosis. Levels of glucose, TG, and TC
were highest in those dying from CV disease, whereas
women who died from BC had lower levels of the three
markers compared to all women dying during follow-up
period (Table 1).
When conventional Cox proportional hazards regression was performed, no strong association was observed
between glucose, TG, and TC and risk of dying from BC
(Table 2). On the other hand, positive associations were
observed between TG and CV death, as well as glucose
and CV death. No association was observed for other
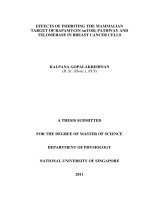
causes of death. Proportions of deaths from each causes
by quartiles of glucose, TG, TC was further displayed
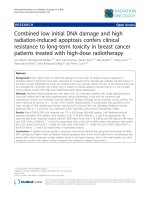
using the cumulative incidence functions. As shown in
Fig. 1, the proportion of women dying from CV disease
markedly increased with higher quartiles of the markers,
whilst deaths from BC are less frequent with higher
quartiles of the markers. This indicated CV death as a
competing event.
Our next analysis extended the proportional hazards
model to include latent class variables and assess primary and non-primary outcomes. Bayesian model
Table 2 Hazard ratios of death from BC, CV disease and other causes by levels of glucose, TG, and TC
No. of
subjects
BC death
No. of events
CV death
HRa
95 % CI
0.96
0.58, 1.59
No. of events
Other death
HRa
95 % CI
2.48
1.24, 4.96
No. of events
HRa
95 % CI
2.09
1.16, 3.76
b
Glucose, mmol/L
Continuous log
Quartiles
< 4.50
393
98
1
4.50–4.90
413
116
0.98
4.90–5.30
363
96
0.95
≥ 5.30
416
115
0.98
Ptrend
21
1
0.75, 1.29
36
1.27
0.72, 1.27
41
1.28
0.74, 1.29
80
1.67
0.83
45
1
0.74, 2.19
63
1.12
0.76, 1.64
0.75, 2.19
50
0.87
0.58, 1.30
1.02, 2.73
100
1.32
0.92, 1.89
0.03
0.20
TG, mmol/Lc
Continuous log
1.21
0.98, 1.48
1.58
1.17, 2.13
1.32
1.02, 1.71
Quartiles
< 0.70
297
81
1
0.70–1.00
491
102
0.77
1.00–1.60
555
132
0.97
≥ 1.60
455
110
1.05
Ptrend
12
1
0.57, 1.04
34
0.91
0.72, 1.29
52
1.10
0.76, 1.45
80
1.53
0.35
24
1
0.46, 1.77
56
0.96
0.59, 1.57
0.58, 2.08
95
1.28
0.81, 2.03
0.81, 2.90
83
1.22
0.75, 1.98
0.01
0.16
TC, mmol/Ld
Continuous log
0.72
0.40, 1.28
2.04
0.83, 5.04
0.67
0.32, 1.42
Quartiles
< 5.20
443
119
5.20–5.80
403
94
0.87
0.66, 1.14
37
1.52
0.83, 2.76
60
1.18
0.78, 1.79
5.80–6.60
470
102
0.79
0.60, 1.04
40
1.26
0.70, 2.27
75
1.06
0.72, 1.58
≥ 6.60
482
110
0.85
0.64, 1.15
85
1.74
0.99, 3.04
85
0.92
0.61, 1.38
Ptrend
a
1
0.21
16
1
0.08
38
1
0.38
Adjusted for age at diagnosis, SES (white collar, blue collar, unemployed or unknown), fasting status (fasting, non-fasting, unknown), glucose (continuous), TG
(continuous), and TC (continuous)
Not adjusted for bglucose, cTG, dTC
Wulaningsih et al. BMC Cancer (2015) 15:913
Proportion
0.8
0.8
Glucose quartile 2 and 3
0.6
0.6
0.4
0.4
0.4
0.2
0.2
0.2
0
0
At risk 393
0.8
Proportion
0.8
Glucose quartile 1
0.6
0
0
10
15
20
25
0
5
10
15
20
25
0
5
10
15
20
25
322
286
253
217
206
889
756
636
555
458
361
516
403
317
251
205
112
0.8
TG quartile 1
0.8
TG quartile 2 and 3
0.6
0.6
0.4
0.4
0.4
0.2
0.2
0.2
0
0
At risk 297
0.8
0
10
15
20
25
0
5
10
15
20
25
0
5
10
15
20
25
253
215
202
172
148
1046
866
746
649
538
442
455
362
277
209
171
96
0.8
0.8
TC quartile 2 and 3
0.6
0.6
0.6
0.4
0.4
0.4
0.2
0.2
0.2
TC quartile 4
Legend
BC death
CV death
Other death
0
0
0
At risk 443
TG quartile 4
5
TC quartile 1
0
Glucose quartile 4
5
0.6
0
Proportion
Page 5 of 9
5
10
15
20
25
0
5
10
15
20
25
0
5
10
15
20
25
373
319
288
259
237
873
731
618
534
435
323
482
377
301
239
191
144
Y ears
Y ears
Y ears
Fig. 1 Stacked cumulative risk of death from BC, CV disease, and other causes, stratified by quartiles of glucose, TG and TC
selection identified two latent classes in this study population. Retrospective analysis for class membership probability suggested that 81.5 % women were more likely to
be members of Class I, while the other 18.5 % belonged
to Class II. We further assessed baseline characteristics
of study participants in relation to the most probable latent class they were assigned to. Younger average age
was observed in Class I compared to Class II, and a difference in socio-economic status between classes was indicated (Table 3). With regards to clinical outcomes, no
difference in proportions of women who died from BC
was found between the two classes. However, statistically
significantly higher overall mortality rate from CV disease and other causes were seen in Class II.
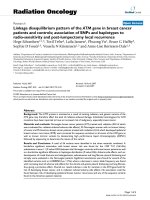
We further investigated difference in survivals between
latent classes by displaying cumulative incidence functions for different causes of death by quartiles of glucose,
TG, and TC (Fig. 2). Higher overall mortality was seen
in Class II compared to Class I. In Class I, most patients
died from BC, whereas in Class II, most died from other
causes apart from BC and CV death. Increasing absolute
numbers of deaths from BC, CV, and other causes were
seen with higher levels of all three markers in Class I, although there was no marked difference in relative mortality rates between each cause of death. On the other
hand, marked differences in relative proportions of
women dying from the three different causes were seen
across levels of markers in Class II. For instance, BC
deaths were common amongst women in the lowest
quartiles of glucose, TG, and TC, but contributed little
to total deaths in those with highest levels of the
markers. More women died from CV disease with higher
TC, and a similar association was seen between glucose
and death from other causes. Finally, the risk of different
causes of death was quantitatively assessed by obtaining
class-specific hazard estimates. As seen in Table 4, logtransformed TG corresponded to an increased risk of
dying from BC in Class I, with a hazard ratio of 1.87
(95 % CI: 1.01–3.45). No statistically significant associations with BC death were observed for other markers or
among women in Class II. In agreement with classspecific cumulative incidence functions, women in Class
II had a higher risk of CV death with higher TC and a
higher risk of other death with higher glucose levels.
Discussion
We performed Cox regression and a latent class proportional hazards analysis to assess the association
between prediagnostic markers of glucose and lipid
metabolism and death from BC in female BC patients.
The latter method accounted for CV death and other
death as competing risks. With the conventional Cox
Wulaningsih et al. BMC Cancer (2015) 15:913
Page 6 of 9
Table 3 Characteristics of study participants and causes of
death by predicted class membership
BC
P-value
Class I
Class II
(N = 1466)
(N = 332)
N
%
N
%
Age, years
<0.0001
Mean
57.6
60.5
SD
10.9
15.0
SES
<0.0001
White collar
554
37.8
94
28.3
Blue collar
739
50.4
155
46.7
Unemployed or missing
173
11.8
83
25.0
Fasting status
0.55
Fasting
827
56.4
200
60.2
Non-fasting
477
32.5
91
27.4
Missing
162
11.1
41
12.4
Glucose (mmol/l)
0.08
Mean
5.1
5
SD
1.3
1.1
Mean
1.3
1.3
SD
0.8
0.8
TG (mmol/l)
0.32
TC (mmol/l)
0.34
Mean
5.9
6.0
SD
1.2
1.2
BC death
342
23.3
83
25.0
0.52
CV death
129
8.8
50
15.1
<0.0001
60
4.1
197
59.3
<0.0001
Other death
proportional hazards model, a lack of association was
observed between the three markers and BC death.
However, CV death was shown as a competing event.
When latent class proportional hazards analysis were
performed, we found two distinct latent classes within
our cohort, reflecting different susceptibilities of dying
from BC based on their baseline characteristics. Class I,
comprising the majority of the study population, is associated with an increased risk of BC death following higher
TG levels. Overall survival is worse in Class II, among
which higher TC levels were associated with an increased
risk CV death and higher glucose with risk of death from
other causes. No association between the three markers
and BC death was seen in Class II.
Metabolisms of glucose and lipid have been implicated
in many chronic diseases. In the context of cancer, an
array of evidence has linked increased BC incidence with
aberrant levels of circulating glucose, TG and TC at
baseline [20–22]. Abnormal levels of these markers are
also associated with CV disease, which is the most common cause of death in general population [8, 9]. This
has also been demonstrated in our study, as both glucose and TG were associated with a higher risk of CV
death, and the associations were stronger than those
with BC death. Several biological mechanisms are suggested to underlie this common link, such as chronic inflammation and insulin resistance, which may drive
atherogenesis, cellular proliferation and angiogenesis
[2, 23, 24]. These shared metabolic pathways may
thus result in a competing risks situation, where individuals with similar sets of risk factors are equally at
risk of dying from both BC and CV disease. In this
case, a heterogeneous association between glucose
and lipid markers and BC death may be observed,
which represents subpopulations or latent classes with
different mortality risk profiles. However, this heterogeneity in survival data is not addressed by common
analytical methods in cancer epidemiology.
Cox proportional hazards regression and latent classes
proportional hazards model differ fundamentally in the
assumptions made regarding risk correlations. In Cox,
non-informative censoring is assumed, which leads to
the assumption of independence or no correlation between event times when multiple events are observed.
However, in the real-world clinical observation, such assumptions are rarely assessable and sometimes inaccurate. The latent class proportional hazards model allows
for the presence of heterogeneity underlying any observed risk associations [16] and predicts optimal parameters based on the most probable substructure of the
study population. In our study, this resulted in an optimal model with two latent classes. Overall survival was
lower in Class II than Class I, which indicates the importance of taking into account risk associations when
investigating biological markers in relation to cancer
survival.
We found TG to be associated with early death from
BC in Class I. This suggests an importance of lipid metabolism in disease progression in a relevant subset of
BC patients, which warrants further mechanistic investigation. No statistically significant association with BC
death was observed for glucose and TC, although among
Class II they were associated with higher risks of dying
from other causes and CV disease, respectively. Previous
studies have reported a null association for TG and TC
in relation to all-cause mortality [25] and BC-specific
death [26], which is similar to our findings using Cox regression and in Class II as assessed by latent classes proportional hazards model. Likewise, a lack of association
with overall death has been reported for glucose [4, 5].
Although Class I comprised the majority of all women
Wulaningsih et al. BMC Cancer (2015) 15:913
Page 7 of 9
Fig. 2 Stacked cumulative risk of death from BC, CV disease, and other causes for each latent class, stratified by quartiles of glucose, TG and TC
Wulaningsih et al. BMC Cancer (2015) 15:913
Page 8 of 9
Table 4 Hazard ratios of death from BC, CV disease and other
causes by levels of glucose, TG, and TC for each latent class
Class I
Class II
HRa
95 % CI
HRa
95 % CI
1.09
0.73, 1.63
0.84
0.45, 1.57
Log TG
1.87
1.01, 3.45
0.91
0.50, 1.68
Log TC
0.84
0.49, 1.45
1.02
0.53, 1.99
1.02
0.55, 1.91
1.46
0.97, 2.20
Log TG
7.68
2.45, 24.02
0.71
0.40, 1.25
Log TC
0.86
0.32, 2.28
2.07
1.16, 3.69
0.73
0.50, 1.05
2.26
1.50, 3.40
Log TG
1.69
0.95, 3.01
1.40
0.74, 2.64
Log TC
1.20
0.65, 2.24
0.45
0.19, 1.06
BC death
Log
glucose
CV death
Log
glucose
Other death
Log
glucose
a
All covariates were included in a single model and adjusted for age at
diagnosis, SES (white collar, blue collar, unemployed or unknown) and fasting
status (fasting, non-fasting, unknown)
studied, it is possible that the positive association between TG and Class I was diluted in the overall cohort,
resulting in a weaker association. Therefore, it is important to consider cohort heterogeneity in assessing this
relationship.
The strength of this study lies in the survival analysis
method used to address competing risks, as well as the
relatively large cohort with follow-up information for all
participants (up to 25 years). The population in the
AMORIS study was selected by analysing blood samples
from health check-ups in non-hospitalised persons.
However, any healthy cohort effect would not affect the
internal validity of our study [11]. To our knowledge,
this is the first observational study utilising latent class
proportional hazards model to address disease-specific
survival in BC, taking into account CV death and other
death as competing events. As shown in our study, the
advantage of incorporating latent class analysis and multiple events in addition to proportional hazards regression is that it allows identification of subpopulations
within the cohort and final survival or hazard estimates
of the primary event. In other words, this method may
offer a suitable approach when dealing with survival
functions or hazard rates estimation in presence of competing risks. A limitation of our study was the lack of
data representing older BC patients, which may partly
explain the low proportion of Class II. There was no information available on tumour characteristics, BC susceptibility genes, and treatment or other metabolic and
endocrine factors related to BC such as obesity and use
of hormonal replacement therapy. Although residual associations with unobserved covariates were captured by
our model through identification of latent classes,
underlying characteristics of these different subgroups of
BC patients may require further integration of other
relevant markers or baseline information.
Conclusion
The present study showed a weak association between
prediagnostic TG levels and BC death in the majority of
women with BC. On the other hand, glucose and TC
were strongly associated to mortality from causes apart
from BC in the remaining patients, among which shorter
overall survival was observed. Our study therefore demonstrated heterogeneity in the association between glucose, lipid markers, and BC survival when CV death and
other death were taken into account as competing outcomes. This implies an involvement of perturbed lipid
metabolism in BC progression and a complex interaction
between baseline biological markers and co-morbidities
in determining BC survival which warrants mechanistic
investigations. Therefore, our findings highlight the importance of considering cohort heterogeneity when
evaluating biological markers in relation to causespecific death.
Additional file
Additional file 1: Bayesian Survival Analysis with a latent class
model. (DOC 37 kb)
Competing interest
The authors declare that they have no competing interests. Niklas Hammar is
employed by the AstraZeneca, but the views expressed in the manuscript
are his own and not those of AstraZeneca.
Authors’ contributions
WW, MV, LH, HG and MVH conceived and designed the study. WW, LH, HG,
ML, NH, GW, IJ, and MVH were responsible for data acquisition and quality
control. WW, MV, MR, and ACC performed all data analysis. All authors
interpreted study findings, prepared the manuscript and reviewed the final
draft. All authors read and approved the final manuscript.
Acknowledgement
This work was supported by the National Institute for Health Research (NIHR)
Biomedical Research Centre based at Guy’s and St Thomas’ NHS Foundation
Trust and King’s College London. The views expressed are those of the
author(s) and not necessarily those of the NHS, the NIHR or the Department
of Health. The authors also acknowledge support by the Swedish Cancer
Society (Cancerfonden), the Gunnar and Ingmar Jungner Foundation for
Laboratory Medicine, the Swedish Council for Working Life and Social
Research, and Cancer Research UK.
Author details
1
Cancer Epidemiology Group, Division of Cancer Studies, King’s College
London, London, UK. 2Institute for Mathematical and Molecular Biomedicine,
King’s College London, London, UK. 3Department of Surgical Sciences,
Uppsala University Hospital, Uppsala, Sweden. 4Regional Cancer Centre,
Uppsala, Sweden. 5Department of Epidemiology, Institute of Environmental
Medicine, Karolinska Institutet, Stockholm, Sweden. 6Department of Medical
Epidemiology and Biostatistics, Karolinska Institutet, Stockholm, Sweden.
Wulaningsih et al. BMC Cancer (2015) 15:913
7
AstraZeneca Sverige, Södertalje, Sweden. 8Department of Cardiovascular
Epidemiology, Institute of Environmental Medicine, Karolinska Institutet,
Stockholm, Sweden. 9Department of Medicine, Clinical Epidemiological Unit,
Karolinska Institutet and CALAB Research, Stockholm, Sweden.
Received: 14 July 2015 Accepted: 12 November 2015
References
1. Simpson ER, Brown KA. Minireview: obesity and breast cancer: a tale of
inflammation and dysregulated metabolism. Mol Endocrinol. 2013;27:715–25.
2. Belardi V, Gallagher EJ, Novosyadlyy R, LeRoith D. Insulin and IGFs in
obesity-related breast cancer. J Mammary Gland Biol Neoplasia.
2013;18:277–89.
3. Villarreal-Garza C, Shaw-Dulin R, Lara-Medina F, Bacon L, Rivera D, Urzua L,
et al. Impact of diabetes and hyperglycemia on survival in advanced breast
cancer patients. Exp Diabetes Res. 2012;2012:732027.
4. Minicozzi P, Berrino F, Sebastiani F, Falcini F, Vattiato R, Cioccoloni F, et al.
High fasting blood glucose and obesity significantly and independently
increase risk of breast cancer death in hormone receptor-positive disease.
Eur J Cancer. 2013;49:3881–8.
5. Contiero P, Berrino F, Tagliabue G, Mastroianni A, Di Mauro MG, Fabiano S,
et al. Fasting blood glucose and long-term prognosis of non-metastatic
breast cancer: a cohort study. Breast Cancer Res Treat. 2013;138:951–9.
6. Yu XQ, O’Connell DL, Gibberd RW, Coates AS, Armstrong BK. Trends in
survival and excess risk of death after diagnosis of cancer in 1980–1996 in
New South Wales, Australia. Int J Cancer. 2006;119:894–900.
7. Hortobagyi GN, de la Salazar Garza J, Pritchard K, Amadori D, Haidinger R,
Hudis CA, et al. The global breast cancer burden: variations in epidemiology
and survival. Clin Breast Cancer. 2005;6:391–401.
8. Seshasai SRK, Kaptoge S, Thompson A, Di Angelantonio E, Gao P, Sarwar N,
et al. Diabetes mellitus, fasting glucose, and risk of cause-specific death. N
Engl J Med. 2011;364:829–41.
9. Di Angelantonio E, Sarwar N, Perry P, Kaptoge S, Ray KK, Thompson A, et al.
Major lipids, apolipoproteins, and risk of vascular disease. JAMA.
2009;302:1993–2000.
10. Satagopan JM, Ben-Porat L, Berwick M, Robson M, Kutler D, Auerbach AD. A
note on competing risks in survival data analysis. Br J Cancer.
2004;91:1229–35.
11. Holme I, Aastveit AH, Hammar N, Jungner I, Walldius G. Inflammatory
markers, lipoprotein components and risk of major cardiovascular events in
65,005 men and women in the Apolipoprotein MOrtality RISk study
(AMORIS). Atherosclerosis. 2010;213:299–305.
12. Holme I, Aastveit AH, Jungner I, Walldius G. Relationships between
lipoprotein components and risk of myocardial infarction: age, gender and
short versus longer follow-up periods in the Apolipoprotein MOrtality RISk
study (AMORIS). J Intern Med. 2008;264:30–8.
13. Ludvigsson JF, Otterblad-Olausson P, Pettersson BU, Ekbom A. The Swedish
personal identity number: possibilities and pitfalls in healthcare and medical
research. Eur J Epidemiol. 2009;24:659–67.
14. Van Hemelrijck M, Holmberg L, Garmo H, Hammar N, Walldius G, Binda E, et
al. Association between levels of C-reactive protein and leukocytes and
cancer: three repeated measurements in the Swedish AMORIS study. Cancer
Epidemiol Biomarkers Prev. 2011;20:428–37.
15. Rabe-Hesketh S, Skrondal A. Classical latent variable models for medical
research. Stat Methods Med Res. 2008;17:5–32.
16. Larsen K. Joint analysis of time-to-event and multiple binary indicators of
latent classes. Biometrics. 2004;60:85–92.
17. Kenzik KM, Martin MY, Fouad MN, Pisu M. Health-related quality of life in
lung cancer survivors: latent class and latent transition analysis. Cancer.
2015;121(9):1520–8. doi:10.1002/cncr.29232.
18. Zheng H, Tumin D, Qian Z. Obesity and mortality risk: new findings from
body mass index trajectories. Am J Epidemiol. 2013;178:1591–9.
19. MacKay DJ. Information theory, inference, and learning algorithms.
Cambridge: Cambridge University Press; 2003.
20. Kitahara CM, Berrington de González A, Freedman ND, Huxley R, Mok Y, Jee
SH, et al. Total cholesterol and cancer risk in a large prospective study in
Korea. J Clin Oncol. 2011;29:1592–8.
21. His M, Zelek L, Deschasaux M, Pouchieu C, Kesse-Guyot E, Hercberg S, et al.
Prospective associations between serum biomarkers of lipid metabolism
and overall, breast and prostate cancer risk. Eur J Epidemiol. 2014;29:119–32.
Page 9 of 9
22. Huang Y, Cai X, Qiu M, Chen P, Tang H, Hu Y, et al. Prediabetes and the risk
of cancer: a meta-analysis. Diabetologia. 2014;57:2261–9.
23. Van Gaal LF, Mertens IL, De Block CE. Mechanisms linking obesity with
cardiovascular disease. Nature. 2006;444:875–80.
24. Qian B-Z, Li J, Zhang H, Kitamura T, Zhang J, Campion LR, et al. CCL2
recruits inflammatory monocytes to facilitate breast-tumour metastasis.
Nature. 2011;475:222–5.
25. Bahl M, Ennis M, Tannock IF, Hux JE, Pritchard KI, Koo J, et al. Serum lipids
and outcome of early-stage breast cancer: results of a prospective cohort
study. Breast Cancer Res Treat. 2005;94:135–44.
26. Emaus A, Veierød MB, Tretli S, Finstad SE, Selmer R, Furberg A-S, et al.
Metabolic profile, physical activity, and mortality in breast cancer patients.
Breast Cancer Res Treat. 2010;121:651–60.
Submit your next manuscript to BioMed Central
and take full advantage of:
• Convenient online submission
• Thorough peer review
• No space constraints or color figure charges
• Immediate publication on acceptance
• Inclusion in PubMed, CAS, Scopus and Google Scholar
• Research which is freely available for redistribution
Submit your manuscript at
www.biomedcentral.com/submit