Assessment of spatial variability in fertility status and nutrient recommendation in Alanatha Cluster Villages, Kanakapura Taluk, Ramanagara District, Karnataka Using GIS Techniques
Bạn đang xem bản rút gọn của tài liệu. Xem và tải ngay bản đầy đủ của tài liệu tại đây (1.27 MB, 14 trang )
Int.J.Curr.Microbiol.App.Sci (2017) 6(5): 211-224
International Journal of Current Microbiology and Applied Sciences
ISSN: 2319-7706 Volume 6 Number 5 (2017) pp. 211-224
Journal homepage:
Original Research Article
/>
Assessment of Spatial Variability in Fertility Status and Nutrient
Recommendation in Alanatha Cluster Villages, Kanakapura Taluk,
Ramanagara District, Karnataka Using GIS Techniques
A. Sathish*, B.K. Ramachandrappa, K. Devaraja, M.S. Savitha,
M.N. Thimme Gowda and K.M. Prashanth
All India Co-ordinated Research Project for Dryland Agriculture,
UAS, GKVK, Bengaluru-560065, India
*Corresponding author email id:
ABSTRACT
Keywords
Geospatial
technology,
Nutrient mapping,
Soil fertility status,
soil testing and
fertilizer
recommendation.
Article Info
Accepted:
04 April 2017
Available Online:
10 May 2017
Knowledge of spatial variability in soil fertility is important for site specific nutrient
management. In this study, spatial variability in properties that influence soil fertility such
as soil organic carbon (OC), available N, available P 2O5 and available K2O, secondary and
micro nutrients in surface soils (0-30 cm depth) of 67 farmers' fields of Alanatha Cluster
Villages, Kanakapura Taluk, Ramanagara District, Karnataka (India) were quantified and
the respective thematic maps were prepared on the basis of ratings of nutrients. Arc Map
with spatial analyst function of Arc GIS software was used to prepare soil fertility maps.
Soils were strongly acidic to slightly acidic in reaction with normal Electrical Conductivity
(EC). Soil organic carbon content was low to high, available nitrogen in soil was low to
medium, available phosphorus was low to high, available potassium was low to high. Soil
sampled area were found to be 100 per cent sufficient in exchangeable calcium, 97 per
cent area was found to be sufficient in exchangeable magnesium. Available sulphur status
was found to be low to high. The entire area was found to be sufficient in available
manganese and copper, 86.57 per cent area was sufficient in zinc and 85.02 per cent area
was sufficient in iron in surface soils. The observed spatial variability in various soil
properties that influence soil fertility was used for deciding nutrient application to crop.
Thus providing balanced nutrients to crop based on analysis of fertility of each parcel of
land, which has resulted in enhanced crop productivity and net returns in both finger millet
and groundnut cropping system.
Introduction
will throw greater insight into the dynamics of
these soils. By characterization of these soils
one can clearly understand the inherent
capacity of soil for crop production as well as
problems that arise in successful management
of such soils for achieving higher production.
The ability of soil to support crop growth for
optimum crop yield is one of the most
important components of soil fertility that
determine the productivity of agricultural
systems. Many of the processes that influence
the soil fertility and productivity are
controlled by different characteristics of soil.
A proper understanding of the physical,
chemical and biochemical properties of soil
Soil fertility is one of the important factors
controlling yield of the crops. Soil
211
Int.J.Curr.Microbiol.App.Sci (2017) 6(5): 211-224
characterization in relation to evaluation of
fertility status of the soil of an area or region
is an important aspect in the context of
sustainable agricultural production because of
imbalanced and inadequate fertilizer use
coupled with low efficiency of other inputs.
The response (production) efficiency of
chemical fertilizer nutrients has declined
tremendously under intensive agriculture in
recent years (Yadav and Meena, 2009).
Introduction of high yielding varieties in
Indian Agriculture forced the farmers to use
high dose of NPK without micronutrient
fertilizers. This declined the level of some
micronutrients in the soil at which
productivity of crops cannot be sustained. The
deficiencies of micronutrients have become
major constraints to productivity, stability and
sustainability of soils. Nutrients strength and
their relationship with soil properties affect
the soil health. Micronutrients play a vital role
in maintaining soil health and also
productivity of crops. These are needed in
very small amounts. The soil must supply
micronutrients for desired growth of plants
and synthesis of human food.
Knowledge of spatial variability in soil
fertility is important for site specific nutrient
management. In this study, spatial variability
in properties that influence soil fertility such
as soil organic carbon (OC), available N,
available P2O5 and available K2O, secondary
and micro nutrients in surface soils of 67
farmers field of Alanatha Cluster Villages,
Kanakapura Taluk, Ramanagara District,
Karnataka (India) were quantified and the
respective thematic maps were prepared on
the basis of ratings of nutrients
Materials and Methods
Study area
The Alanatha cluster villages (Alanatha,
Mahadevapura,
Arjunahalli,
Arjunahalli
thandya and Eregowdana Doddi) is under the
revenue administration of Bannimukodlu
gram panchayat in Kanakapura taluk of
Ramanagara district, Karnataka situated in
Eastern Dry Zone (Zone No.5) of Karnataka,
located at 120 23’ N Latitude, 770 31’ E
Longitude and 968 m above mean sea level.
The soils are sandy loamy in texture.
Geographic Information System (GIS) is a
computer based information system capable
of capturing, storing, analyzing, and
displaying
geographically
referenced
information, i.e. the data identified according
to a particular location/region. And Global
Positioning System (GPS) is a satellite-based
navigation and surveying system for
determination of precise position and time,
using radio signals received from the
satellites, in real-time or in post-processing
mode. The use of GIS, which is capable to
analyze regional areas based on spatial
distribution, is well known. As more and
more data become available in a digitized
format it is possible to develop software
routines that can perform identification of
Index soil properties and preparation of
thematic maps of soil type, nutrient content in
conjunction with a GIS.
Collection of soil samples and analysis
Soil samples (0–30 cm) were collected at one
sample for 5–6 ha covering cultivated area of
the village during 2013. The co-ordinates
were recorded using GPS for all the soil
samples collected in the study area. The soil
samples were air dried and processed for
analysis.
Processed soil samples were analysed for
nutrient availability by following standard
analytical techniques. The pH and electrical
conductivity of soil samples were determined
in 1:2.5, soil: water suspension (Jackson
1973). Soil was finely grounded and passed
through 0.2 mm sieve and organic carbon was
determined by Walkely and Black (1934)
212
Int.J.Curr.Microbiol.App.Sci (2017) 6(5): 211-224
wet-oxidation method as described by
Jackson (1973) and expressed in percentage.
Available nitrogen was analyzed by
potassium permanganate method of Subbiah
and Asija (1956).
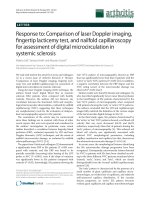
(pH 5.5–6.0), 61.00 per cent area was strongly
acidic (pH 5.0–5.5) and 11.14 per cent area
was slightly acidic (pH 6.0–6.5) (Fig. 1). The
lowest value of pH under the cultivated land
may be due to the depletion of basic cations in
crop harvest and drainage to streams in runoff
generated from accelerated erosions as
reported by Foth and Ellis (1997). This may
also be because of formation of these soils
from acidic parent material rich in basic
cations as reported by Mali and Raut (2001).
Similar results were reported by Ram et al.,
(1999).
Available phosphorus, available potassium,
exchangeable calcium and magnesium were
determined as per the standard procedures
(Jackson, 1973). The method of Lindsay and
Norvell (1978) was used for the estimation of
micronutrients (Fe, Mn, Cu and Zn) in AAS
using DTPA extract. Available boron was
estimated by using Azomethine-H method as
describe by John et al., (1975). Fertility status
of N, P, K and S are interpreted as low,
medium and high and that of zinc, iron,
copper and manganese interpreted as
deficient, sufficient and excess by following
the criteria (Table 1).
Electrical conductivity
The electrical conductivity of surface soil
samples varied from 0.02 to 0.144 dSm-1 in
with a mean of 0.057 dSm-1 in Alanatha
cluster village. All the soil samples were
found to be normal in electric conductivity
(Fig. 2).
Preparation of soil fertility maps and
fertilizer recommendation
Organic carbon
The fertility maps showing nutrient status was
generated using the analytical data of
individual nutrient. The point data collected
using GPS was then transformed into polygon
data using krigging interpolation technique in
Arc GIS software.
The Organic carbon content of the surface
soils ranged from 0.15 to 0.93 per cent with
mean of 0.48 per cent in Alanatha cluster
village (Table 2). About 52.30 per cent area
was low, 37.30 per cent area was medium and
10.40 per cent area was high in organic
carbon content (Fig. 3). Low organic carbon
in the soil was due to low input of FYM and
crop residues as well as rapid rate of
decomposition due to high temperature.
The fertilizers were recommended based on
the soil test results to the selected farmers.
After harvest of the crop, yield observation
was recorded to study the impact of soil test
based fertilizer use in sustaining the yield.
The monocropping of cereals practiced by
many farmers might be one of the reasons for
low organic carbon in these areas. The high
content of organic carbon reported in some
parts of project villages might be due to
addition of organic matter and its subsequent
decomposition. These results were in
confirmatory with results reported by Waikar
et al., (2004).
Results and Discussion
Soil reaction
The soil reaction in surface soils of Alanatha
cluster village ranged from 4.70 to 6.61
(Table 2). The soil reaction of the surface soil
was acidic in nature and results also indicated
26.86 per cent area was moderately acidic
213
Int.J.Curr.Microbiol.App.Sci (2017) 6(5): 211-224
Table.1 Critical limits for different soil parameters
Parameter
pH
EC
Organic carbon
Available N
Available P2O5
Available K2O
Exchangeable Ca
Exchangeable Mg
Available S
Available Zn
Available B
Available Cu
Available Mn
Available Fe
Critical limits
Acidic – <6.5
Neutral - 6.5-7.5
Alkaline - >7.5
Normal - <0.8 dSm-1
Critical for sensitive crops- 0.8-1.6 dSm-1
Critical for salt tolerant crops- 1.6-2.5 dSm-1
Injurious for many crops- >2.5 dSm-1
Low - 0.5 %
Medium - 0.5–0.75%
High - > 0.75 %
Low - <280 kg/ha
Medium – 280–560 kg/ha
High - >560
Low - 22.5 kg/ha
Medium - 55.5–56 kg/ha
High - >56 kg/ha
Low - 141 kg/ha
Medium - 141-336 kg/ha
High - >336 kg/ha
Deficient - < 1.5 meq/100g
Sufficient - >1.5 meq/100g
Deficient - < 1.0 meq/100g
Sufficient - >1.0 meq/100g
Low - <10 ppm
Medium – 10–20 ppm
High - > 20 ppm
Low - < 0.5 ppm
Marginal - 0.5–0.75ppm
Adequate - 0.75–1.50 ppm
High - > 1.5 ppm
Low - <0.5 ppm
Medium - 0.5–1.0 ppm
High - > 1.0 ppm
Deficient - < 0.2 ppm
Sufficient - > 0.2 ppm
Deficient - < 1 ppm
Sufficient - > 1 ppm
Deficient - < 4.5 ppm
Sufficient - > 4.5 ppm
214
Int.J.Curr.Microbiol.App.Sci (2017) 6(5): 211-224
Table.2 Status of major nutrients in surface soil samples of Alanatha cluster village
pH
Range
Mean
4.7-6.61
5.48
EC
(dS m-1)
0.020.14
0.0567
Av. N
OC(%)
0.15-1.93
0.48
200.50
200.47
Av. P2O5
kg ha-1
12.8-261.5
78.0
Av. K2O
83-620
313.1
Table.3 Status of secondary and micronutrient nutrients in surface soil samples of Alanatha
cluster village
Excha
Ca
Ex cha Mg
Av.S
Fe
meq/100g
Cu
Zn
ppm
Range
1.3-6
0.2-4.50
2.08-58.17
0.471-34.36
0.655-5.223
0.515-1.940
Mean
2.94
1.78
28.28
9.490
1.711
0.958
Table.4 Comparisons between general recommendation and soil test based fertilizer
recommendation
Cropping
system
Groundnut
based cropping
system
Finger millet
based cropping
system
Normal
recommendation
(NPK kg ha-1)
Based on soil
test
(NPK kg ha-1)
Yield
(kg/ha)
Net returns
(Rs.)
BC
ratio
----
25:37.5:25
1163
35017
2.00
950
22237
1.63
2541
37934
2.48
1831
20184
1.78
25:50:25
---50:40:37.50
---62.50:27.50:50
----
Table.5 Comparison between quantity and cost of fertilizer under general recommendation and
soil test based fertilizer recommendation
Urea (kg)
DAP (kg)
MOP(kg)
Cost (Rs)
Finger millet (21.6 ha)
Groundnut (12.8 ha)
Soil test based UAS package
Soil test based UAS package
fertilizer
fertilizer
fertilizer
fertilizer
recommendation recommendation recommendation recommendation
1261
1613
461
153
1415
1879
1109
1382
1153
1350
464
532
59,268
75,471
36,548
42,512
Note: Urea- Rs 5.44/ kg, DAP- Rs 24 /kg and MOP- Rs 16 /kg
215
Int.J.Curr.Microbiol.App.Sci (2017) 6(5): 211-224
216
Int.J.Curr.Microbiol.App.Sci (2017) 6(5): 211-224
217
Int.J.Curr.Microbiol.App.Sci (2017) 6(5): 211-224
218
Int.J.Curr.Microbiol.App.Sci (2017) 6(5): 211-224
219
Int.J.Curr.Microbiol.App.Sci (2017) 6(5): 211-224
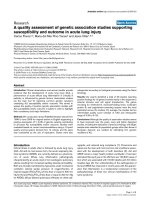
Available nitrogen
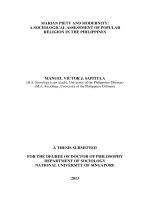
Exchangeable calcium and magnesium
The available nitrogen content of surface soil
samples in Alanatha cluster villages varied
from 88.2 to 403.20 kg ha-1 in the study area.
About 79.10 per cent area was low, 20.90 per
cent area was medium (Fig. 4). Similar to
organic carbon content, available nitrogen
was also low in these soils. The variation in N
content was related to soil management,
application of FYM and fertilizer to previous
crop (Ashok Kumar, 2000).
In surface soil samples of Alanatha cluster
village exchangeable calcium varied from 1.3
to 6.0 meq/100g with mean of 2.94meq/100g
respectively (Table 3). Soil samples were
found to be sufficient in exchangeable
calcium (Fig. 7).
Exchangeable magnesium content in surface
soil samples varied from 0.2 to 4.50
meq/100g in Alanatha cluster village (Table
3). In general about 97 per cent area was
found to be sufficient and 3.0 per cent area
was found to be deficient in exchangeable
magnesium (Fig. 8).
Available phosphrous
The available P2O5 ranged from 12.8 to 261.5
kg ha-1 in Alanatha cluster village (Table 2).
About 34.32 per cent area was medium and
62.68 per cent area was high in available
phosphorus content (Fig. 5). The commonly
used phosphorus fertilizer in the area is DAP.
The farmers tend to apply excess of DAP
fertilizer without knowing the crop
requirement and soil availability. Hence, in
most of the areas higher available phosphorus
was observed. Also variations in available P
content in soils are related with the intensity
of soil weathering or soil disturbance, the
degree of P- fixation with Fe and Ca and
continuous application of mineral P fertilizer
sources as indicated by Paulos (1996).
Available sulphur
The available sulphur status in surface soil
samples of Alanatha cluster village 2.0858.17 with mean of 28.28, about 26.87 per
cent was low in available sulphur, 25.36 per
cent area was medium in available sulphur
content and 47.77 per cent area was high in
available sulphur content (Fig. 9).
DTPA extractable micronutrients
The available iron in these soils varied from
0.471 to 34.36 mg kg-1 with mean of 9.490
mg kg-1 (Table 3). About 14.92 per cent area
was found to be deficient and 85.02 percent
area found to be sufficient in iron (Fig. 10).
This high Fe content in soil may be due to
presence of minerals like Feldspar, Magnetite,
Hematite and Limonite which together
constitute bulk of trap rock in these soils
(Vijaya Kumar et al., 2013).
Available potassium
The available potassium content of surface
soil samples varied from 83.00 to 620 K2O kg
ha-1 in Alanatha cluster village (Table 2).
About 4.47 per cent area was low in available
potassium content, 74.62 per cent area was
medium in available potassium content and
20.90 per cent area was high in available
potassium content (Fig. 6). As reported by
Patiram and Prasad (1991), the high K status
in these soils is associated with the presence
K rich minerals in soil.
The available manganese content found to be
ranged from 4.953 to 17.45 mg kg-1 with
mean of 12.729 mg kg-1 (Table 3). This
indicating 100 per cent area was found to be
sufficient (Fig. 11). The relative high content
of Mn in these soils could be due to the soils
220
Int.J.Curr.Microbiol.App.Sci (2017) 6(5): 211-224
derived from basaltic parent material which
contained higher ferromagnesium minerals.
Similar results were reported by Hundal et al.,
(2006).
The availability nitrogen in the project area
soils was low to medium, hence wherever
available nitrogen was low, 12.5 kg ha-1 of
additional dose of nitrogen fertilizer is
recommended along with recommended
fertilizer in case of finger millet and
groundnut (Table 2).
The available copper content in surface soil
samples varied from, 0.655 to 5.223 mg kg-1
with mean of 1.711 mg kg-1 (Table 3). It is
also indicating 100 per cent area was found to
be sufficient (Fig. 12). Brady and Weilm
(2002) indicated that the solubility,
availability and plant uptake of Cu is more
under acidic conditions (pH of 5.0 to 6.5).
Phosphorus fertilizer (DAP) is very expensive
and also nearly 62.68% area is high in
available P2O5 where it was suggested to
reduce the dose of P2O5 by 12.5 kg ha-1 from
recommended fertilizer for finger millet and
groundnut. In areas where P2O5 is low, in
addition to recommended dose, 12.5kg/ha
along with fertilizer was suggested in case of
finger millet and groundnut.
Available zinc content in these soils varied
from 0.515 to 1.940 mg kg-1 with mean of
0.958 mg kg-1 (Table 3). About 13.43 per cent
area was found to be deficient and 86.57
percent area was found to be sufficient in zinc
(Fig. 13). According to Krauskopf (1972) the
main source of micronutrient elements in
most soils is the parent material, from which
the soil is formed.
Nutrient management
recommendations
and
The cluster villages showed 20.90 per cent
area as high in available potassium content in
soil, hence, 12.5 kg ha-1 less potassium (K2O)
was recommended to reduce the luxury
consumption.
A total of 63.32 per cent area was found to be
high in available zinc status as most of the
farmers are already applying 12.5 kg ha-1
ZnSO4 to the crops. Wherever the soil is
showing lower availability of zinc, 12.5 kg ha-1
of ZnSO4 is recommended along with organic
manure and NPK in the cluster villages.
fertilizer
Application of fertilizers based on soil test
results would help in providing balanced
nutrients to crop, reduce excess application,
reduces over mining of nutrients from the soil
and also reduces the cost of cultivation.
Soil test based fertilizer recommendation
The soil test results were used for
management
of
soil
and
fertilizer
recommendation to various crops. The
organic carbon level of the soil in cluster
villages was low to medium. In order to
maintain organic carbon level in soil,
application of organic matter is recommended
through various sources like FYM,
vermicompost,
green
manuring
and
incorporation of crop residues into the soil so
as to improve soil physical, chemical and
biological properties of soils.
The fertilizer recommendation was made
based on the site specific nutrient status to all
the beneficiary farmers of operational
research project being operated in these
villages.
With the adoption of this
method, only required fertilizers are provided
to specific field and crop. In comparison with
the fertilizer recommendation made as per
UAS, Bengaluru package of practices. The
site specific nutrient recommendation
provides all the major nutrients based on the
availability of these nutrients in soil and crop
221
Int.J.Curr.Microbiol.App.Sci (2017) 6(5): 211-224
need. This has ensured providing only
required quantity of nutrients, balanced
nutrition and in some cases reducing fertilizer
cost.
The total quantity of fertilizers in terms of
urea, DAP and MOP based on soil test
fertilizer recommendation was 1261, 1415
and
1153
kg instead
of
general
recommendation of 1613, 1879 and 1350 kg
for 21.6 ha comprising of 46 farmers. There
was reduction in total cost of fertilizer up to
Rs 16,203. The comparison made with
farmers practice and site specific nutrient
recommendation
clearly
showed
the
advantage of providing balanced nutrition
which helped in the availability of nutrients to
crop for better growth and yield (Smaling and
Braun, 1996).
Groundnut based cropping system
The nutrient status in farmer’s field (Mr.
Madhuranaik) was medium in available
nitrogen and potassium and, high in available
phosphorus. The recommendation as per
UAS, Bengaluru, package of practice for
ground nut crop was 25:50:25 kg NPK per ha,
but, recommendation of fertilizer based on
soil test was 25:37.5:25 (DAP: 81.52, Urea:
22, MOP: 41.66 kg). With this, there is
reduction in cost of cultivation up to Rs 635
ha-1, also maintained the balanced nutrition
and increased the productivity of groundnut
with additional returns of 1135 kg ha-1.
If
the
soil
test
based
fertilizer
recommendation is adopted in total cultivated
area under finger millet (6.38 lakh ha) and
groundnut (5.08 lakh ha) in Karnataka then
we can reduce considerable cost on fertilizers
and provide balance nutrition to crop. It can
be concluded that, the geospatial technologies
helps in preparing soil nutrient status maps
which facilitates management of nutrients.
The total quantity of fertilizers in terms of
urea, DAP and MOP based on soil test
fertilizer recommendation was 461, 1109 and
464 kg instead of general recommendation of
153, 1382 and 532 kg for 12.8 ha comprising
of 20 farmers. There was reduction in total
cost of fertilizer up to Rs 5,964.
In the present study, soils of Alanatha cluster
village, Kanakapura, Ramanagara, Karnataka
were low to medium in soil organic carbon
content and available nitrogen. Available
phosphorus, available potassium and available
sulphur were low to high.
Fingermillet based cropping system
The nutrient status in Mr. Shivashankaraiah’s
field was low in available nitrogen, high
available phosphorus and medium available
potassium. The recommendation as per UAS,
Bengaluru, package of practice for finger
millet crop was 25:40:37.5 kg NPK per ha,
where as recommendation of fertilizer based
on soil test for finger millet was
67.5:27.5:37.5 kg ha-1 (DAP: 59.78, Urea:
12.3.34, MOP: 25 kg). The approach helped
in reducing the cost on fertilizers by Rs
420.58 ha-1, in addition to maintaining
balanced nutrition and increased the
productivity of fingermillet with additional
returns of 2542 kg ha-1.
Available iron, zinc was deficient to sufficient
whereas, available copper and manganese
were sufficient in these soils. Based on the
status of nutrients, fertilizer recommendations
were made which has resulted in enhancing
the yield and reducing the cost of fertilizers in
addition to proving balanced nutrients so as to
improve availability of nutrients to crop for
better growth and yield.
Acknowledgement
The authors greatly acknowledge the
contributions of scientists and staff of All
222
Int.J.Curr.Microbiol.App.Sci (2017) 6(5): 211-224
India Co-ordinated Research Project for
Dryland Agriculture, GKVK, Bangalore in
carrying out this study. Financial and
Technical assistance by Project Co-ordinating
Unit and CRIDA, Hyderabad is duly
acknowledged.
Mali, C.V. and P.D. Raut. 2001. Available
sulphur
and
physic-chemical
characteristics of oil seed dominated
area of Latur district. J. Maharashtra
Agri. Univ., 26: 117-118.
Moraghan, J.T. and H.J. Mascagni. 1991.
Environmental and soil factors affecting
micronutrient
deficiencies
and
toxicities.
In:
Micronutrients
in
agriculture, 371-425, R.J. Luxmoore
(Ed.), Soil Sci. Soc. Am.; Madison, WI,
U.S.A.
Page, A.L., R.H. Miller and D.R. Kendy.
1982. Methods of soil analysis, part-2.
Soil Sci. Society of America, Inc,
Publishers, Madison, Wisconsin, USA.
Partiram and R.N. Prasad. 1983. Release of
Non exchangeable potassium and its
relation to potassium supplying power
of soil. J. Indian Soc. Soil Sci., 39: 488493.
Paulos Dubale. 1993. Availability of
phosphorus in the coffee soils of
southwest Ethiopia Soil, Proceeding of
the 2nd Conference of the Ethiopian
Society of Soil Science (ESSS), 23-24
September 1993, Addis Ababa,
Ethiopia, pp. 119-129.
Ram, J., S.P. Singh and R. Gopal. 1999.
Available micronutrient in relation to
soil properties in the soils of
Bundelkhand. J. Maharashtra Agri.
Univ., 24: 112-114.
Smaling, E.M.A. and A.R. Braun. 1996. Soil
fertility research in Sub-Saharan Africa:
New dimensions, new challenges.
Communications in Soil Sci. Plant
Analysis, 27 (Nos. 3 and 4).
Subbiah, B.V. and G. Asija. 1956. A rapid
procedure for the estimation of
available nitrogen in soils. Curr. Sci.,
25: 259-260.
Vijaya kumar, M., G.V. Lakshmi, and P.
Madhuvani. 2013. Appraisal of soil
fertility status in salt affected soils of
ongole division, Prakasam district of
References
Ashok Kumar, S. 2000. Studies on soil
aggregation in Vertisols of North
Karnataka. M. Sc. (Agri.) Thesis, Univ.
Agric. Sci., Dharwad (India).
Brady, N.C. and R. Weilm. 2002. The nature
and properties of soils, 13th Ed.
Prentice Hall Inc., New Jersey, USA,
960p.
Foth, H.D. and B.G. Ellis. 1997. Soil fertility,
2nd Ed. Lewis CRC Press LLC., USA
290p.
Grace, P.R., J.M. Oades, H. Keith and T.W.
Hancock. 1995. Trends in wheat yields
and soil organic carbon in the
permanent rotation trial at the Waite
Agricultural Research Institute, South
Australia. Australian J. Experimental
Agri., 3: 857-864.
Hundal, H.S., Rajkumar, Dhanwindar Singh
and J.S. Machandra. 2006. Available
nutrient and heavy metal status of soils
of Punjab, North-west India. J. Indian
Society of Soil Sci., 54: 50-56.
Jackson, M.L. 1973. Soil Chemical Analysis.
Prentice Hall of India Private Limited,
New Delhi.
John, M.K., H.H. Chuah and J.H. Neufeld.
1975.
Analysis
of
micro-macro
nutrients in soil and plants., Anal. Lett.,
8: 559.
Krauskopf, K.B. 1972. Geochemistry of
micronutrients, Soil Sci. Soc. Amer.,
Madison, Wisconsin, pp. 7-35.
Lindsay, W.L. and W.A. Norvell. 1978.
Development of DTPA soil test for
zinc, iron, manganese and copper. Soil
Sci. Soc. America, 42: 421-428.
223
Int.J.Curr.Microbiol.App.Sci (2017) 6(5): 211-224
Andhra Pradesh. J. Indian Soc. Soil Sci.,
61: 333-340.
Waikar, S.L., G.U. Malewar, and S.D. More.
2004. Elemental composition of Humic
and Fulvic acid in soils of Marathwada
region of Maharashtra. J. Maharashtra
Agri. Univ., 29: 127-129.
Walkley, A.J. and C.A Black. 1934.
Estimation of soil organic carbon by the
chromic acid and titration method. Soil
Sci., 37: 29-38.
Yadav, R.L. and M.C. Meena. 2000.
Available micronutrient status and their
relationship with soil properties of
Degana soil series of Rajasthan. J
Indian Soc. Soil Sci., 57: 90-92.
How to cite this article:
Sathish, A., B.K. Ramachandrappa, K. Devaraja, M.S. Savitha, M.N. Thimme Gowda and
Prashanth, K.M. 2017. Assessment of Spatial Variability in Fertility Status and Nutrient
Recommendation in Alanatha Cluster Villages, Kanakapura Taluk, Ramanagara District,
Karnataka Using GIS Techniques. Int.J.Curr.Microbiol.App.Sci. 6(5): 211-224.
doi: />
224