Real-Time Digital Signal Processing - Chapter 3: DSP Fundamentals and Implementation Considerations
Bạn đang xem bản rút gọn của tài liệu. Xem và tải ngay bản đầy đủ của tài liệu tại đây (558.82 KB, 49 trang )
3
DSP Fundamentals
and Implementation
Considerations
The derivation of discrete-time systems is based on the assumption that the signal and
system parameters have infinite precision. However, most digital systems, filters, and
algorithms are implemented on digital hardware with finite wordlength. Therefore DSP
implementation with fixed-point hardware requires special attention because of the
potential quantization and arithmetic errors, as well as the possibility of overflow.
These effects must always be taken into consideration in DSP system design and
implementation.
This chapter presents some fundamental DSP concepts in time domain and practical
considerations for the implementation of digital filters and algorithms on DSP hard-
ware. Sections 3.1 and 3.2 briefly review basic time-domain DSP issues. Section 3.3
introduces probability and random processes, which are useful in analyzing the finite-
precision effects in the latter half of the chapter and adaptive filtering in Chapter 8. The
rigorous treatment of these subjects can be found in other DSP books listed in the
reference. Readers who are familiar with these DSP fundamentals should be able to skip
through some of these sections. However, most notations used throughout the book will
be defined in this chapter.
3.1 Digital Signals and Systems
In this section, we will define some widely used digital signals and simple DSP systems.
The purpose of this section is to provide the necessary background for understanding
the materials presented in subsequent sections and later chapters.
3.1.1 Elementary Digital Signals
There are several ways to describe signals. For example, signals encountered in com-
munications are classified as deterministic or random. Deterministic signals are used
Real-Time Digital Signal Processing. Sen M Kuo, Bob H Lee
Copyright # 2001 John Wiley & Sons Ltd
ISBNs: 0-470-84137-0 (Hardback); 0-470-84534-1 (Electronic)
for testing purposes and for mathematically describing certain phenomena. Random
signals are information-bearing signals such as speech. Some deterministic signals will be
introduced in this section, while random signals will be discussed in Section 3.3.
As discussed in Chapter 1, a digital signal is a sequence of numbers
fxn, ÀI< n < Ig, where n is the time index. The unit-impulse sequence, with
only one non-zero value at n 0, is defined as
dn
1, n 0
0, n T 0,
&
3:1:1
where dn is also called the Kronecker delta function. This unit-impulse sequence is
very useful for testing and analyzing the characteristics of DSP systems, which will be
discussed in Section 3.1.3.
The unit-step sequence is defined as
un
1, n ! 0
0, n < 0:
&
3:1:2
This signal is very convenient for describing a causal (or right-sided) signal xn
for n ! 0. Causal signals are the most commonly encountered signals in real-time
DSP systems.
Sinusoidal signals (sinusoids or sinewaves) are the most important sine (or cosine)
signals that can be expressed in a simple mathematical formula. They are also good
models for real-world signals. The analog sinewave can be expressed as
xtA sinVt fA sin2pft f, 3:1:3
where A is the amplitude of the sinewave,
V 2pf 3:1:4
is the frequency in radians per second (rad/s), f is the frequency in Hz, and f is the
phase-shift (initial phase at origin t 0) in radians.
When the analog sinewave defined in (3.1.3) is connected to the DSP system shown in
Figure 1.1, the digital signal x(n) available for the DSP hardware is the causal sinusoidal
signal
xnA sinVnT f, n 0, 1, ...,I
A sinVnT fun
A sin2pfnT fun,
3:1:5
where T is the sampling period in seconds. This causal sequence can also be expressed
as
xnA sin!n funA sin2pFn fun , 3:1:6
78
DSP FUNDAMENTALS AND IMPLEMENTATION CONSIDERATIONS
where
! VT
V
f
s
3:1:7
is the discrete-time frequency in radians per sample and
F fT
f
f
s
3:1:8
is the normalized frequency to its sampling frequency, f
s
, in cycles per sample.
The fundamental difference between describing the frequency of analog and digital
signals is summarized in Table 3.1. Analog signal sampling implies a mapping of an
infinite range of real-world frequency variable f (or V) into a finite range of discrete-
time frequency variable F (or !). The highest frequency in a digital signal is F 1=2 (or
! p) based on Shannon's sampling theorem defined in (1.2.3). Therefore the spectrum
of discrete-time (digital) signals is restricted to a limited range as shown in Table 3.1.
Note that some DSP books define the normalized frequency as F f
f
s
=2 with
frequency range À1 F 1.
Example 3.1: Generate 64 samples of a sine signal with A 2, f 1000 Hz, and
f
s
8 kHzusing MATLAB. Since F f =f
s
0:125, we have ! 2pF 0:25p.
From Equation (3.1.6), we need to generate xn2 sin!n), for n 0, 1, ..., 63.
These sinewave samples can be generated and plotted by the following MATLAB
script:
n [0:63];
omega 0.25*pi;
xn 2*sin(omega*n);
plot(n, xn);
3.1.2 Block Diagram Representation of Digital Systems
A DSP system (or algorithm) performs prescribed operations on digital signals. In some
applications, we view a DSP system as an operation performed on an input signal, x(n),
in order to produce an output signal, y(n), and express the general relationship between
x(n) and y(n)as
Table 3.1 Units, relationships, and range of four frequency variables
Variables Unit Relationship Range
V radians per second V 2pf ÀI < V < I
f cycles per second (Hz) f
F
T
ÀI < f < I
! radians per sample ! 2pF Àp ! p
F cycles per sample F
f
f
s
À
1
2
F
1
2
DIGITAL SIGNALS AND SYSTEMS
79
ynTxn, 3:1:9
where T denotes the computational process for transforming the input signal, x(n), into
the output signal, y(n). A block diagram of the DSP system defined in (3.1.9) is
illustrated in Figure 3.1.
The processing of digital signals can be described in terms of combinations of certain
fundamental operations on signals. These operations include addition (or subtraction),
multiplication, and time shift (or delay). A DSP system consists of the interconnection
of three basic elements ± adders, multipliers, and delay units.
Two signals, x
1
n and x
2
n, can be added as illustrated in Figure 3.2, where
ynx
1
nx
2
n3:1:10
is the adder output. With more than two inputs, the adder could be drawn as a multi-
input adder, but the additions are typically done two inputs at a time in digital hard-
ware. The addition operation of Equation (3.1.10) can be implemented as the following
C55x code using direct addressing mode:
mov @x1n, AC0 ; AC0 x1(n)
add @x2n, AC0 ; AC0 x1(n)x2(n) y(n)
A given signal can be multiplied by a constant, a, as illustrated in Figure 3.3, where
x(n) is the multiplier input, a represents the multiplier coefficient, and
ynaxn3:1:11
x(n)
DSP system
T [ ]
y(n) = T [x(n)]
Figure 3.1 Block diagram of a DSP system
x
1
(n) x
1
(n)
x
2
(n) y(n) x
2
(n) y(n)
+
+
Σ
or
Figure 3.2 Block diagram of an adder
x(n) y(n)
a
or
x(n) y(n)
a
Figure 3.3 Block diagram of a multiplier
80
DSP FUNDAMENTALS AND IMPLEMENTATION CONSIDERATIONS
x(n) y(n) = x(n−1)
z
−1
Figure 3.4 Block diagram of a unit delay
is the multiplier's output. The multiply operation of equation (3.1.11) can be imple-
mented by the following C55x code using indirect addressing mode:
amov #alpha, XAR1 ; AR1 points to alpha ()
amov #xn, XAR2 ; AR2 points to x(n)
mpy *AR1, *AR2, AC0 ; AC0 *x(n) y(n)
The sequence {xn} can be shifted (delayed) in time by one sampling period, T,as
illustrated in Figure 3.4. The box labeled z
À1
represents the unit delay, x(n) is the input
signal, and
ynxn À 13:1:12
is the output signal, which is the input signal delayed by one unit (a sampling period).
In fact, the signal xn À 1 is actually the stored signal x(n) one sampling period
(T seconds) before the current time. Therefore the delay unit is very easy to implement
in a digital system, but is difficult to implement in an analog system. A delay by more
than one unit can be implemented by cascading several delay units in a row. Therefore
an L-unit delay requires L memory locations configured as a first-in first-out buffer,
which can also be implemented as a circular buffer (will be discussed in Chapter 5) in
memory.
There are several ways to implement delay operations on the TMS320C55x. The
following code uses a delay instruction to move the contents of the addressed data
memory location into the next higher address location:
amov #xn, XAR1 ; AR1 points to x(n)
delay *AR1 ; Contents of x(n)is copied to x(nÀ1)
These three basic building blocks can be connected to form a block diagram repre-
sentation of a DSP system. The input±output (I/O) description of a DSP system consists
of mathematical expressions with addition, multiplication, and delays, which explicitly
define the relationship between the input and output signals. DSP algorithms are closely
related to block diagram realizations of the I/O difference equations. For example,
consider a simple DSP system described by the difference equation
ynaxnaxn À 1: 3:1:13
The block diagram of the system using the three basic building blocks is sketched in
Figure 3.5(a). Note that the difference equation (3.1.13) and the block diagram show
exactly how the output signal y(n) is computed in the DSP system for a given input
signal, x(n).
The DSP algorithm shown in Figure 3.5(a) requires two multiplications and one
addition to compute the output sample y(n). A simple algebraic simplification may
DIGITAL SIGNALS AND SYSTEMS
81
y(n)
Σ
+
+
a
a
(a)
y(n)
Σ
+
+
a
x(n)
x(n−1)
x(n)
x(n−1)
z
−1
z
−1
(b)
Figure 3.5 Block diagrams of DSP systems: (a) direct realization described in (3.1.13), and
(b) simplified implementation given in (3.1.14)
be used to reduce computational requirements. For example, (3.1.13) can be rewritten
as
ynaxnxn À 1: 3:1:14
The block diagram implementation of this difference equation is illustrated in Figure
3.5(b), where only one multiplication is required. This example shows that with careful
design (or optimization), the complexity of the system (or algorithm) can be further
reduced.
The C55x implementation of (3.1.14) can be written as:
amov #alpha, XAR1 ; AR1 points to
amov #temp, XAR2 ; AR2 points to temp
mov *(x1n), AC0 ; AC0 x1(n)
add *(x2n), AC0 ; AC0 x1(n)x2(n)
mov AC0, *AR2 ; Temp x1(n)x2(n), pointedby AR2
mpy *AR1, *AR2, AC1 ; AC1
Ã
[x1(n)x2(n)]
Equation (3.1.14) can also be implemented as:
amov #x1n, XAR1 ; AR1 points to x1(n)
amov #x2n, XAR2 ; AR2 points to x2(n)
amov #alpha, XAR3 ; AR3 points to
mpy *AR1, *AR3, AC1 ; AC1
Ã
x1(n)
mac *AR2, *AR3, AC1 ; AC1
Ã
x1(n)
Ã
x2(n)
When the multiplier coefficient a is a number with a base of 2 such as 0.25 (1/4), we
can use shift operation instead of multiplication. The following example uses the
absolute addressing mode:
mov *(x1n)(#-2, AC0 ; AC0 0.25*x1(n)
add *(x2n)(#-2, AC0 ; AC0 0.25*x1(n) 0.25*x2(n)
where the right shift option, (#-2, shifts the content of x1n and x2n to the right by 2
bits (equivalent to dividing it by 4) before they are used.
82
DSP FUNDAMENTALS AND IMPLEMENTATION CONSIDERATIONS
3.1.3 Impulse Response of Digital Systems
If the input signal to the DSP system is the unit-impulse sequence dn defined in (3.1.1),
then the output signal, h(n), is called the impulse response of the system. The impulse
response plays a very important role in the study of DSP systems. For example, consider
a digital system with the I/O equation
ynb
0
xnb
1
xn À 1b
2
xn À 2: 3:1:15
The impulse response of the system can be obtained by applying the unit-impulse
sequence dn to the input of the system. The outputs are the impulse response coeffi-
cients computed as follows:
h0y0b
0
Á 1 b
1
Á 0 b
2
Á 0 b
0
h1y1b
0
Á 0 b
1
Á 1 b
2
Á 0 b
1
h2y2b
0
Á 0 b
1
Á 0 b
2
Á 1 b
2
h3y3b
0
Á 0 b
1
Á 0 b
2
Á 0 0
...
Therefore the impulse response of the system defined in (3.1.15) is fb
0
, b
1
, b
2
,0,0, ...g.
The I/O equation given in (3.1.15) can be generalized as the difference equation with
L parameters, expressed as
ynb
0
xnb
1
xn À 1ÁÁÁb
LÀ1
xn À L 1
LÀ1
l0
b
l
xn À l
: 3:1:16
Substituting xndn into (3.1.16), the output is the impulse response expressed
as
À 1
hn
LÀ1
l0
b
l
dn À l
b
n
n =0,1,..., L
0 otherwise.
&
3:1:17
Therefore the length of the impulse response is L for the difference equation defined in
(3.1.16). Such a system is called a finite impulse response (FIR) system (or filter). The
impulse response coefficients, b
l
, l 0, 1, ..., L À 1, are called filter coefficients
(weights or taps). The FIR filter coefficients are identical to the impulse response
coefficients. Table 3.2 shows the relationship of the FIR filter impulse response h(n)
and its coefficients b
l
.
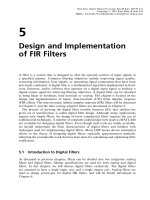
3.2 Introduction to Digital Filters
As shown in (3.1.17), the system described in (3.1.16) has a finite number of non-zero
impulse response coefficients b
l
, l 0, 1, ..., L À 1. The signal-flow diagram of the
INTRODUCTION TO DIGITAL FILTERS
83
Table 3.2 Relationship of impulse response and coefficients of an FIR filter
b
l
b
0
b
1
b
2
... b
LÀ1
nxn xn À 1 xn À 2 ... xn À L 1 ynhn
01 0 0 ... 0 h0b
0
10 1 0 ... 0 h1b
1
20 0 1 ... 0 h2b
2
... ... ... ... ... ... ...
L À 10 0 0 ... 1 hL À 1b
LÀ1
L 00 0... 00
y(n)
Σ
+
+
z
−1
z
−1
b
1
b
0
x(n)
x(n−1)
+
x(n−L+1)
b
L−1
Figure 3.6 Detailed signal-flow diagram of FIR filter
system described by the I/O Equation (3.1.16) is illustrated in Figure 3.6. The string
of z
À1
functions is called a tapped-delay-line, as each z
À1
corresponds to a delay of
one sampling period. The parameter, L, is the order (length) of the FIR filter. The
design and implementation of FIR filters (transversal filters) will be discussed in
Chapter 5.
3.2.1 FIRFilters and Power Estimators
The moving (running) average filter is a simple example of an FIR filter. Averaging is
used whenever data fluctuates and must be smoothed prior to interpretation. Consider
an L-point moving-average filter defined as
yn
1
L
xnxn À 1ÁÁÁxn À L 1
1
L
LÀ1
l0
xn À l,
3:2:1
where each output signal yn is the average of L consecutive input signal samples. The
summation operation that adds all samples of xn between 1 and L can be implemented
using the MATLAB statement:
yn sum(xn(1:L));
84
DSP FUNDAMENTALS AND IMPLEMENTATION CONSIDERATIONS
Implementation of (3.2.1) requires L À 1 additions and L memory locations for
storing signal sequence xn, xn À 1, ..., xn À L 1 in a memory buffer. As illus-
trated in Figure 3.7, the signal samples used to compute the output signal at time n are
L samples included in the window at time n. These samples are almost the same as those
samples used for the previous window at time n À 1 to compute yn À 1, except that the
oldest sample xn À L of the window at time n À 1 is replaced by the newest sample
xn of the window at time n. Thus (3.2.1) can be computed as
ynyn À 1
1
L
xnÀxn À L: 3:2:2
Therefore the averaged signal, yn, can be computed recursively as expressed
in (3.2.2). This recursive equation can be realized by using only two additions.
However, we need L 1 memory locations for keeping L 1 signal samples
fxnxn À 1ÁÁÁxn À Lg.
The following C5xx assembly code illustrates the implementation of a moving-
average filter of L 8 based on Equation (3.2.2):
L .set 8 ; Order of filter
xin .usect "indata", 1
xbuffer .usect "indata", L ; Length of buffer
y .usect "outdata", 2,1,1 ; Long-word format
amov #xbufferLÀ1, XAR3 ; AR3 points to endof x buffer
amov #xbufferLÀ2, XAR2 ; AR2 points to next sample
mov dbl(*(y)), AC1 ; AC1 y(nÀ1)in long format
mov *(xin), AC0 ; AC0 x(n)
sub *AR3, AC0 ; AC0 x(n) À x(n±L)
add AC0, #-3, AC1 ; AC1 y(n±1) 1/L[x(n)±x(n±L)]
mov AC1, dbl(*(y)) ; y(n) AC1
rpt # (LÀ1) ; Update the tapped-delay-line
mov *AR2À, *AR3À ; X(n±1) x(n)
mov *(xin), AC0 ; Update the newest sample x(n)
mov AC0, *AR3 ; X(n) input xin
The strength of a digital signal may be expressed in terms of peak value, energy, and
power. The peak value of deterministic signals is the maximum absolute value of the
signal. That is,
M
x
max
n
fjxnjg: 3:2:3
Window at time n
n−L
Time
n−1
n−L+1
n
Window at time n−1
Figure 3.7 Time windows at current time n and previous time n À 1
INTRODUCTION TO DIGITAL FILTERS
85
The maximum value of the array xn can be found using the MATLAB function
Mx max(xn);
The energy of the signal xn is defined as
E
x
n
jxnj
2
: 3:2:4
The energy of a real-valued xn can be calculated by the MATLAB statement:
Ex sum(abs(xn).^ 2);
Periodic signals and random processes have infinite energy. For such signals, an
appropriate definition of strength is power. The power of signal xn is defined as
P
x
lim
L3I
1
L
LÀ1
n0
jxnj
2
: 3:2:5
If xn is a periodic signal, we have
xnxn kL, 3:2:6
where k is an integer and L is the period in samples. Any one period of L samples
completely defines a periodic signal. From Figure 3.7, the power of xn can be
computed by
P
x
1
L
n
lnÀL1
jxlj
2
1
L
LÀ1
l0
jxn À lj
2
: 3:2:7
For example, a real-valued sinewave of amplitude A defined in (3.1.6) has the power
P
x
0:5A
2
.
In most real-time applications, the power estimate of real-valued signals at time n can
be expressed as
^
P
x
n
1
L
LÀ1
l0
x
2
n À l: 3:2:8
Note that this power estimate uses L samples from the most recent sample at time n
back to the oldest sample at time nÀ L 1, as shown in Figure 3.7. Following the
derivation of (3.2.2), we have the recursive power estimator
^
P
x
n
^
P
x
n À 1
1
L
x
2
nÀx
2
n À L: 3:2:9
86
DSP FUNDAMENTALS AND IMPLEMENTATION CONSIDERATIONS
To further simplify the algorithm, we assume L is large enough so that
x
2
n À L%
^
P
x
n À 1 from a statistical point of view. Thus Equation (3.2.9) can be
further simplified to
^
P
x
n% 1À
1
L
^
P
x
n À 1
1
L
x
2
n, 3:2:10
or
^
P
x
n%1 À a
^
P
x
n À 1ax
2
n, 3:2:11a
where
a
1
L
: 3:2:11b
This is the most effective and widely used recursive algorithm for power estimation
because only three multiplication operations and two memory locations are needed. For
example, (3.2.11a) can be implemented by the C statement
pxn (1.0-alpha)*pxn alpha*xn*xn;
where alpha 1=L as defined in (3.2.11b). This C statement shows that we need three
multiplications and only two memory locations for xn and pxn.
For stationary signals, a larger L (longer window) or smaller a can be used for
obtaining a better average. However, a smaller L (shorter window) should be used
for non-stationary signals for better results. In many real-time applications, the square
of signal x
2
n used in (3.2.10) and (3.2.11a) can be replaced with its absolute value jxnj
in order to reduce further computation. This efficient power estimator will be further
analyzed in Chapter 4 using the z-transform.
3.2.2 Response of Linear Systems
As discussed in Section 3.1.3, a digital system can be completely characterized by its
impulse response hn. Consider a digital system illustrated in Figure 3.8, where xn is
the input signal and yn is the output signal. If the impulse response of the system is
hn, the output of the system can be expressed as
ynxnÃhn
I
kÀI
xkhn À k
I
kÀI
hkxn À k, 3:2:12
x(n) y(n) = x(n)∗h(n)
h(n)
Figure 3.8 A simple linear system expressed in time domain
INTRODUCTION TO DIGITAL FILTERS
87
where * denotes the linear convolution operation and the operation defined in (3.2.12) is
called the convolution sum. The input signal, xn, is convoluted with the impulse
response, hn, in order to yield the output, yn. We will discuss the computation of
linear convolution in detail in Chapter 5.
As shown in (3.2.12), the I/O description of a DSP system consists of mathematical
expressions, which define the relationship between the input and output signals. The
exact internal structure of the system is either unknown or ignored. The only way to
interact with the system is by using its input and output terminals as shown in Figure
3.8. The system is assumed to be a `black box'. This block diagram representation is a
very effective way to depict complicated DSP systems.
A digital system is called the causal system if and only if
hn0, n < 0: 3:2:13
A causal system is one that does not provide a response prior to input application. For a
causal system, the limits on the summation of the Equation (3.2.12) can be modified to
reflect this restriction as
yn
I
k0
hkxn À k: 3:2:14
Thus the output signal yn of a causal system at time n depends only on present and
past input signals, and does not depend on future input signals.
Consider a causal system that has a finite impulse response of length L. That is,
hn
0, n < 0
b
n
,0 n L À 1
0 n ! L .
@
3:2:15
Substituting this equation into (3.2.14), the output signal can be expressed identically to
the Equation (3.1.16). Therefore the FIR filter output can be calculated as the input
sequence convolutes with the coefficients (or impulse response) of the filter.
3.2.3 IIRFilters
A digital filter can be classified as either an FIR filter or an infinite impulse response
(IIR) filter, depending on whether or not the impulse response of the filter is of
finite or infinite duration. Consider the I/O difference equation of the digital system
expressed as
ynbxnÀayn À 1, 3:2:16
where each output signal yn is dependent on the current input signal xn and the
previous output signal yn À 1. Assuming that the system is causal, i.e., yn0 for
n < 0 and let xndn. The output signals yn are computed as
88
DSP FUNDAMENTALS AND IMPLEMENTATION CONSIDERATIONS
y0bx0ÀayÀ1b,
y1bx1Àay0Àay0Àab,
y2bx2Àay1Àay1a
2
b,
...
In general, we have
hnynÀ1
n
a
n
b, n 0, 1, 2, ...,I: 3:2:17
This system has infinite impulse response hn if the coefficients a and b are non-zero. This
system is called an IIR system (or filter). In theory, we can calculate an IIR filter output
yn using either the convolution equation (3.2.14) or the I/O difference equation (3.2.16).
However, it is not computationally feasible using (3.2.14) for the impulse response hn
given in (3.2.17), because we cannot deal with an infinite number of impulse response
coefficients. Therefore we must use an I/O difference equation such as the one defined in
(3.2.16) for computing the IIR filter output in practical applications.
The I/O equation of the IIR system given in (3.2.16) can be generalized with the
difference equation
ynb
0
xnb
1
xn À 1ÁÁÁb
LÀ1
xn À L 1Àa
1
yn À 1ÀÁÁÁÀa
M
yn À M
LÀ1
l0
b
l
xn À lÀ
M
m1
a
m
yn À m: 3:2:18
This IIR system is represented by a set of feedforward coefficients fb
l
, l 0,
1, ..., L À 1g and a set of feedback coefficients fa
m
, m 1, 2, ..., Mg. Since the
outputs are fed back and combined with the weighted inputs, this system is an example
of the general class of feedback systems. Note that when all a
m
are zero, Equation
(3.2.18) is identical to (3.1.16). Therefore an FIR filter is a special case of an IIR filter
without feedback coefficients. An FIR filter is also called a non-recursive filter.
The difference equation of IIR filters given in (3.2.18) can be implemented using the
MATLAB function filter as follows:
yn filter(b, a, xn);
where the vector b contains feedforward coefficients fb
l
, l 0, 1, ..., L À 1g and the
vector a contains feedback coefficient fa
m
, m 1, 2, ..., Mg. The signal vectors, xn
and yn, are the input and output buffers of the system. The FIR filter defined in (3.1.16)
can be implemented using MATLAB as
yn filter(b, 1, xn);
Assuming that L is large enough so that the oldest sample xn À L can be approxi-
mated using its average, yn À 1. The moving-average filter defined in (3.2.2) can be
simplified as
yn 1À
1
L
yn À 1
1
L
xn1 À ayn À 1axn, 3:2:19
INTRODUCTION TO DIGITAL FILTERS
89
where a is defined in (3.2.11b). This is a simple first-order IIR filter. Design and
implementation of IIR filters will be further discussed in Chapter 6.
3.3 Introduction to Random Variables
In Section 3.1, we treat signals as deterministic, which are known exactly and repeatable
(such as a sinewave). However, the signals encountered in practice are often random
signals such as speech and interference (noise). These random (stochastic) processes can
be described at best by certain probability concepts. In this section, we will briefly
introduce the concept of probability, followed by random variables and random signal
processing.
3.3.1 Review of Probability and Random Variables
An experiment that has at least two possible outcomes is fundamental to the concept of
probability. The set of all possible outcomes in any given experiment is called the sample
space S. An event A is defined as a subset of the sample space S. The probability of
event A is denoted by P(A). Letting A be any event defined on a sample space S,wehave
0 PA 1 3:3:1
and
PS1Á3:3:2
For example, consider the experiment of rolling of a fair die N times (N 3I), we have
S f1 A 6g and PA1=6.
A random variable, x, is defined as a function that maps all elements from the sample
space S into points on the real line. A random variable is a number whose value depends
on the outcome of an experiment. Given an experiment defined by a sample space with
elements A, we assign to every A a real number x xA according to certain rules.
Consider the rolling of a fair die N times and assign an integer number to each face of a die,
we have a discrete random variable that can be any one of the discrete values from 1 to 6.
The cumulative probability distribution function of a random variable x is defined as
FXPx X, 3:3:3
where X is a real number ranging from ÀI to I, and Px X is the probability of
fx Xg. Some properties of F(X) are summarized as follows:
FÀI 0, 3:3:4a
FI 1, 3:3:4b
0 FX 1, 3:3:4c
90
DSP FUNDAMENTALS AND IMPLEMENTATION CONSIDERATIONS
FX
1
FX
2
if X
1
X
2
, 3:3:4d
PX
1
< x X
2
FX
2
ÀFX
1
: 3:3:4e
The probability density function of a random variable x is defined as
fX
dFX
dX
3:3:5
if the derivative exists. Some properties of f(X) are summarized as follows:
fX!0 for all X 3:3:6a
PÀI x I
I
ÀI
fXdX 1, 3:3:6b
FX
X
ÀI
fxdx, 3:3:6c
PX
1
< x X
2
FX
2
ÀFX
1
X
2
X
1
fXdX: 3:3:6d
Note that both F(X ) and f(X ) are non-negative functions. The knowledge of these two
functions completely defines the random variable x.
Example 3.2: Consider a random variable x that has a probability density function
fX
0, x < X
1
or x > X
2
a, X
1
x X
2
,
&
which is uniformly distributed between X
1
and X
2
. The constant value a can be
computed by using (3.3.6b). That is,
I
ÀI
fXdX
X
2
X
1
a Á dX aX
2
À X
1
1:
Thus we have
a
1
X
2
À X
1
:
If a random variable x is equally likely to take on any value between the two limits X
1
and X
2
and cannot assume any value outside that range, it is said to be uniformly
distributed in the range [X
1
, X
2
]. As shown in Figure 3.9, a uniform density function is
defined as
INTRODUCTION TO RANDOM VARIABLES
91
f (X)
X
0 X
1
X
2
1
X
2
−X
1
Figure 3.9 A uniform density function
fX
1
X
2
À X
1
, X
1
X X
2
0, otherwise.
@
3:3:7
This uniform density function will be used to analyze quantization noise in Section 3.4.
If x is a discrete random variable that can take on any one of the discrete values
X
i
, i 1, 2, ... as the result of an experiment, we define
p
i
Px X
i
: 3:3:8
3.3.2 Operations on Random Variables
We can use certain statistics associated with random variables. These statistics
areoften more meaningful from a physical viewpoint than the probability density
function. For example, the mean and the variance are used to reveal sufficient
features of random variables. The mean (expected value) of a random variable x is
defined as
m
x
Ex
I
ÀI
XfXdX, continuous-time case
i
X
i
p
i
, discrete-time case,
3:3:9
where E [Á] denotes the expectation operation (ensemble averaging).
The expectation is a linear operation. Two useful properties of the expectation
operation are Eaa and EaxaEx, where a is a constant. If Ex0, x is the
zero-mean random variable. The MATLAB function mean calculates the mean value.
For example, the statement
mx mean(x);
computes the mean value of the elements in the vector x.
In (3.3.9), the sum is taken over all possible values of x. The mean m
x
defines the
level about which the random process x fluctuates. For example, consider the rolling
of a die N times (N 3I), the probability of outcomes is listed in Table 3.3, as
follows:
92
DSP FUNDAMENTALS AND IMPLEMENTATION CONSIDERATIONS
Table 3.3 Probability of rolling a die
X
i
123456
p
i
1/6 1/6 1/6 1/6 1/6 1/6
The mean of outcomes can be computed as
m
x
6
i1
p
i
X
i
1
6
1 2 3 4 5 63:5:
The variance of x, which is a measure of the spread about the mean, is defined as
s
2
x
Ex À m
x
2
I
ÀI
X À m
x
2
fXdX, continuous-time case
i
p
i
X
i
À m
x
2
, discrete-time case,
3:3:10
where x À m
x
is the deviation of x from the mean value m
x
. The mean of the squared
deviation indicates the average dispersion of the distribution about the mean m
x
. The
positive square root s
x
of variance is called the standard deviation of x. The MATLAB
function std calculates standard deviation. The statement
s std(x);
computes the standard deviation of the elements in the vector x.
The variance defined in (3.3.10) can be expressed as
s
2
x
Ex À m
x
2
Ex
2
À 2xm
x
m
2
x
Ex
2
À2m
x
Exm
2
x
Ex
2
Àm
2
x
:
3:3:11
We call Ex
2
the mean-square value of x. Thus the variance is the difference between
the mean-square value and the square of the mean value. That is, the variance is the
expected value of the square of the random variable after the mean has been removed.
The expected value of the square of a random variable is equivalent to the notation of
power. If the mean value is equal to 0, then the variance is equal to the mean-square
value. For a zero-mean random variable x, i.e., m
x
0, we have
s
2
x
Ex
2
P
x
, 3:3:12
which is the power of x. In addition, if y ax where a is a constant, it can be shown that
s
2
y
a
2
s
2
x
. It can also be shown (see exercise problem) that P
x
m
2
x
s
2
x
if m
x
T 0.
Consider a uniform density function as given in (3.3.7). The mean of the function can
be computed by
INTRODUCTION TO RANDOM VARIABLES
93
m
x
Ex
I
ÀI
XfXdX
1
X
2
À X
1
X
2
X
1
XdX
X
2
X
1
2
:
3:3:13
The variance of the function is
s
2
x
Ex
2
Àm
2
x
I
ÀI
X
2
fXdX À m
2
x
1
X
2
À X
1
X
2
X
1
X
2
dX À m
2
x
1
X
2
À X
1
:
X
3
2
À X
3
1
3
À m
2
x
X
2
2
X
1
X
2
X
2
1
3
À
X
2
X
1
2
4
X
2
À X
1
2
12
:
3:3:14
In general, if x is a uniformly distributed random variable in the interval (ÀD, D), the
mean is 0 (m
x
0) and the variance is s
2
x
D
2
=3.
Example 3.3: The MATLAB function rand generates pseudo-random numbers
uniformly distributed in the interval (0, 1). From Equation (3.3.13), the mean of
the generated pseudo-random numbers is 0.5. From (3.3.14), the variance is
computed as 1/12. To generate zero-mean random numbers, we subtract 0.5
from every generated number. The numbers are now distributed in the interval
(À0.5, 0.5). To make these pseudo-random numbers with unit-variance, i.e.,
s
2
x
D
2
=3 1, the generated numbers must be equally distributed in the interval
(À
3
p
,
3
p
). Therefore we have to multiply 2
3
p
to every generated number that
was subtracted by 0.5. The following MATLAB statement can be used to generate
the uniformly distributed random numbers with mean 0 and variance 1:
xn 2*sqrt(3)*(randÀ 0:5);
For two random variables x and y, we have
Ex yExEy, 3:3:15
i.e., the mean value of the sum of random variables equals the sum of mean values. The
correlation of x and y is denoted as E[xy]. In general, Exy T ExÁEy. However, if x
and y are uncorrelated, then the correlation can be written in the form
ExyExÁEy: 3:3:16
Statistical independence of x and y is sufficient to guarantee that they are uncorrelated.
If the random variables x
i
are independent with the mean m
i
and variance s
2
i
, the
random variable y is defined as
y x
1
x
2
ÁÁÁx
N
N
i1
x
i
: 3:3:17
94
DSP FUNDAMENTALS AND IMPLEMENTATION CONSIDERATIONS
m
y
y
f(y)
1/s
y
√2p
Figure 3.10 Probability density function of Gaussian random variable
The probability density function f(Y ) becomes a Gaussian (normal) distribution func-
tion (normal curve) as N 3I. That is,
fY
1
s
y
2p
p
e
ÀyÀm
y
2
=2s
2
y
1
s
y
2p
p
e
À
1
2
y À m
y
s
y
2
45
, 3:3:18
where m
y
N
i1
m
i
and s
y
N
i1
s
2
i
q
. A graphical representation of the probability
density function defined in (3.3.18) is illustrated in Figure 3.10.
The central limit theorem defined in (3.3.17) is useful in generating a Gaussian
random variable from a uniformly distributed random variable using N ! 12. The
Gaussian random variable is frequently used in communication theory. The MATLAB
function randn generates pseudo-random numbers normally distributed with mean 0
and variance 1.
3.4 Fixed-Point Representation and Arithmetic
The basic element in digital hardware is the two-state (binary) device that contains one
bit of information. A register (or memory unit) containing B bits of information is called
a B-bit word. There are several different methods of representing numbers and carrying
out arithmetic operations. In fixed-point arithmetic, the binary point has a fixed loca-
tion in the register. In floating-point arithmetic, it does not. In general, floating-point
processors are more expensive and slower than fixed-point devices. In this book, we
focus on widely used fixed-point implementations.
A B-bit fixed-point number can be interpreted as either an integer or a fractional
number. It is better to limit the fixed-point representation to fractional numbers because
it is difficult to reduce the number of bits representing an integer. In fixed-point
fractional implementation, it is common to assume that the data is properly scaled so
that their values lie between À1 and 1. When multiplying these normalized fractional
numbers, the result (product) will always be less than one.
A given fractional number x has a fixed-point representation as illustrated in
Figure 3.11. In the figure, M is the number of data (magnitude) bits. The most
significant bit
FIXED-POINT REPRESENTATION AND ARITHMETIC
95