Kinetic and equilibrium study on the adsorption of methylene blue from aqueous solution onto coffee husk activated carbon (Hnue Journal Of Science)
Bạn đang xem bản rút gọn của tài liệu. Xem và tải ngay bản đầy đủ của tài liệu tại đây (920.39 KB, 14 trang )
HNUE JOURNAL OF SCIENCE
DOI: 10.18173/2354-1059.2020-0036
Natural Sciences 2020, Volume 65, Issue 6, pp. 116-129
This paper is available online at
KINETIC AND EQUILIBRIUM STUDY ON THE ADSORPTION
OF METHYLENE BLUE FROM AQUEOUS SOLUTION
ONTO COFFEE HUSK ACTIVATED CARBON
Ta Huu Son1, Le Van Khu1, Luong Thi Thu Thuy1, Vu Thi Huong1
Le Huu Dung1 and Nguyen Dinh Hung2
1
Faculty of Chemistry, Hanoi National University of Education
2
Vinh Phuc Gifted High School
Abstract. In this study, the adsorption kinetics and equilibrium of methylene blue
from aqueous solution onto activated carbon derived from coffee husk using one
step ZnCl2 activation were investigated. The influence of initial methylene blue
concentration and temperature were evaluated employing the batch experiment. To
the experimental data, different kinetics and isotherm models were applied, finding
that the best fitted is the pseudo-second-order equation and the Redlich-Peterson
model, respectively. The mechanism of the adsorption was examined using the
Weber and Morris model, and the obtained results suggested that the intra-particle
diffusion was not the only rate-controlling step. The scale-up system was also
designed for 50 - 90% methylene blue removal from an initial concentration of
100 mg L1 at 30 C.
Keywords: activated carbon, methylene blue, adsorption kinetics, equilibrium
of adsorption.
1. Introduction
Currently, water pollution with organic compounds is becoming an increasing
concern issue by scientists and society. Dyes are used in many industries for dyeing,
printing, painting, food coloring, and reported to cause eye burn, vomiting, cyanosis,
jaundice, cancer, allergy, mutation, etc. Numerous techniques, including biological
treatment, adsorption, filtration, coagulation, photodegradation, etc, are being
developed. Among these methods, adsorption is a non-toxic, cost-effectiveness
approach, especially at low adsorbate concentration or large scale applications [1].
Various adsorbents have been used for dye elimination from wastewater, such as perlite [2],
orange peel [3], sugar beet pulp activated carbon [4], and kaolin [5]. Apart from general
requirements for adsorbents, namely high mechanical and chemical stability, large
specific surface area, a large number of functional groups, an effective adsorbent for dye
Received June 12, 2020. Revised June 23, 2020. Accepted June 29, 2020.
Contact Le Van Khu, e-mail address:
116
Kinetic and equilibrium study on the adsorption of methylene blue from aqueous solution…
removal should have a large number of mesopores that facilitating large dye
molecules transport.
In this study, activated carbon (AC) from coffee husks using ZnCl 2 activation was
used as adsorbent since it has a great number of mesopores, which is a proper adsorbent
for dye molecules removal. Methylene blue (MB) is used as an adsorbate owing to the
universal acceptance as a standard model of cationic dye. This study aims to evaluate
the removal of MB from aqueous solution using coffee husk AC. Adsorption process
was carried out by varying initial concentration of MB, contact time, and temperature to
investigate the kinetics and equilibrium of the adsorption process.
2. Content
2.1. Experimental procedure
2.1.1. Adsorbent and adsorbate
Activated carbon developed from coffee husk by one step ZnCl2 activation was
used as adsorbent. The preparation of AC is summarized as following: Coffee husks
(Arabica) were collected from a coffee mill in Son La Province of Vietnam. These were
washed, dried, grounded, and finally sieved to fractions of 1.0 mm average particle size.
The prepared coffee husk (CHF) was homogeneously mixed with ZnCl 2 (CAS: 764685-7, purity 98%, Xilong Chemical Co. Ltd, China, ZnCl2/CFH mass ratio equal to 3) at
100 oC for 1 h. It was heated at 100 oC for 1 h and then oven-dried at 120 oC for 12 h.
The resulted samples were then activated under a nitrogen atmosphere (flow rate of 300
mL min1) at 600 C (heating rate of 10 C min1) for 2 h. After cooling, the excess zinc
chloride present in the carbonized material was leached out (for recycle) using dilute
HCl solution. Then, the activated product was washed with hot distilled water until
neutral pH and dried under vacuum at 120 C for 24 h. Finally, the activated carbon
sample was grounded and sieved by mesh #100 and #50 to a particle size range of 0.15 0.3 mm. The specific surface area, mesopore surface area and pore volume of the
sample, determined by BET method, are 1383 m2 g1, 922 m2 g1 and 1.6482 cm3 g1,
respectively
The adsorbate, methylene blue (MB, CI = 52015; chemical formula: C 16H18ClN3S;
molecular weight = 319.86 g mol-1, a cationic dye supplied by Xilong Chemical Co.
Ltd, China), was used without further purification. Double distilled water was used to
prepare all of the solutions and reagents. MB concentration was determined at room
temperature using a UV-Vis spectrophotometer (LIUV-310S) at 664.5 nm.
2.1.2. Methylene blue adsorption experiments
Kinetics experiments were conducted using 300 mL flasks containing 250 mL MB
solution with different initial concentrations (200 - 350 mg L 1) and 500 mg coffee husk
AC samples. The mixtures were magnetic stirred at 200 rpm in a temperature-controlled
water bath at a predetermined temperature (10 - 40 C). At a time-interval, about 5 mL
of the mixtures were pipetted out, filtered, and analyzed for MB concentration.
The amount of MB adsorbed at time t, qt (mg g1), and at equilibrium, qe (mg g1),
were calculated by
117
Le Van Khu, Ta Huu Son, Luong Thi Thu Thuy, Vu Thi Huong, Le Huu Dung and Nguyen Dinh Hung
(Co Ct )V
m
(C Ce )V
qe o
m
qt
(1)
(2)
where Co, Ct, and Ce (mg L1) are the MB concentrations at initial, any time t, and
equilibrium, respectively. V is the volume of the solution (L), and m (g) is the mass of
activated used.
Isotherm adsorption study of MB was carried out using batch experiments in 100
mL Erlenmeyer flasks. The mixtures of 100 mg AC sample and 50 mL MB solution
with different initial concentrations (200 - 350 mg L-1) were shaken at 120 rpm at four
different temperatures of 10, 20, 30, and 40 C for 18 h to reach equilibrium. The
amount of MB adsorbed at equilibrium, qe (mg g1), was calculated by using equation (2).
To ensure accuracy, each adsorption experiment was performed in triplicate, and
the results are presented as mean values.
2.2. Results and discussion
2.2.1. Adsorption kinetics
* Effect of contact time, initial concentration, and temperature
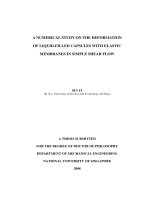
For the kinetic adsorption of MB on coffee husk AC, the effect of initial
concentration (200 - 350 mg L1 ), contact time (5 - 240 minutes), and temperature
(10 - 40 C) are illustrated in Figures 1a and 1b. The amount of MB adsorbed increased
with an increase in contact time, speedily from 5 to 60 min, slowly from 60 to 150 min,
and afterward approached the same values. Thus, the adsorption process is proved to
reach the equilibrium stage after 240 min. The amount of MB adsorbed at time t and
equilibrium increases with an increase in the initial MB concentration from 200 to 350 mg L1
(Figure 1a). This might be ascribed to the increase in the driving force as a result of a
higher concentration gradient [6].
130
200
a)
b)
120
-1
qt (mg g )
-1
qt (mg g )
150
100
Co = 200 mg L-1
Co = 250 mg L-1
50
Co = 300 mg L
-1
Co = 350 mg L
-1
T = 10oC
o
T = 20 C
o
T = 30 C
o
T = 40 C
110
100
90
0
0
50
100
150
t (min)
200
250
0
50
100
150
200
t (min)
Figure 1. Adsorption kinetics of MB on the coffee husk activated carbon
(The solid curves were calculated by the PSO equation)
118
250
Kinetic and equilibrium study on the adsorption of methylene blue from aqueous solution…
According to Figure 1b, the adsorption process is very fast at the initial stage up to
30 min then becomes slower in the range from 60 to 150 min. In this time, the
adsorption rate is increased with an increase in temperature. However, after 150 min of
contact time, the equilibrium was reached, and the MB adsorption capacity is the same,
regardless of the temperature.
* Kinetic model for the adsorption
In order to investigate the adsorption of MB on coffee husk AC, three common
kinetic models, namely the pseudo-first-order, pseudo-second-order, and Elovich, were
evaluated to find the best fitted model for the experimental data. These models are
expressed under linear form as follows:
Pseudo-first-order (PFO):
ln(qe qt ) ln qe k1t
(3)
Pseudo-second-order (PSO):
t
1
1
t
2
qt k 2 qe qe
(4)
qt = (1/β) ln (αβ) + (1/β) ln(t)
(5)
Elovich:
g 1 )
where qt and qe (mg
are the amounts of MB adsorbed at time t (min) and
1
equilibrium; k1 (min ) and k2 (g mg1 min1) are the PFO and PSO rate constants; α is
initial adsorption rate (mg g1 min1), and β is desorption constant (g mg1).
The suitability of the three models investigated is evaluated by the values of the
coefficient of determination (R2) and the average relative errors (ARE). The model with
the highest R2 value and the lowest ARE value is considered to be the most applicable
model, which presents a good correlation between experimental data and kinetic
equation, as well as between the experimental and predicted data. The value of R 2 and
ARE were obtained by using equations (6) and (7).
N
R 2 = 1-
(q
t,mes
- qt,pre )i2
i=1
N
(qt,mes - qt,mean )i2
(6)
i=1
ARE =
100 N qt,pre - qt,mes
N i=1 qt,mes i
(7)
where qt,mes, qt,pre and qt, mean are experimental, predicted and the average amount of MB
adsorbed at time t respectively; N is the number of experimental data.
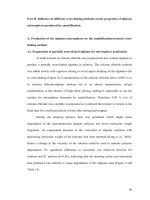
Figure 2 illustrates the applying of PFO, PSO, and Elovich kinetic models for the
adsorption of MB at an initial concentration of 200, 250, 300, and 350 mg L 1, and the
obtained kinetic parameters associated with the adsorption process are given in Table 1.
It was observed that the experimental points are disorderly distributed along the PFO
119
Le Van Khu, Ta Huu Son, Luong Thi Thu Thuy, Vu Thi Huong, Le Huu Dung and Nguyen Dinh Hung
and Elovich fitting lines, indicating a disagreement between the experimental data and
that two models. In the case of PSO model, the linear lines go through almost all the
experimental points, demonstrating its applicability in describing the MB adsorption
process. Comparing the R2 and ARE values of the three models in Table 1, R2 values of
the PSO model are close to unity and ARE values are very small ( 0.40%). Besides,
the qe value of the PSO model is closer to the experimental qe, indicating that MB
adsorption on coffee husk AC follows the PSO kinetic model. The same results have
reported for the adsorption of MB on AC from other precursors, such as date pits [7],
pea shells [8], and sugar beet pulp [4].
3.0
200
5
a)
-1
Co = 200 mg L
1
1.0
qt(mg g-1)
-1
2
1.5
Co = 350 mg L-1
ln(qe-qt)
t/qt(mg g min)
-1
Co = 300 mg L
3
-1
Co = 350 mg L
2.0
Co = 250 mg L-1
175
-1
Co = 300 mg L
b)
-1
Co = 200 mg L
4
-1
Co = 250 mg L
2.5
150
125
0
0.5
-1
0.0
0
50
100
150
t (min)
200
250
-2
300
100
75
1
2
3
4
5
6
ln(t)
Figure 2. PFO and PSO kinetic models (a) and Elovich model (b) for MB adsorption
at 30oC on the coffee husk AC
(The solid, dash, and dotted curves were calculated by the PSO, PFO, and Elovich equations)
It can be seen from Table 1 that the qe obtained according to PSO model (as well as
the experimental qe values) increases with the increase of Co, while unchanged with the
increase of temperature. qe increases from 99.01 to 171.82 mg g1 when Co varies from
200 to 350 mg g1, whereas slightly oscillate around 124.22 mg g1 when temperature
increase from 10 to 40 C.
Given that the PSO model presented the best fit of the experimental data, the initial
adsorption rate, ho (mg g1 min1), at different initial MB concentrations and
temperatures were calculated by the equation (8) and given in Table 1.
(8)
ho k 2 qe2
The initial adsorption rate decreases significantly from 374.5 to 57.0 mg g 1
min 1 when C o increase from 200 to 350 mg L 1 , and slightly increase from 71.2
to 194.2 mg g 1 min 1 when the temperature rises from 10 to 40 C. The increase of ho
with temperature is due to the increase in the diffusion rate of MB from the bulk
solution to the AC surface, on the AC surface, as well as inside the pores at elevated
temperature. Whereas the decrease of ho with Co can be explained by the higher
probability of collision between dye molecules hence reduce the reaction between the
dye and the active sites of the AC surfaces [9].
120
Kinetic and equilibrium study on the adsorption of methylene blue from aqueous solution…
Table 1. Kinetic models calculated parameters in the MB adsorption
on the coffee husk AC
Co (mg L1)
200
250
300
350
250
250
250
T(oC)
30
30
30
30
10
20
40
Experimental qe
(mg g1)
99.49
124.54
2.27
7.42
18.84
29.33
9.13
9.80
5.45
1.14
1.15
1.24
1.02
1.32
1.08
qe (mg g1)
Pseudo k 102 (min1) 0.74
1
firstR2
0.5710
order
ARE (%)
99.07
124.39
0.7686
0.8482 0.8667 0.8256 0.8105
0.7470
96.93
93.31
96.18
97.80
99.01
124.22
148.37 171.82 124.53 124.22
124.07
38.21
8.88
3.18
1.93
4.59
6.37
12.61
374.5
137.0
70.0
57.0
71.2
98.2
194.2
R2
0.9999
0.9999
ARE (%)
0.26
0.19
qe (mg
g1)
k2103
1
1
Pseudo (g mg min )
secondho
order (mg g1min1)
(mg
Elovich
148.95 172.26 124.75 124.29
g1min1)
90.60
96.37
0.9999 0.9999 0.9999 0.9999
0.39
0.40
0.34
0.38
0.9999
0.19
2.941034 8.591011 1.14106 3.07104 3.17106 5.75108 2.421016
(g mg1)
0.850
0.250
0.114
0.189
0.336
R2
0.7711
0.7823
0.8323 0.8609 0.8312 0.7982
0.7643
ARE (%)
0.69
1.72
2.95
0.075
3.67
0.145
2.71
2.18
1.33
* Activation parameters
The result in Table 1 shows that k2 increase with the increasing of temperature,
therefore, the PSO rate constant k2 has been used to determine the activation energy Ea
for MB adsorption onto coffee husk AC applying the Arrhenius equation:
ln k2 ln A
Ea
RT
(9)
where A is the Arrhenius factor, R is the gas constant (8.314 J mol1 K1), and T is the
absolute temperature (K).
The plot of lnk2 versus reciprocal T (Figure 3) gives a straight line, and Ea was
obtained from the slope of the linear plot and was estimated to be 24.759 kJ mol 1.
According to the literature [10], if Ea value is between 5 and 20 kJ mol1 physisorption is
the predominant process, and if Ea > 40 kJ mol1, the chemical reaction process will take
121
Le Van Khu, Ta Huu Son, Luong Thi Thu Thuy, Vu Thi Huong, Le Huu Dung and Nguyen Dinh Hung
place. Therefore, the adsorption of MB from aqueous solution onto coffee husk AC in
this study is mainly physical and promoted by chemisorption.
-8.4
-8.6
lnk2
-8.8
-9.0
-9.2
-9.4
-9.6
-9.8
0.0031
0.0032
0.0033
0.0034
0.0035
0.0036
1/T (K-1)
Figure 3. Plot of lnk2 vs 1/T
* Adsorption mechanism study
The adsorption process is generally including three sequential processes: i) transport
of the adsorbate to the external surface of the adsorbent (film diffusion), ii) transport of
the adsorbate within the pores of the adsorbent and small amount of adsorption occur on
the external surface (particle diffusion), and iii) physisorption or chemisorption of the
adsorbate on the interior surface of the adsorbent [11]. Since the iii) process is generally
accepted to be very fast compared to i) and ii) processes, the rate-limiting step may be
either the film or the intra-particle diffusion or the combined effect of both diffusion
ways. In order to establish the mechanism of the adsorption process and the rate
controlling step, the intra-particle diffusion described by Weber and Morris [12] was
used. This model is presented by the equation:
qt kdt1/2 C
(10)
where qt (mg g1) is the amount of MB adsorbed at time t, kd (mg g1 min0.5) is the intraparticle diffusion rate constant, and C (mg g1) is a constant that reflects the thickness of
the boundary layer effect.
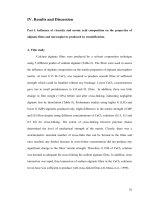
The intra-particle diffusion model plot for MB adsorption on coffee husk AC is
shown in Figure 4. In general, the linear of the plot qt versus t1/2 implicating that the
intra-particle diffusion is included in the adsorption process. If the line passes through
the origin, then the rate-controlling step is the intra-particle diffusion. If the plot does
not pass through the origin, then apart from intra-particle diffusion, other kinetic steps
are involved in the adsorption process [13]. As illustrated in Figure 4, for all
experimental conditions investigated, the plots qt versus t1/2 are made up of three
separate linear steps: i) at the beginning of adsorption, the sharp increase of linear
representing the rapid surface loading due to the strong attraction between MB and the
outer surface of coffee husk AC; ii) in the second stage (25 - 90 min), the lines are less
steep with smaller slope, which illustrate a lower adsorption rate per unit time. This is
122
Kinetic and equilibrium study on the adsorption of methylene blue from aqueous solution…
the gradual adsorption step, and intra-particle diffusion of MB within the pores of AC is
the rate limiting. The value of the intercept C of the plots is proportional to the thickness
of the layer on the AC surface that hinders the diffusion of MB, and iii) after 90 min, the
lines are parallel to the horizontal axis, illustrating the final equilibrium when the
adsorption and desorption rates of MB are equal. Similar behavior was reported for the
adsorption of MB onto modified Tamazert kaolin [5], papaya seeds [14], born char [15].
180
130
b)
a)
120
Co = 200 mg L-1
140
Co = 250 mg L
120
qt (mg g-1)
qt (mg g-1)
160
-1
Co = 300 mg L-1
Co = 350 mg L-1
T = 10oC
T = 20oC
o
T = 30 C
T = 40oC
110
100
100
80
90
0
2
4
6
8
10
12
14
16
18
0
2
4
6
t1/2 (min1/2)
8
10
12
14
16
18
t1/2 (min1/2)
Figure 4. Intraparticle diffusion model plot for MB adsorption on coffee husk AC
(a) with different initial concentrations at T = 30 C
(b) at different temperatures with Co = 250 mg L1
Table 2. Calculated parameters of the Weber and Morris model
for MB adsorption on coffee husk AC
Co
(mg L1)
T
(C)
kd1
(mg g1
min0.5)
C1
(mg g1)
R 12
kd2
(mg g1
min0.5)
C2
(mg g1)
R 22
200
30
1.78
89.63
0.9830
0.09
97.96
0.9819
250
30
7.26
88.23
0.9897
0.69
116.53
0.9946
300
30
13.28
78.10
0.9637
1.13
133.86
0.9930
350
30
18.55
70.27
0.9649
2.49
143.23
0.9898
250
10
10.24
70.40
0.9643
1.15
111.60
0.9794
250
20
8.98
78.78
0.9905
0.99
113.67
0.9764
250
40
6.92
93.68
0.9669
0.60
118.18
0.9984
The calculated parameters of intra-particle diffusion model for the two first steps
are listed in Table 2. It can be observed from Table 2 that the value of kd1 was higher
than that of kd2, indicating the rate of adsorption is initially slightly faster and then slows
down and this could be attributed to the limitation of the available vacant sites for
123
Le Van Khu, Ta Huu Son, Luong Thi Thu Thuy, Vu Thi Huong, Le Huu Dung and Nguyen Dinh Hung
diffusion in and pore blockage by the adsorbed MB molecules on the AC surface. The
obtained results suggest that the process of MB adsorption on coffee husk AC was
controlled by external mass transfer followed by intraparticle diffusion mast transfer.
2.2.2. Equilibrium of adsorption
The experimental results of the relationship between qe and Ce at four temperatures
from 10 to 40 C and the research on the effect of temperature in the kinetic section
show that, with the same Ce, the qe value is independent of temperature. This concludes
that adsorption temperature has only a significant effect on the adsorption rate while
having an unclear effect on equilibrium adsorption. Therefore, this section only
introduces and discuses on experimental adsorption equilibrium data obtained at 30 C.
To understand the interaction between adsorbate and adsorbent, the amount of
adsorbate uptake and the adsorbate concentration remaining in solution was modeled,
using different isotherm models. The two adsorption isotherm models with twoparameters, including Langmuir and Freundlich, and three adsorption isotherm models
with three-parameters, including Redlich-Peterson, Sips, and Toth, are in their nonlinear forms and shown in Table 3.
Table 3. Isotherm models and the parameters involved
Isotherm
Langmuir
Expression
qe
qm K L C e
1 K L Ce
Freundlich
qe K F Ce1/ n
Redlich–
Peterson
qe
Sips
Tóth
qe
qe
ACe
1 BCe
qmS KSCemS
1 KSCemS
qmT Ce
(1/ K T CemT )1/ mT
Parameters
Ref.
qm: maximum monolayer coverage [16, 17]
capacity
KL: Langmuir isotherm constant
KF: Freundlich isotherm constant
n: parameter related to multiple layer
coverage
[18]
A, B: Redlich–Peterson isotherm
constant
: Redlich–Peterson model exponent
[19]
qmS
[19]
Sips maximum adsorption
capacity
KS: Sips equilibrium constant
mS: Sips model exponent.
qmT
:
: Toth maximum adsorption
capacity
KT: Toth equilibrium constant
mT: Toth model exponent
[19]
The parameters of the five isotherms equations for the MB adsorption on coffee
husk AC were evaluated using non-linear regression by minimizing the root mean
square error (RMSE). The applicability of these equations is verified through the
124
Kinetic and equilibrium study on the adsorption of methylene blue from aqueous solution…
coefficient of determination (R2) and the average relative errors (ARE). RMSE, R2 and
ARE are calculated according to equations (11), (12), and (13), respectively.
2
1 N
qe,pre - qe,mes
i
N i=1
RMSE =
N
R 2 = 1-
(q
- qe,pre )i2
e,mes
i =1
N
(q
(11)
(12)
e,mes
2
e,mean i
-q
)
i=1
ARE =
100 N qe,pre - qe,mes
N i=1 qe,mes
i
(13)
240
240
210
210
qe (mg g-1)
qe (mg g-1)
where qe,mes, qe,pre and qe,mean are the experimental, predicted, and average adsorption
capacities, respectively; N is the number of experimental data.
180
Experimetal
Langmuir
Freundlich
150
120
180
Experimetal
Redlich-Peterson
150
120
90
90
0
10
20
30
40
50
60
0
10
20
240
240
210
210
-1
180
Experimetal
Sips
150
30
40
50
60
50
60
Ce (mg L-1)
qe (mg g )
-1
qe (mg g )
Ce (mg L-1)
180
Experimetal
Tóth
150
120
120
90
90
0
10
20
30
Ce (mg L-1)
40
50
60
0
10
20
30
40
-1
Ce (mg L )
Figure 5. Comparison of the experimental and the predicted adsorption isotherms
of MB onto coffee husk AC at 30 C according to Langmuir, Freundlich,
Redlich-Peterson, Sips, and Toth equations
125
Le Van Khu, Ta Huu Son, Luong Thi Thu Thuy, Vu Thi Huong, Le Huu Dung and Nguyen Dinh Hung
Figure 5 illustrates the experimental adsorption isotherms (the black dots) and the
two-parameter and three-parameter isotherm models that are fitted to the experimental
data obtained at 30 C. It can be seen that the experimental data are well described by
Redlich-Peterson, Toth, and Sips models since the experiment points are all lied on the
calculated isotherm lines. The parameters of the five used isotherm models are
presented in Table 4. It can be seen that the R 2 values of three-parameters isotherms are
closer to unity than that of two-parameters isotherms. Furthermore, RMSE and ARE
values of three-parameters isotherms are relatively lower. This suggesting that the threeparameters isotherms provide a better fit than the two-parameters isotherms. Among the
three-parameters models, Redlich-Peterson presents the best fit of all, since R 2 is closest
to unity, RMSE, and ARE values are smallest, suggesting that the adsorption process is
a mix and does not follow ideal monolayer adsorption [20]. Nevertheless, Sips and Toth
models also can describe the investigated adsorption process quite well, considering that
the R2 and ARE values are acceptable (R2 > 0.98 and ARE < 2.5%).
Table 4. Parameters of the Langmuir, Freundlich, Redlich-Peterson, Sips, and Toth
isotherms for the adsorption of MB onto coffee husk AC at 30 oC
Model
Langmuir
Freundlich
Redlich–
Peterson
Sips
Parameters
qm (mg g1)
217.32
KL (L mg1)
0.861
KF (mg1-1/n L1/n g1)
126.06
n
6.684
A (L g1)
252.00
B (L mg1)
1.378
qmS mg g 1
0.951
KS L mg 1
qm T
Toth
mS
mS
mg g 1
K T L mg 1
mT
mT
RMSE
R2
ARE (%)
6.05
0.9729
2.79
11.40
0.9040
6.33
4.00
0.9882
1.91
4.87
0.9825
2.45
4.69
0.9837
2.35
229.86
0.863
0.749
232.43
1.418
0.683
The qm value calculated by the Toth equation is 232.43 mg g 1, suggesting that the
coffee husk AC has a good adsorption capacity for MB adsorption, and is comparable
with kaolin (111 mg g1) [5], silica gel supported calix[4]arene cage (212.770 mg g1) [21],
and industrial softwood waste Cedar (217.39 mg g -1) [22].
126
Kinetic and equilibrium study on the adsorption of methylene blue from aqueous solution…
2.2.3. Scale-up design
The amount of coffee husk AC required to achieve the pre-determined removal
efficiency was estimated by applying data from the best fitted adsorption isotherm
W
V (Co Ct ) V (Co Ce )
qt
qe
(14)
where V is the volume; Co, Ct, and Ce are the MB concentration at initial, any time t, and
equilibrium; qt, qe are the amount of MB adsorbed at any time t and equilibrium; W (g)
is the mass of the AC needed. qe is calculated from the parameters in Table 4 using the
best fitted Redlich–Peterson equation, the equation (14) is modified as equation (15)
W
V (Co Ce )(1 1.378Ce0.951 )
.
252.00Ce
(15)
Table 5 presents the calculated coffee husk AC amount needed in order to achieve
MB removal from 50 to 90% with an initial MB concentration of 100 mg L -1 and MB
solution volume from 2 to 10 L.
Table 5. Weight of activated carbon (g) for the removal of MB (%) at 30 C for
different volumes of MB solution
V (L)
50%
60%
70%
80%
90%
2
0.459
0.560
0.667
0.787
0.951
4
0.919
1.119
1.333
1.574
1.901
6
1.378
1.679
2.000
2.362
2.852
8
1.838
2.238
2.666
3.149
3.803
10
2.297
2.798
3.333
3.936
4.753
It can be seen from Table 6 that the weight of coffee husk AC needed for the
removal of MB is relatively low. The required amount of AC to remove 50 and 90% of
the initial MB concentration are 0.2297 and 0.4753 g L 1, respectively. This result
suggests the effectiveness of coffee husk AC on the removal of MB from wastewater.
3. Conclusions
In this work, the adsorption properties of MB onto coffee husk activated carbon
was investigated using a batch experiment with different MB initial concentrations
of 200 - 350 mg L1 and a range of the temperatures from 10 to 40 C. The kinetic
studies showed that the adsorption process is fast and followed pseudo-second-order
equation, with the activation energy (Ea) is 24.759 kJ mol1. The adsorption process was
controlled by external mass transfer followed by intraparticle diffusion mast transfer.
The equilibrium data is fitted well with the Redlich-Peterson model, from which, the
scale-up system was designed up to 10 L MB solution (100 mg L1) at 30 C for 50 to
90% MB removal. The experimental data obtained in the present study indicated that
activated carbon developed from coffee husk by ZnCl 2 activation follow one-step
127
Le Van Khu, Ta Huu Son, Luong Thi Thu Thuy, Vu Thi Huong, Le Huu Dung and Nguyen Dinh Hung
process is a suitable candidate for use as adsorbents in the removal of cationic dyes
in wastewater.
REFERENCES
[1]
[2]
[3]
[4]
[5]
[6]
[7]
[8]
[9]
[10]
[11]
[12]
[13]
128
L.G.C. Villegas, N. Mashhadi, M. Chen, D. Mukherjee, K.E. Taylor, N. Biswas,
2016. A Short Review of Techniques for Phenol Removal from Wastewater. Curr.
Pollut. Rep., Vol. 2, pp. 157-167.
M. Dogan, M. Alkan, Y. Onganer, 2000. Adsorption of methylene blue from
aqueous solution onto perlite. Water, Air, and Soil Pollution, Vol. 120, pp. 229-248.
P.S. Kumar, P.S.A. Fernando, R.T. Ahmed, R. Srinath, M. Priyadharshini, A.M.
Vignesh, A. Thanjiappan, 2014. Effect of temperature on the adsorption of
methylene blue dye onto sulfuric acid-treated orange peel. Chem. Eng. Comm.,
Vol. 201, pp. 1526-1547.
D. Li, J. Yan, Z. Liu, Z. Liu, 2016. Adsorption kinetic studies for removal of
methylene blue using activated carbon prepared from sugar beet pulp. Int. J.
Environ. Sci. Technol., Vol. 13, pp. 1815-1822.
A. Boukhemkhem, K. Rida, 2017. Improvement adsorption capacity of methylene
blue onto modified Tamazert kaolin. Adsorpt. Sci. Technol., Vol. 35, Iss. 9-10,
pp. 753-773.
Y.J. Yao, H. Bing, F. Xu, F. Chen, 2011. Equilibrium and kinetic studies of
methyl orange adsorption on multiwalled carbon nanotubes. Chem. Eng. J.,
Vol. 170, Iss. 1, pp. 82-89.
S.S. Ashour, 2010. Kinetic and equilibrium adsorption of methylene blue and
remazol dyes onto steam-activated carbons developed from date pits. Journal of
Saudi Chemical Society, Vol. 14, pp. 47-53.
U. Gecgel, G. Ozcan, G.C. Gurpinar, 2013. Removal of Methylene Blue from
Aqueous Solution by Activated Carbon Prepared from Pea Shells (Pisum
sativum). Journal of Chemistry, Vol. 2013, Article ID 614083.
K.K. Wong, C.K. Lee, K.S. Low, M.J. Haron, 2003. Removal of Cu and Pb by
tartaric acid modified rice husk from aqueous solutions. Chemosphere, Vol. 50,
pp. 23-28.
T.S. Anirudhan, P.G. Radhakrishnan, 2008. Thermodynamics and kinetics of
adsorption of Cu(II) from aqueous solutions onto a new cation exchanger derived
from tamarind fruit shell. J. Chem. Thermodynamics, Vol. 40, pp. 702-709.
S. Karthikeyan, B. Sivakumar, N. Sivakumar, 2010. Film and Pore Diffusion
Modeling for Adsorption of Reactive Red 2 from Aqueous Solution on to
Activated Carbon Prepared from Bio-Diesel Industrial Waste. J. Chem., Vol. 7,
Article ID 138684.
Y.S. Ho, J.C.Y. Ng, G. McKay, 2000. Kinetics of pollutant sorption by
biosorbents: Review. Sep. Purif. Technol., Vol. 29, Iss. 2, pp. 189-232.
A. Radjenovic, G. Medunie, 2020. Dynamics and thermodynamics of a nickel
uptake from a water system onto the blast furnace sludge. Journal of Chemical
Technology and Metallurgy, Vol. 55, pp. 110-118.
Kinetic and equilibrium study on the adsorption of methylene blue from aqueous solution…
[14] B.H. Hameed, 2009. Evaluation of papaya seeds as a novel non-conventional low-cost
adsorbent for removal of methylene blue. J. Hazard. Mater., Vol. 162, pp. 939-944.
[15] P. Jia, H. Tan, K. Liu, W. Gao, 2018. Removal of methylene blue from aqueous
solution by bone char. Appl. Sci., Vol. 8, Article ID 1903.
[16] A.M. Brown, 2001. A step-by-step guide to non-linear regression analysis of
experimental data using a Microsoft Excel spreadsheet. Comput. Meth. Prog. Bio.,
Vol. 65, pp. 191-200.
[17] O. Hamdaoui, E. Naffrechoux, 2007. Modeling of adsorption isotherms of phenol
and chlorophenols onto granular activated carbon: Part I. Two-parameter models
and equations allowing determination of thermodynamic parameters. J. Hazard.
Mater., Vol. 147, pp. 381-394.
[18] K. Le Van, D.M. Truong, 2015. Adsorption of methylene blue from aqueous
solution using activated carbon derived from coffee husks. Journal of Science of
HNUE, Chemical and Biological Sci., Vol. 60, pp. 32-43.
[19] N. Ayawei, A.N. Ebelegi, D. Wankasi, 2017. Modelling and Interpretation of
Adsorption Isotherms. J. Chem., Vol. 2017, Article ID 3039817.
[20] F. Brouers, T. J. Al-Musawi, 2015. On the optimal use of isotherm models for the
characterization of biosorption of lead onto algae. Journal of Molecular Liquids,
Vol. 212, pp. 46-51.
[21] F. Temel, M. Turkyilmaz, S. Kucukcongar, 2020. Removal of methylene blue
from aqueous solutions by silica gel supported calix[4]arene cage: Investigation of
adsorption properties. Eur. Polym. J., Vol. 125, Article ID 109540.
[22] M.E. Hajam, N.I. Kandri, A. Harrach, A.E. Khomsi, A. Zerouale, 2019.
Adsorption of Methylene Blue on industrial softwood waste “Cedar” and
hardwood waste “Mahogany”: a comparative study, Materialstoday: Proceedings,
Vol. 13, pp. 812-821.
129