Mobilizing domestic resources for development - Chapter IV
Bạn đang xem bản rút gọn của tài liệu. Xem và tải ngay bản đầy đủ của tài liệu tại đây (187.72 KB, 32 trang )
Chapter IV
Official development
financing
The architects of the post-war international economic system had recognized the need for
official financing to counteract the insufficiency of private capital flows and, since the
1960s, there has been an increasing perception of the need to support developing coun-
tries, an issue that became embedded in the politics of decolonization and the cold war.
The surge of private financing to developing countries beginning in the 1970s and the end
of the cold war generated an increasing realization that the era of official development
financing had passed. However, the vagaries of private capital flows during the 1980s and,
again, since the 1997 Asian crisis, in addition to the increasing marginalization of the
poorest countries from the world economy, have led to a renewed focus on the critical role
of official development finance. The International Conference on Financing for
Development was a landmark in this process. The present chapter explores the issues
involved. It looks first at official development assistance (ODA), then at the multilateral
development banks and South-South cooperation, and lastly at an array of alternatives that
should be grouped under the heading of “innovative sources of financing”.
Official development assistance
The transfer of resources from developed to developing countries has been at the centre of
policies to promote development in the United Nations since the 1950s. In its resolution
400 (V) of 20 November 1950, the General Assembly had noted that the domestic finan-
cial resources of the underdeveloped countries, together with the international flow of cap-
ital for investment, had not been sufficient to assure the desired rate of economic develop-
ment, and that the accelerated economic development of underdeveloped countries
required a more effective and sustained mobilization of domestic savings and an expanded
and more stable flow of foreign capital investment. Two years later, the Assembly, in its res-
olution 520 A (VI) of 12 January 1952, called on the Economic and Social Council to
draw up plans for a special capital fund to provide grants-in-aid and low-interest long-term
loans to underdeveloped countries; and in 1954, the Assembly, in its resolution 823 (IX)
of 11 December 1954, requested the International Bank for Reconstruction and
Development (IBRD) to proceed with the creation of the International Finance
Corporation (IFC).
To generate additional aid to that provided within the United Nations system
and its specialized agencies, in 1958, the World Council of Churches proposed that devel-
oped countries dedicate 1 per cent of their gross domestic product (GDP) as aid for devel-
oping countries in the form of grants and concessional loans. This figure was incorporated
in the objectives of the First United Nations Development Decade and reconfirmed at the
first session of the United Nations Conference on Trade and Development (UNCTAD),
held in Geneva in 1964. UNCTAD at its second session, held in New Delhi in 1968, set
a target of three quarters of 1 per cent of external flows for ODA. Analysis of the external
financial flows required to meet the Second United Nations Development Decade growth
Official development financing 109
ODA is a crucial
supplement to
mobilization of
domestic resources for
development
ODA target of 0.7 per
cent of developed-
country GNI
established by the
United Nations
in the 1960s
goal of at least 6 per cent per annum by the head of the Committee for Development
Planning produced an estimate of 1 per cent of developed-country GDP. Since it was
expected that private flows could provide only about 0.3 per cent, it was understood that
the remaining sums would have to be met by official flows (Emmerij, Jolly and Weiss,
2001, pp. 55-57).
Already at its eighteenth session in 1963, the General Assembly had noted the
slow progress in meeting this objective and by the twenty-first session in 1966 noted with
concern the trend towards an increased outflow of capital from developing countries
(Assembly resolution 2169 (XXI) of 6 December 1966) and noted with deep concern the
fact that, with a few exceptions, the transfer of external resources to the developing coun-
tries had not only failed to reach the minimum target of 1 per cent net of individual
national income of the developed countries but that the trend since 1961 had been one of
continuous decline (Assembly resolution 2170 (XXI) of 6 December 1966). In the mid-
term assessment of the Second United Nations Development Decade, the Assembly noted
that the performance of countries members of the Development Assistance Committee of
the Organization for Economic Cooperation and Development (OECD/DAC) under the
ODA target had been even less satisfactory as a whole. The ratio of ODA to their combined
gross national product (GNP) had declined from 0.53 per cent during the early 1960s to
about 0.39 per cent during the period 1966-1969 and to 0.32 per cent during the period
1970-1973. The poor performance of most of the developed market economy countries
with regard to the target of 0.7 per cent of gross national income (GNI) for ODA was due,
inter alia, to a lack of political will to reach that target by the middle of the decade
(Assembly resolution 3517 (XXX) of 15 December 1975, annex, para. 26).
Concern that external flows to developing countries would decline further in a
system of flexible exchange rates led to a recommendation by the Committee of Twenty on
reform of the international monetary and financial system to propose the creation of a Joint
Ministerial Committee of the Boards of Governors of the Bank and the Fund on the Transfer
of Real Resources to Developing Countries to study and recommend measures on the broad
question of the transfer of real resources to developing countries, which the Committee
agreed should be given encouragement.
1
The expectation of a decline in aid was confirmed
as ODA for 1982-1983 had averaged 0.35 per cent but further fell to a historic low of 0.21
per cent of developed-country GNI at the beginning of the new millennium.
As a result of this historic declining trend, the Monterrey Consensus of the
International Conference on Financing for Development (United Nations, 2002b, annex)
sought to restore the central role of ODA, in particular in supporting the poorest coun-
tries, and thus reaffirmed the 0.7 per cent target. During and after the Monterrey
Conference, many member countries of the OECD/DAC raised their ODA contributions,
and many pledged to meet fixed target dates for reaching the 0.7 per cent goal.
Magnitude and composition of ODA
As a result of the Monterrey commitments, the decline in the share of ODA in developed-
country GNI was reversed, as it rose to 0.25 per cent in 2003 and 2004. Moreover, if all
commitments are met by the target date of 2006, total ODA is projected to reach $88 bil-
lion, an increase of almost 50 per cent in nominal terms from the total recorded in 2002.
If these pledges, together with additional commitments made by DAC member countries
to increase ODA after 2006 are met, ODA is projected to reach $108 billion in 2010
World Economic and Social Survey 2005
110
ODA exceeded 0.5 per
cent of GNI in the
1960s but then
fell back
Monterrey Consensus
sought to reverse
long-term decline
in ODA
(Organization for Economic Cooperation and Development, Development Assistance
Committee, 2005).
Despite the positive trend since 2002, the current and projected levels of ODA
for 2006-2010 still fall far short of the various estimates (United Nations, 2001; UN
Millennium Project, 2005; Commission for Africa, 2005) of about $150 billion deemed
necessary for the developing countries to attain the Millennium Development Goals
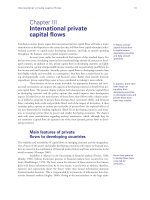
(World Bank and International Monetary Fund, 2005). Furthermore, as can be seen from
figure IV.1, when corrected for price and exchange-rate changes, the recent reversal of the
decline in aid flows has barely brought real assistance back to the levels of 1990.
The European Union (EU) and its member States continue to be the largest
source of aid, providing more than half of total ODA. Denmark, Luxembourg, the
Netherlands, Norway and Sweden already meet or exceed the 0.7 per cent target of their
national incomes dedicated to official assistance. In mid-2005, all member States of EU
undertook to achieve or maintain the 0.7 per cent ODA/GNI target by 2015. Those mem-
ber States which joined EU after 2002 will strive to increase or maintain an ODA/GNI
ratio of 0.33 per cent. The Secretary-General of the United Nations has urged that other
developed countries establish fixed timetables for achieving the 0.7 per cent target of GNI
for ODA by 2015 at the latest.
As noted above, the original intention of the United Nations official assistance
target was to generate increased external resources in the form of grants and concessional
loans to be used to supplement domestic resources so that countries could finance aggre-
gate growth targets in the United Nations Development Decades. Although developing
countries succeeded in meeting the modest growth objectives of the First and Second
United Nations Development Decades, since the 1980s growth performance in many
Official development financing 111
The success of the
Monterrey Consensus
in reversing the
decline in ODA is
insufficient to meet the
financing requirements
of the Millennium
Development Goals
The Millennium
Declaration marked a
shift in approach
compared with that of
the United Nations
Development Decades
Source:
DESA, based on DAC online
database.
Figure IV.1.
Composition of official development assistance, 1990-2003
(corrected for inflation and exchange rates)
Millions of dollars
0
10 000
20 000
30 000
40 000
50 000
60 000
70 000
80 000
1990 1991 1992 1993 1994 1995 1996 1997 1998 1999 2000 2001 2002 2003
Other ODA
Debt-related
Emergency/distress relief
Technical cooperation
developing countries has been disappointing and ODA has declined. The United Nations
Millennium Declaration (see General Assembly resolution 55/2) marked a sharp change in
approach to the United Nations development goals from those subscribed to in the four
United Nations Development Decades. The increasing evidence that the growth and aid
targets were not being met, and the continued increase in disparity in the distribution of
the benefits of growth in a globalizing international economic system, led to the specifica-
tion of much more precise targets represented by the Millennium Development Goals. The
idea was to set precise, measurable targets that would provide visible improvements in the
living conditions of the poorest within a precise time frame.
As the UN Millennium Project report (UN Millennium Project, 2005) makes
clear, this will necessitate expenditure lines that require specific amounts of funding over
specific time periods. The composition of ODA must thus be changed to finance the spe-
cific expenditures needed to achieve the Millennium Development Goals. Figure IV.1 shows
that over the 1990s, the shares of debt relief, emergency aid and technical assistance in total
aid flows were increasing. While these flows have important objectives, emergency aid is not
designed to assist long-term development, and debt relief does not generally provide fresh
money to debtor countries. Technical cooperation, in turn, provides a variety of inputs
towards development results but its impact in closing financial gaps is hard to gauge.
2
Consequently, despite the recent recovery in recorded donor contributions, ODA has been
a declining source of budgetary resources for the developing countries, limiting their efforts
to pursue the Millennium Development Goals. The call to increase ODA must thus be qual-
ified to refer to real cash increases to support the Goals.
Moreover, not only does ODA have to increase substantially in order for the
developing countries to have a better chance of achieving the Millennium Development
Goals but it is essential that ODA be directed to the poorest and least developed among the
developing countries. With the adoption of the Programme of Action for the Least
Developed Countries for the 1990s by the Second United Nations Conference on the Least
Developed Countries in Paris in September 1990 (United Nations, 1991), developed coun-
tries had agreed that, within their 0.7 per cent overall ODA target, they would provide at
least 0.15-0.20 per cent of their GNI to assist the least developed countries. A few individ-
ual donors met this target but aggregate ODA flows to the least developed countries declined
to about half the target during the 1990s. The reversal in trend since Monterrey has been
more positive: ODA to least developed countries has increased sharply in recent years.
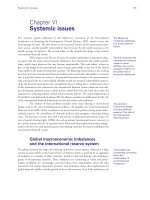
However, a careful look at the composition indicates that the amount of aid for least devel-
oped countries in 2003, after exclusion of the emergency, debt relief and reconstruction com-
ponents, was also only marginally higher than the figure for 1990 (see figure IV.2).
Volatility and conditionality of aid flows
There are a number of other factors that must be considered in order to determine the real
impact of aid in achieving the Millennium Development Goals. First, predictability of aid
flows over time is a precondition for their effective use. However, aid flows tend to rise and
fall with economic cycles in donor countries, with policy assessments of the recipient coun-
tries, and with a shift in donor policies. This uncertainty has a negative impact on public
investment and thus on growth, as well as on the conduct of monetary and fiscal policy.
Empirical work suggests that the volatility of aid flows exceeds that of other macroeco-
nomic variables, such as GDP or fiscal revenue. Aid is significantly more volatile than fis-
World Economic and Social Survey 2005
112
ODA needs to
be targeted to the
poorest and least
developed countries
Size is not the only
important aspect of
ODA—predictability
is equally important
cal revenue, and tends to be procyclical on average (Gemmell and McGillivray, 1998).
When aid falls, it leads to costly fiscal adjustments in the form of increased taxation and
spending cuts that reinforce the cyclical impact of declining aid flows (Pallage and Robe,
2001; Bulír and Hamann, 2003; 2005). In this respect, the volatility in aid flows has a sim-
ilar impact to volatility in commodity prices in countries that are dependent upon the
exports of a single commodity. Indeed, countries receiving aid flows seem to be no better
off than emerging market economies receiving private flows for, as shown in table IV.1, the
volatility of both types of flows as measured by their standard deviation relative to the
mean value is very similar.
Surges in donor flows can also cause macroeconomic problems. In small coun-
try recipients, these problems are compounded by low absorptive capacity and the presence
of a small and often underdeveloped financial sector. Deeper financial markets in aid-recip-
ient countries have been shown to be associated with more efficient management of aid
flows, and to enhance the impact of ODA on growth. They have a positive direct impact
on private investment in recipient countries, and diminish negative indirect effects result-
ing from the impact of ODA on domestic prices, interest rates and the exchange rate
(Nkusu and Sayek, 2004). Surges in donor flows may produce exchange-rate appreciation
and, if sustained over a length of time, the kind of overvaluation phenomenon known as
the “Dutch disease”. Attempts to sterilize the monetary effects of foreign exchange inflows
can be costly. Increased donor flows may be accompanied by negative private flows or
excess reserve accumulation. As a result, the beneficial impact of the aid inflows on growth
and poverty reduction may be offset or even reversed.
Official development financing 113
Figure IV.2.
Composition of official development
assistance to least developed countries, 1990-2003
Millions of dollars
0
5 000
10 000
15 000
20 000
25 000
1990 1991 1992 1993 1994 1995 1996 1997 1998 1999 2000 2001 2002 2003
Source:
DESA, based on OECD/DAC,
DAC online database on annual
aggregates, table 2A,
Destination of official
development assistance and
official aid disbursements
( />dac/stats/idsonline).
Other ODA
Technical cooperation
Emergency/distress relief
Debt-related
Peace-building
and recontruction
Surges in donor flows
create special
problems for small
countries
Volatility of ODA results from more than the year-on-year variability due to
donor budget cycles. There is often a large gap between budgeted aid commitments and
their actual disbursement in the recipient country. Figure IV.3 shows the divergence
between commitments and disbursements for programme and project aid.
3
Further, the
actual disbursement of aid, as distinct from its budgetary commitment, tends to be con-
centrated in periods of high domestic revenue and output. Not only are ODA flows more
volatile than either fiscal revenue or GDP, but their relative volatility increases with the
degree of aid dependency. It has also been found that countries that suffer from high rev-
enue volatility are also countries that suffer from higher aid volatility, suggesting that aid
World Economic and Social Survey 2005
114
Table IV.1.
Volatility of financial flows and bilateral
DAC ODA, top 10 recipients, 1999-2003
Top 10 emerging market countries Financial flows
(Weighted GDP volume) (Standard deviation/mean)
Brazil 0.35
China 0.77
Hong Kong, SAR
a
0.34
Korea, Republic of 0.08
Malaysia 0.11
Mexico 0.18
Poland 0.24
Singapore 0.41
Thailand 0.42
Turkey 0.52
Average 0.34
Top 10 net bilateral DAC ODA recipients
b
Net bilateral ODA
(Standard deviation/mean)
Bangladesh 0.12
China 0.35
Egypt 0.22
India 0.32
Indonesia 0.28
Mozambique 0.46
Pakistan 0.43
Serbia and Montenegro 0.55
United Republic of Tanzania 0.11
Viet Nam 0.27
Average 0.31
Sources: DESA calculations on OECD/DAC database; and World Bank,
Global Development Finance 2005
(Washington, D.C.,
2005).
a
Special Administrative Region of China.
b
Excluding the Democratic Republic of the Congo.
The gap between aid
commitment and aid
disbursement also
reduces predictability
Official development financing 115
Programme aid Project aid
Programme aid Project aid
Figure IV.3.
Commitments and disbursements of programme and project aid, 1995-2003
0
2 000
4 000
6 000
8 000
10 000
12 000
14 000
1995 1996 1997 1998 1999 2000 2001 2002 2003
Millions of dollars
1995 1996 1997 1998 1999 2000 2001 2002 2003
Millions of dollars
-40
-20
0
20
40
60
80
100
120
1995 1996 1997 1998 1999 2000 2001 2002 2003
1995 1996 1997 1998 1999 2000 2001 2002 2003
Commitments
Net disbursement
Commitments
Net disbursement
0
2 000
4 000
6 000
8 000
10 000
12 000
14 000
Commitments
Net disbursement
Commitments
Net disbursement
0
-50
-40
-30
-20
-10
10
20
30
Annual percentage change Annual percentage change
Source: DESA, based on data in World Bank,
Global Development Finance 2005
(Washington, D.C., 2005) and IMF HIPC Initiative-Statistical Update April 11, 2005.
tends to enhance budgetary and overall economic instability (Bulír and Hamann, 2001).
Donors have to consider how to reduce these patterns to enable recipient countries to plan
their fiscal arrangements in a budget year as well as within the context of a longer-term fis-
cal policy framework. The erratic behaviour of both budgeted flows and aid disbursement
needs to be stabilized if aid is to finance a sustained path of growth and poverty reduction.
Aid conditionality is another source of volatility. This is due not only to the
types of specific conditions required by donors, but also to the frequent requirement that
aid recipients have the seal of approval of an International Monetary Fund (IMF) pro-
gramme that is on track. When these programmes go off-track, the negative impact is
intensified by the withdrawal of aid flows by donors.
The now conventional view is that conditionality is an ineffective or at least an
inefficient means to attain objectives that donors wish to attach to financial support of
partner countries. So long as there is no true “ownership” of the policies involved by part-
ner countries—that is to say, so long as they are not backed by strong domestic support—
they are unlikely to be sustained. This is strongly associated with the fact that ownership is
essential to institution-building, which is generally recognized today as the key to success-
ful development policies. Some authors (Morrissey, 2001) have suggested that donors
should support policy processes rather than impose specific policy conditions.
Following this view, some donors have announced radical shifts away from aid
conditionality. One of the most significant has been that described in a recent policy
announcement by the Government of the United Kingdom. A new policy on conditional-
ity was launched early in March 2005 that will stop making the United Kingdom’s aid con-
ditional on specific policies, including in sensitive areas like privatization and trade liber-
alization. Conditionality is to be limited to fiduciary concerns only and to ensuring that
aid is not diverted for purposes other than those intended.
Selectivity of aid flows
Donor selection of aid recipients has tended to be concentrated in a relatively small num-
ber of countries. Figure IV.4 shows that, since the 1980s, the top 20 countries have
received more than half of net bilateral aid and that fewer than 50 per cent of aid recipi-
ents have received 90 per cent of all aid from DAC donors.
4
This suggests that variations
in aid allocations are in large part the result of donors’ selection of top aid recipients.
The concentration of aid in a few countries leads to the question whether
donors tend to move as a group. Evidence suggests that concentration of aid produces herd-
ing behaviour on the part of donors. Thus, donor selectivity compounds the impact of
volatility. This similarity in donor behaviour may be the result of the view that aid effi-
ciency is highest in those countries that have made the most positive reform efforts (see
below). As a result, aid flows tend to be concentrated in those countries that are viewed by
donors as the most successful. Although selectivity of aid has always been present, its
impact seems to have increased since the late 1990s. This is partly due to the signalling
mechanism set in motion through the processes associated with the Poverty Reduction
Strategy Papers (PRSP) and the Heavily Indebted Poor Countries (HIPC) Initiative.
Herding behaviour among donors can also be detected by means of a measure
(denoted LSV) devised by Lakonishok, Shleifer and Vishny (1992) and based on the diver-
gence of actual changes in ODA relative to average behaviour. If all donors follow the aver-
age behaviour, the difference between actual and average behaviour is zero and there is no
World Economic and Social Survey 2005
116
Aid conditionality is
also a source of
volatility in aid flows
Donor selection of
recipients reduces
predictability of aid
Donor mimetism
can be measured
Official development financing 117
Source:
DESA calculations based on data
from OECD/DAC on geographical
distribution of financial flows to
Part I countries (excluding the
Democratic Republic of the
Congo for 2003).
Source:
DESA calculations based on data
from OECD/DAC on geographical
distribution of financial flows to
Part I countries (excluding the
Democratic Republic of the
Congo for 2003).
Figure IV.4.
Concentration of official development
assistance in recipient countries, 1981-2003
Percentage
35
40
45
50
55
60
65
1981 1983 1985 1987 1989 1991 1993 1995 1997 1999 2001 2003
Share of top 20 recipients
in bilateral, net aid flows
Proportion of recipient
countries accounting
for 90 per cent of aid
Figure IV.5.
Collective deviation of flows of official
development assistance among donors, 1981-2003
Collective deviation
0.09
0.11
0.13
0.15
0.17
0.19
0.21
1981 1983 1985 1987 1989 1991 1993 1995 1997 1999 2001 2003
Collective deviation
Top donors
Small donors
All donors
Linear (all donors)
herding. A value of LSV greater than 0.1 indicates significant herding. Figure IV.5 analyses
the behaviour of 10 large and 13 small donors and confirms the existence of herding, espe-
cially with respect to the behaviour of small donors, with an average of collective deviation
of close to 13 per cent.
Bigger and smaller donors tend to move together both when they increase and
when they decrease aid. Overall, historical evidence suggests that a developing country may
expect to experience a reduction in net nominal bilateral ODA volumes with a probability
of about 25 per cent in any given year (see figure IV.6).
Although the factors that cause co-movement in bilateral selectivity of coun-
tries are different compared with the factors that cause herding in private capital markets,
the ensuing macroeconomic instability is similar. While many of the discussions on the
effectiveness of aid have tended to concentrate on the effects of governance and the domes-
tic policy environment in the recipient countries, the economic costs due to problems in
the supply side and limitations to the financial intermediation of donor funds are not
insignificant.
Aid and economic growth in support
of the Millennium Development Goals
The specification of official assistance targets to support the International Development
Strategies for the United Nations Development Decades assumed that increased aid would
contribute to increasing growth in developing countries; since the adoption of the United
Nations Millennium Declaration, it has been argued that increased aid would allow countries
to achieve the Millennium Development Goals. Nonetheless, sustaining the Millennium
World Economic and Social Survey 2005
118
Aid selectivity causes
volatility similar to that
of private capital flows
to emerging market
economies
Aid in support of
growth and aid in
support of poverty
reduction
Figure IV.6.
Proportion of countries experiencing a decline in
bilateral aid volume, by donor grouping, 1981-2003
Collective deviation
0
10
20
30
40
1981 1983 1985 1987 1989 1991 1993 1995 1997 1999 2001 2003
Percentage of recipient countries
Top 10 donors
Total
Small donors
Source:
DESA calculations based on data
from OECD/DAC on geographical
distribution of financial flows to
Part I countries (excluding the
Democratic Republic of the
Congo for 2003).
Development Goals will require a sustained increase in growth. However, the experience with
official assistance in promoting economic growth in developing countries is, at best, a mixed
one. The World Bank (1998) is forthright in recognizing that “if foreign aid has at times been
a spectacular success … (it) has also been, at times, an unmitigated failure”. This sentence
encapsulates the evidence that aid has often had weak effects on growth and poverty reduc-
tion.
5
A growing understanding of the factors that constrain the effectiveness of aid has
helped identify problems in respect of both the supply of donor funds and the limitations in
recipient countries.
6
The challenge for the official donor community, as well as policymakers
in developing countries, has thus been to recognize the weaknesses of the earlier approaches
in aid delivery and to work towards new frameworks to enhance aid effectiveness.
There are two dominant views on the factors that hinder aid effectiveness in pro-
moting growth and reducing poverty. The first, and more dominant view, is that aid works
only when government policies are effective: a more selective allocation of aid to “good pol-
icy-high poverty” countries will thus lead to larger poverty reductions at the global level. The
second view argues that aid effectiveness is not conditional on domestic policy effectiveness
so that more selective allocation may generate other problems, including “aid orphans” and
deepening crises in countries regarded by the donor community as “aid pariahs”.
The first view is based on an influential body of evidence generated by research
at the World Bank (1998) indicating that policies matter for aid effectiveness. The impli-
cations for aid policy are straightforward: allocate more aid to a country with “good” poli-
cies. This message has turned out to be fairly influential and recent empirical work (Collier
and Dollar, 1999, 2001; Burnside and Dollar, 1997; 2000) appears to support this view.
Using the “Country Policy and Institutional Assessment” (CPIA) as a measure of good pol-
icy, these studies estimate that the impact of growth on poverty reduction across countries
is higher for countries with better CPIA scores. If aid allocations between countries are
directed to countries where the correlation is highest, this will maximize the number of
people lifted out of poverty. The studies suggest that a more efficient targeting of aid
towards countries with high rates of poverty pursuing good policies could double the num-
ber of people lifted out of poverty, this being as much as could be achieved by tripling pres-
ent aid budgets at the level of their current country allocations. The World Bank research
has also revealed that the pattern of the actual aid allocations—particularly bilateral aid—
has been highly inefficient, being only weakly targeted to poor countries and even more
weakly directed to well-managed countries.
Other studies have reached different conclusions. Some of them question the
definition and assessment of “good policies” implicit in the CPIA ratings.
7
Some (Beynon,
2003) provide alternative policy interpretations of the World Bank studies,
8
while others
(Hansen and Tarp, 2000; and Beynon, 2003) challenge the results on methodological and
econometric grounds, in terms, for example, of sensitivity to model specification. They sug-
gest that since aid assists countries in adjusting to external shocks, this may explain why
some studies show no significant impact of aid on growth. Another difficulty in measuring
the efficiency of aid flows is caused by the fact that aid flows include debt relief and, as sug-
gested above, do not measure the real contribution of cash resources to supporting growth.
Furthermore, bilateral flows are often used to clear arrears at the multilateral institutions.
An analysis that looks at the composition of aid and focuses on assistance that, plausibly,
could stimulate growth, including budget and balance-of-payments support, investments in
infrastructure, and aid for productive sectors such as agriculture and industry, finds a posi-
tive, causal relationship between this type of aid and economic growth (with diminishing
returns) over a four-year period. The impact is large: at least two to three times larger than
Official development financing 119
Views on the
relationships between
aid, growth and
poverty reduction
differ
One view is that good
policies increase the
beneficial impacts of
aid on growth and
poverty reduction ...
... but others argue
that appropriate
measurement finds a
more general benefit
of aid
the impact found in studies that consider only aggregate aid. Even at a conservatively high
discount rate, a $1 increase in short-impact aid raises output (and income) by $1.64 in pres-
ent value in a typical country (Clemens, Radelet and Bhavnani, 2004).
Any econometric exercise that measures aid effectiveness should thus be based on
data of aid flows that are net of debt relief and aid flows utilized for clearance of arrears.
Alternative research suggests that the impact on growth is positive irrespective of the policy
environment (Morrissey, 2001) while still other research suggests that a range of other vari-
ables are significant such as economic vulnerability (Chauvet and Guillaumont, 2002), exter-
nal shocks (Collier and Dehn, 2001), recovery from conflict (Collier and Hoeffler, 2002) and
geographical factors (Dalgaard and others 2001). Despite these findings, the emphasis on
good governance and institutional change continues to dominate the discussion.
Donor efforts to increase effectiveness
Developed-country donors have been increasingly concerned with the impact of their aid.
Initiatives introduced since the late 1990s to strengthen coordination among donors,
improve the design of programmes, and improve domestic policy implementation include
the Poverty Reduction and Growth Facility (PRGF) and the HIPC Initiative. However,
they do not seem to have decreased the erratic nature of the availability of funds (Bulír and
Hamann, 2005). The effectiveness of increased use of aid to provide budgetary support for
countries that have embarked on the PRSP and entered the HIPC Initiative has also been
affected by the volatility of aid disbursements.
At the Rome High-level Forum on Harmonization held on 24 and 25
February 2003, a plan of action was elaborated to harmonize aid policies, procedures and
practices of donors with those of their developing partner countries. At the second High-
level Forum on Joint Progress towards Enhanced Aid Effectiveness, held in Paris from 28
February to 2 March 2005, twice as many countries and new donor countries participat-
ed, and for the first time civil society representatives and parliamentarians were also
involved. Over 100 countries as well as development institutions committed to a practi-
cal blueprint to provide aid in more streamlined ways, and to improve accountability by
monitoring the blueprint’s implementation. The Paris Declaration on Aid Effectiveness
set out five major principles of aid effectiveness: (a) ownership of development strategies
by partner countries; (b) alignment of donor support with those strategies; (c) harmo-
nization of donor actions; (d) managing for results; and (e) mutual accountability of
donors and partners. The Declaration also contained some 50 commitments to improve
aid quality which were to be monitored by 12 indicators. Participants agreed to prelimi-
nary quantitative targets for only five of them, and the Declaration is particularly weak
on commitments to improve alignment (no target for reliable recipient country systems,
for coordinated donor capacity support or for untying of aid) and agreed to set targets for
the other indicators by the Summit meeting of the General Assembly in September 2005.
The five quantitative targets for 2010 are: (a) at least 75 per cent of partner countries
should have operational development strategies; (b) 85 per cent of aid flows should be
reported on budgets; (c) at least 75 per cent of aid agreed with time framework should be
released on schedule; (d) at least 25 per cent of aid should be provided as “programme-
based approaches”; and (e) 75 per cent of partner countries should have results-oriented
frameworks. EU announced its own additional set of targets, including reducing the num-
World Economic and Social Survey 2005
120
The effectiveness of
ODA is as important as
the amount of ODA
Measures to increase
effectiveness are
receiving increased
attention