Effects of monsoon activity on monthly phytoplankton blooms in the gulf of Thai Land in El Nino year 2002
Bạn đang xem bản rút gọn của tài liệu. Xem và tải ngay bản đầy đủ của tài liệu tại đây (414.04 KB, 6 trang )
VNU Journal of Science: Earth and Environmental Sciences, Vol. 34, No. 2 (2018) 22-27
Effects of Monsoon Activity on Monthly Phytoplankton
Blooms in the Gulf of Thai Land in El Nino Year 2002
Le Van Thien *
Hanoi University of Natural Resources and Environment, Cau Dien, Nam Tu Liem, Hanoi, Vietnam
Received 19 March 2018
Revised 14 April 2018; Accepted 18 April 2018
Abstract: The Gulf of Thailand is a semi-closed Gulf on the west and southwest side of the
Indochina Penisula and experiences reversal monsoon. The object of the present study is to
investigate monthly and spatial distributions of the phytoplankton in the Gulf of Thailand during
whole El Nino year 2002 by using remote-sensing measurements of chlorophyll-a (Chl-a) and
surface wind vectors. Results show that monthly and spatial variations of the phytoplankton
blooms are primarily associated with the monsoonal winds. In general, the average monthly Chl-a
concentrations were quite low (<0.5 mg m-3) most area of the Gulf, with a belt of higher Chl-a
concentrations along the coast during throughout year. Phytoplankton blooms extensively offshore
in the near-coastal area of the Gulf in January and February, which is consistent with the winter
northeast monsoon. In particular, one peak of Chl-a concentrations was observed in December.
Areas with higher Chl-a concentrations along the coast were observed in both winter and summer
monsoon months.
Keywords: Phytoplankton blooms, Monsoon, Gulf of Thailand, El Nino.
1. Introduction
intimated relationship [1, 2]. The physical
properties such as the horizontal distribution of
bottom cold, saline, and heavy water masses in
the Gulf of Thailand could be related to the
incidence and direction of monsoon winds in
that gulf [3]. The monthly variation of the heat
flux could be correlated with the sea surface
wind in the Gulf of Thailand [4]. Chlorophyll-a
is an index of phytoplankton biomass.
However, characteristics of chlorophyll-a and
its distribution associated with monsoon
activity have remained unknown or poorly
known for most of the gulf. In the present
study, we investigated monthly and spatial
The Gulf of Thailand is a semi closed sea
and on the west and southwest side of the
Indochina Penisula (Fig 1). The population in
the coastal area of Gulf of Thailand is large, and
the Gulf of Thailand is a rapidly developing
area both in economics and society, particularly
in aquaculture sectors. Physical, chemical and
biological processes in the ocean are in an
_______
Tel.: 84-1676171337.
Email:
/>
22
L.V. Thien / VNU Journal of Science: Earth and Environmental Sciences, Vol. 34, No. 2 (2018) 22-27
23
variations of Chlorophyll-a (Chl-a) and sea
surface wind conditions in the Gulf of Thailand
during the whole El Nino year 2002 by
examining satellite measurements.
2. Study area and satellite data, and methods
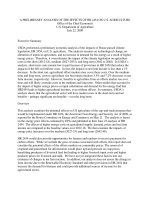
2.1. Study area
The study region is the Gulf of Thailand
(area in Fig. 1, 1000E – 1040E, 60N – 120N).
The average depth of Gulf of Thailand is about
40m. This region experiences reversal
monsoons with the southwest monsoon in the
summer and northeast monsoon in the winter.
Figure 1. Bathymetry of the study area.
2.2. Satellite-derived chlorophyll-a
Sea viewing Wide Field-of View Scanner
(SeaWiFS)
derived
Chlorophyll-a
was
processed using the Ocean Color 4-band
algorithm (OC4) [5, 6]. Monthly averaged Chla concentrations with 3x3km spatial resolution
were obtained and processed for the study
region. Ocean Color and Temperature Scanner
(OCTS) aboard Advanced Earth Observing
Satellite observed the Chl-a concentration in the
surface layer from October 1996 to June 1997
with quality similar to that of SeaWiFS [7].
SeaWiFS-derived Chl-a concentrations are
consistent with survey measurement in most
area in the western South China Sea, including
coastal waters [2].
2.3. Satellite-derived surface vector winds
Sea surface vector winds have been
measured from the microwave scatterometers
[8]. We used 0.5-degree monthly mean wind
fields obtained from the QuickBird satellite
which was launched in June 1999. QuikScat is a
radar device that transmits radar pulses down to
the Earth’s surface and then measures the
power that is scattered back to the instrument.
Wind speed and direction over the ocean
surface are obtained from measurements of the
QuikScat backscattered power [8].
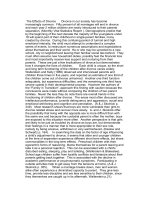
Figure 2. Monthly mean SeaWiFS Chl-a
for January 2002.
3. Conditions of surface winds and Chl-a
distributions and phytoplankton blooms
The monthly variations and spatial
distributions of Chl-a concentrations and
surface winds from January to December 2002
were analyzed and shown by some
representative figures. During January, the
Chl-a in the center of the Gulf is very low (<0.5
mg m-3). However, a belt of high Chl-a
24
L.V. Thien / VNU Journal of Science: Earth and Environmental Sciences, Vol. 34, No. 2 (2018) 22-27
concentrations along the coast of the Gulf (Fig.
2) and strong northeast monsoon winds (>
7m/s) were observed on the south side of the
gulf below latitude 9N (Fig 3). Particularly, the
strong phytoplankton blooms with high Chl-a
concentrations (> 1.5 mg m-3) appeared in the
offshore region with a tongue shape in this
month (Fig. 3).
These characteristics were found to be
similar in February although the extended area
of high Chl-a and the magnitudes of winds were
smaller than in January (not shown). The
distribution of Chl-a concentration has similar
patterns with the coastal phytoplankton blooms
and values during March and April (not
shown). The weaker south and southeast
monsoon winds dominated almost entire the
gulf and ranged from 4-5.5 m/s during these
two months (not shown). The bloom
strengthens in May along the eastern coast area
and the southwest monsoon onset was obvious
as the monsoon winds started changing in the
direction to south and southwest all over the
Gulf (not shown). The bloom developed in the
eastern gulf and weakened in the western gulf
along the coastal lines from June to September
(Fig. 4).
The prevailing winds in the gulf were very
strong southwesterly winds with surface wind
speed reached from 5-10m/s during these
months (Fig. 5).
The bloom seems a little weakened in
October (not shown). The monthly mean winds
lessened during this month (not shown). A
longer intense bloom was found in November
and December near the coast (Fig. 6).
Figure 3. Monthly mean QuikScat surface vector
winds for January 2002.
Figure 5. Monthly mean QuikScat surface vector
winds for July 2002.
Figure 4. Monthly mean SeaWiFS Chl-a
for July 2002.
L.V. Thien / VNU Journal of Science: Earth and Environmental Sciences, Vol. 34, No. 2 (2018) 22-27
The strong extended bloom father offshore
has a similar patch of high Chl-a in both
December and January. This behavior of
phytoplankton is the same as shown in
November and February. It is worth to note that
the prevailing winds were the strongest
northeast winds through the year in these two
months (Fig. 7).
Figure 6. Monthly mean SeaWiFS Chl-a for
December 2002.
Figure 7. Monthly mean QuikScat surface vector
winds for December 2002.
25
4. Discussion
In general, Chl-a concentration in the
coastal area of the Gulf of Thailand was higher
than that in the offshore area. The
phytoplankton blooms with high Chl-a
concentration (>1.5 mg m-3) appeared in the
extended offshore regions in January, February,
November, and December and decreased during
transition month in April. In the center area of
the Gulf, Chl-a concentrations were usually
relatively low (<0.5 mg m-3) throughout the
year. In the coastal zones, Chl-a concentrations
were generally high throughout the year and
further enhanced during the strong northeast
winter monsoon winds of November, December
and January and strong southwest summer
monsoons winds of June-September. In
particular, Chl-a concentration was peak during
the strong northeast monsoon winds in January,
November, and December.
The Gulf of Thailand dominates by the
Asian monsoon, which obviously illustrates the
reversed wind direction in a year with northeast
winds in the winter and southwest winds in the
summer.
So hat factors that may cause the bloom in
this gulf? In this section, we discuss some
physical processes that may contribute to the
bloom. First, the coastal upwelling which is the
consequence of the offshore transport of wind
drove surface current due to the Coriolis effects.
The upward movement of waters causes the
intense phytoplankton blooms. However, the
northeasterly and southwesterly monsoon winds
during months in this year do not favor coastal
upwelling along the coast. Another process that
contributes to the bloom is from Ekman
pumping. This Ekman pumping was thought to
cause strong upward motion. Upwelling by
Ekman pumping during the monsoon activity is
able to enhance Chl-a concentration and induce
the bloom. A comprehensive study is required
for this elucidation when mean Ekman pumping
calculated from winds. We will leave it for a
future study.
26
L.V. Thien / VNU Journal of Science: Earth and Environmental Sciences, Vol. 34, No. 2 (2018) 22-27
In addition, many previous papers have
demonstrated that vertical mixing is associated
with abundant plant and animal biomass [9-11].
Entrainment of nutrient-rich water by wind
mixing may act to enhance phytoplankton
blooms during monsoon in this gulf. The strong
winds during northeast monsoon in the winter
mix water to deeper depths and thus bring
nutrients to the mixed layer induced high Chl-a.
During the mature phase of El Nino, [12]
showed that a decrease in cloudiness over the
Gulf induces an increase in the shortwave
radiation in November. Thus the strong winds
during the northeast winter monsoon may mix
water to deeper depths and consequently induct
nutrients to the mixing layer resulting in high
Chl-a in the clear sky period of El Nino year.
Thus, the importance of monsoonal winds in
the Gulf as a physical process which may
enhance Chl-a appears to be a major forcing
factor during the northeast monsoon in this El
Nino year over the Gulf of Thailand.
References
[1] Chaturvedi N., Narain A., and Pandey P.C.,
1998. Phytoplankton
pigment/temperature
relationship in the Arabian Sea, Indian J. Mar.
Sci, 27, p.286–291.
[2] Tang D.L., Kawamura H., Dien T.V., and
Lee M. A., 2004b. Offshore phytoplankton
biomass increases and its oceanographic causes in
the South China Sea, Mar. Ecol. Prog.
Ser, 268, p.31–41.
[3] Yanagi T., Sachoemar S.I., Takao T., and
Fujiwara S.,
2001. Seasonal
variation
of
stratification in the Gulf of Thailand, J.
Oceanogr, 57, p.461–470.
[4] Stansfield K., and Garrett C., 1997. Implications
of the salt and heat budgets of the Gulf of
Thailand. J. Mar. Res, 55, p.935–963.
[5] O'Reilly J.E., et al. 2000. Ocean color chlorophyll
an algorithm for SeaWiFS, OC2, and OC4:
Version 4, in SeaWiFS Postlaunch Calibration
and Validation Analyses: Part 3, edited by S. B.
Hooker, and E. R. Firestone, NASA Tech.
Memo, 2000-206892(11), p.9–23.
[6] O'Reilly J.E., Maritorena S., Mitchell B. G.,
Siegel D.A., Carder K.L., Garver S.A., Kahru
M., and
McClain C., 1998. Ocean color
chlorophyll algorithms for SeaWiFS, J. Geophys.
Res, 103(24), p.937–24,953.
[7] Kawamura H., and OCTS Team, 1998. OCTS
mission overview, J. Oceanogr, 54, p.383–399.
[8] Wentz F.J., Smith D.K., Mears C.A., and
Gentemann C.L, 2001. Advanced algorithms for
QuikScat and SeaWinds/AMSR, paper presented
at IGARSS '01, NASA, Washington, D. C.
[9] McGowan J.A., and Hayward T.L., 1978. Mixing
and oceanic productivity, Deep Sea Res, 25,
p.771-793.
[10] Marra J., 1980. Vertical mixing and primary
productivity, in Primary Productivity in the Sea,
edited by P. G. Falkowski, p. 121-137, Plenum,
New York.
[11] Banse K., and McClain C.R., 1986. Satelliteobserved winter blooms of phytoplankton in the
Arabian Sea, Mar. Ecol. Prog. Ser, 34, p. 201-211.
[12] Wang C., Wang W., Wang D., and Wang Q.,
2006. Interannual variability of the South China
Sea associated with El Niño, J. Geophys.
Res, 111, C03023, doi:10.1029/2005JC003333.
L.V. Thien / VNU Journal of Science: Earth and Environmental Sciences, Vol. 34, No. 2 (2018) 22-27
27
Ảnh hưởng của hoạt động gió mùa đến sự bùng nổ thực vật
phù du trong các tháng của năm El Nino 2002
ở Vịnh Thái Lan
Lê Văn Thiện
Trường Đại học Tài nguyên và Môi trường Hà Nội, Cầu Diễn, Nam Từ Liêm, Hà Nội, Việt Nam
Tóm tắt: Vịnh Thái Lan là một vịnh gần như khép kín ở phía Tây Nam và Tây của bán đảo Đông
Dương và là vịnh có sự dịch chuyển ngược chiều của hoạt động gió mùa. Mục tiêu của nghiên cứu này
là nghiên cứu sự phân bố theo không gian và theo các tháng của thực vật phù du ở Vịnh Thái Lan
trong toàn bộ một năm El Nino 2002 bằng việc sử dụng số liệu quan trắc từ vệ tinh của nồng độ
chlorophyll-a (Chl-a) và véc tơ gió bề mặt. Các kết quả nghiên cứu chỉ ra rằng sự biến đổi theo không
gian và theo các tháng của việc bùng nổ thực vật phù du là chủ yếu liên quan đến sự hoạt động của gió
mùa. Nhìn chung, nồng độ Chl-a trung bình hằng tháng là khá thấp (<0,5 mg m-3) ở hầu hết các khu
vực trong Vịnh, tuy nhiên có một dải có nồng độ Chl-a cao hơn dọc theo ven biển Vịnh trong suốt cả
năm. Sự bùng nổ thực vật phù du mở rộng ra ngoài khơi trong các khu vực gần ven biển của Vịnh
trong tháng 1 và tháng 2, đây cũng là tháng phù hợp với hoạt động của gió mùa đông bắc. Đặc biệt,
nồng độ Chl-a lớn nhất được quan trắc thấy vào tháng 12. Các khu vực có nồng độ Chl-a cao hơn dọc
theo ven biển là được quan trắc thấy trong cả các tháng mùa đông và các tháng mùa hè.
Từ khóa: Bùng nổ thực vật phù du, gió mùa, Vịnh Thái Lan, El Nino.