Genetic diversity characterization of pleurotus strains by random amplified polymorphic DNA fingerprinting
Bạn đang xem bản rút gọn của tài liệu. Xem và tải ngay bản đầy đủ của tài liệu tại đây (224.63 KB, 8 trang )
Int.J.Curr.Microbiol.App.Sci (2017) 6(5): 1260-1267
International Journal of Current Microbiology and Applied Sciences
ISSN: 2319-7706 Volume 6 Number 5 (2017) pp. 1260-1267
Journal homepage:
Original Research Article
/>
Genetic Diversity Characterization of Pleurotus strains by Random Amplified
Polymorphic DNA Fingerprinting
M.K. Yadav1*, Ram Chandra2, H.B. Singh2, S.K. Yadav4, S.K. Yadav3,
Sushreeta Naik2 and P.K. Dhakad2
1
Rani Lakshmi Bai Central Agricultural University, Jhansi-284003 (U.P.), India
Department of Mycology and Plant Pathology, 3Department of Agricultural Entomology and
Zoology, 4Department of Botany, Institute of Agricultural Sciences, Banaras Hindu University,
Varanasi-221005 (U.P.), India
2
*Corresponding author
ABSTRACT
Keywords
Clusters,
Dendrogram,
Genetic diversity,
Molecular marker,
Pleurotus.
Article Info
Accepted:
12 April 2017
Available Online:
10 May 2017
Wild edible mushroom are the special product of the forest. The diversity of mushroom
and their natural beauty inhabit major threat in the biological world and India has been a
frame for these fungi. The previous attempts for genetic improvement in mushrooms had
little success due to low genetic diversity amongst commercially cultivated mushrooms
strains and non- inclusion of wild collections in the breeding programs. This limited
availability of genetic variation significantly slowed down the progress of genetic
improvement in this commercially most important mushroom. The present investigation of
genetic diversity of Pleurotus species were ranged from 30 to 70%. The Cluster analysis
were using Unweighted Pair-Group Method with Arithmetic Mean (UPGMA), clearly
separate dendrogram was obtained from the molecular marker systems for all the eight
Pleurotus species. Clustering on the basis of Random Amplified Polymorphic DNA
(RAPD) marker using Jaccard’s coefficient generated two (I and II) broad groups of six
and two Pleurotus species. Clusters also confirmed 70% of genetic diversity among the
Pleurotus species.
Introduction
The use of wild mushrooms for food in all
probability began with the prehistoric man.
During the long period human as a hunter
gathered the fungi of the forest that has served
as an important source of nourishment. There
are many edible mushrooms i.e. Volvarias,
Polypores and tubers fungi that used ethnobotanical food by the tribal of forest regions.
These are obviously non toxic as these have
been in intimate human consumption by
native and tribal, since antiquity (Pandey and
Srivastava, 1994). However, the food value
and acceptance of these edible fungi by the
scientific and civilized world have not been
recognized. These fungi are more important
for a tropical/ subtropical country like India,
which has a climate most congenial for the
natural growth of such fungi (Purkayastha and
Chandra, 1985). Describing the number of
fungi on earth has been a position of
conversation and several studies have focused
on enumerating the world’s fungal diversity
(Crous et al., 2006). Only a part of total
fungal wealth has been subjected to scientific
1260
Int.J.Curr.Microbiol.App.Sci (2017) 6(5): 1260-1267
study and mycologists continue to disentangle
the unknown and hidden wealth one third of
fungal diversity of the globe exists in India
and of this only 50 % are characterized until
now (Manoharachary et al., 2005).
Mushrooms have been extensively studied in
the Western countries, while tropical
countries like India especially in Vindhya
forest of Northern India. However no
determined efforts have been made for a
detailed study of them. Till today no research
have been done on natural mushroom flora,
further attempt on isolation, characterization
and maintenance of cell mycelial culture both
in vitro and ex vitro yet to carry out. Mean
while in Vindhya region several mushrooms
have been reported and described on
morphological basis by the various workers
(Rahi, 2001).
The main objectives was to typical diversity
of fleshy fungi, characterize, collect preserve
and evaluate edibility of these different
species in dry deciduous forest of Vindhya
region
of
Northern
India.
RAPD
fingerprinting has been used for genetic
diversity analysis, varietal identification and
strain protection in various field crops. RAPD
markers have also been successfully used to
detect genetic variation in a wide variety of
fungal species including mushrooms.
This study indicates that RAPD analysis is a
sensitive and powerful tool for assessment of
genetic variation at DNA level among
Pleurotus strains.
DNA isolation and purification
Genomic DNA from fruit body was isolated
by CTAB modified method (Dellaporta et al.,
1983).
DNA extraction solutions
Isolation buffer
20ml
2% w/v CTAB (Cetyl Tri-methyl Ammonium
Bromide)
0.30ml
1.4 M NaCl
1.638g
20 mM EDTA (pH 8.0)
0.148g
100 mMTrisHCl (pH 8.0)
0.315g
Note
0.2%mercaptoethanol was added immediately
before use.
Phenol
: Chloroform: iso-amyl
alcohol (PCI)-25:24:1
Chloroform
24:1
: iso-amyl alcohol (CI)-
100% iso-propanol : 0.30ml
Materials and Methods
Random amplified polymorphic
(RAPD) molecular marker
DNA
Washing solution
ammonium acetate
: 70% ethanol, 10mM
TE buffer
Some of the collected different strains of
edible mushroom were characterized by
RAPD analysis by the modified method
(Yadav et al., 2003). Random amplified
polymorphic DNA (RAPD) markers were
used for evaluation of genetic diversity in
selected group of Pleurotuss trains. Six
RAPD primers used and all the strains were
distinguished using aggregated RAPD data.
10mM TrisHCl
1mM EDTA (pH 8.0)
0.029g
0.037g
3 M ammonium acetate
2.312g
DNA isolation protocol
100mg fruit body of mushroom were quick
freeze in liquid nitrogen (-1960 C) and grind
to a fine powder in pre-chilled autoclaved
1261
Int.J.Curr.Microbiol.App.Sci (2017) 6(5): 1260-1267
mortar and pestle. Powder was transferred to
a sterile 2 ml centrifuge tube. Thawing was
carefully avoided and 1000 µl of extraction
buffer was added and mixed thoroughly. The
centrifuge tubes were incubated for 30
minutes at 600C in water bath with
intermittent swirling at every 10 minutes. One
volume of phenol: chloroform: iso-amyl
alcohol (25:24:1) was added into the tubes,
capped and extracted for 10 minutes on a
rotary shaker. Mixing was done gently but
thoroughly to ensure emulsification. The
tubes were centrifuged at 10 K rpm for 10
minutes. Depending upon the purity of DNA
preparation; the upper aqueous phase was
extracted 2-3 times with fresh chloroform:
iso-amyl alcohol (24:1). The final aqueous
phase was transferred to other centrifuge
tubes. To these, 0.6 volume of ice cold isopropanol was added and mixed gently by
inverting the tube. At this stage, DNA-CTAB
complex was found to precipitate as a whitish
matrix. The pellet was gently agitated for few
minutes and collected by centrifugation at
4C). Residual CTAB buffer was removed in
this step. The tubes were inversed and drained
on a paper towel for 1hr with care so that the
pellet does not slip down. Pellet was neither
containing ethanol nor was too dry. An
appropriate (50µl) volume of TE buffer was
used to dissolve the pellet.
Purification of DNA
To remove the RNA, RNase A @ 10µg/ml
was added into the DNA solution and
incubated at 37C for 30 minutes. Equal
volume of phenol: chloroform: iso-amyl
alcohol (25:24:1) was added into it and
centrifuged at 10000 rpm for10 minutes.
Aqueous phase was taken and equal volume
of chloroform: iso-amyl alcohol (24:1) was
added and centrifuged at 10000 rpm for 10
min. To the aqueous phase, 1/20th volume of
Na acetate (3M, pH-5.2) and 2.5 volume of
ethanol was added and incubated at -20C for
1h (or-70C for 30 min). Then the solution
was centrifuged at10000 rpm for 10 min,
pellets were washed with 70% ethanol (10000
rpm, 5 min), air dried and dissolved in
distilled water. Yield of DNA was estimated
using DNA markers by electrophoresis.
PCR amplification
PCR amplification was performed by
Williams et al., (1990). PCR amplification
was carried out in 0.2 ml thin-wall PCR tubes
using an Eppendorf (model AG 22331
Hamburg) thermal cycler. A total of 6 RAPD
primers were screened in our present study (6
primers from kit S) was amplified. 6 primers
(viz. S43, S1017, S159, S485, S75 and S24)
could produce unambiguous polymorphic
bands and was selected for the present study.
The preparation of Polymerase chain reaction
(PCR) mixture of 25 µl was in table 1. PCR
cycle conditions were as follows: initial
denaturing step at 94C for 3 min followed by
44 cycles of 94for 1 min, 37C for 1 min and
72C for 2 min. In the last cycle, primer
extension at 72C for 7 min was provided.
Gel electrophoresis and documentation
PCR products were electrophoretically
separated on a 1.2% Agarose gel containing
Ethidium Bromide using 1X TAE buffer (pH
8.0). Agrose gel 0.480g was dissolved in
40ml 0f 1X TAE buffer and boiled. After that
add 2 µl of EDTA dye mixed and poured in
plate of gel. After that solidify the gel were
kept in gel electrophoresis instruments; load
the samples and Ladder and switch on the
electric
charge
for
running
gel
electrophoresis.
The amplified products were visualized and
photographed under UV light source. As
molecular marker, 100 bp DNA Ladder Plus
(ready-to-use) (Fermentas Inc.) was used. The
ranges of fragments were measured in this
1262
Int.J.Curr.Microbiol.App.Sci (2017) 6(5): 1260-1267
particular molecular weight marker varied
from 3000 bp to 100bp.
dendrogram, using UPGMA and the NTSYSpc software version 2.1 developed by Rohlf
(1997).
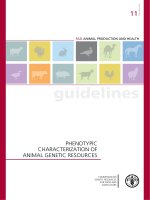
RAPD data analysis
DNA bands were scored ‘1’ for its presence
and ‘0’ for its absence for each primergenotype combination. Only unambiguous
bands were scored for identifying presence
and absence of bands. A similarity matrix was
constructed, using Jaccard’s coefficient, and
the resulting similarity data were used to
construct a dendrogram, using UPGMA and
the NTSYS-pc software version 2.1
developed by Rohlf (1997).
Results and Discussion
Genetic diversity among the collected
edible mushrooms (Pleurotus sp.) analysis
by Random Amplified Polymorphic DNA
Genetic diversity of collected edible
mushroom of eight species of Pleurotus is
revealed by Random Amplified Polymorphic
DNA (RAPD). DNA bands were scored ‘1’
for its presence and ‘0’ for its absence for
each primer-genotype combination (Fig. 1).
Only unambiguous bands were scored for
identifying presence and absence of bands. A
similarity matrix was constructed, using
Jaccard’s coefficient, and the resulting
similarity data were used to construct a
A total 8 Pleurotus sp. were tested for their
genetic variability by RAPD analysis, using 6
random primers. These primers viz. S43,
S1017, S159, S485, S75 and S24 produced
easily scorable and consistent banding
patterns, which were used for RAPD analysis
of test. The amplified products were ranged
from 200 bp to 1250 bp. Analysis of the
genetic coefficient, derived from the scores of
RAPD profile, showed that minimum and
maximum % diversities among the Pleurotus
sp. were ranged from 30 to 70%, respectively
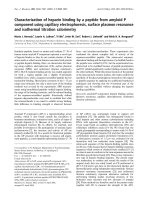
(Fig. 2). Cluster analysis, using Unweighted
Pair-Group Method with Arithmetic Mean
(UPGMA), clearly separate dendrogram was
obtained from the molecular marker systems
for all the 8 Pleurotus sp. Clustering on the
basis of RAPD marker using Jaccard’s
coefficient generated two (I and II) broad
groups of six and two Pleurotus sp. Clusters
also confirmed 70% of genetic diversity
among the Pleurotus sp. (Fig. 2). Cluster I
consisted 6 (PL-1, PL-2, PL-3, Psc-1, Psc-2
and PF-1) and cluster II consisted 2 (PO-1
and PE-1) Pleurotus species. Cluster I were
further separated in to two sub cluster (A and
B) with 67.5% diversity.
Table.1 Detail of polymerase chain reaction (PCR) mixture of 25 µl
S. No.
1
2
3
4
5
6
Component
Sterile Milli Q water
10 x Taq buffer
d NTPs
Random primer
Taq DNA polymerase
Template DNA
1263
Quantity
19.05 µl
2.5 µl
0.25 µl
1.0 µl
0.2 µl
2.0 µl
Int.J.Curr.Microbiol.App.Sci (2017) 6(5): 1260-1267
Fig.1 Genetic diversity of eight Pleurotus sp. Analysis by Random Amplified Polymorphic DNA by Gel Electrophoresis
1264
Int.J.Curr.Microbiol.App.Sci (2017) 6(5): 1260-1267
Fig.2 Dendrogram of eight Pleurotus sp. analysis of genetic dissimilarities based on
random amplified polymorphic DNA data with 6 primers
1265
Int.J.Curr.Microbiol.App.Sci (2017) 6(5): 1260-1267
The sub cluster A was also divided into two
groups Aa and Ab with 58.5% diversity. Aa
group consisted two Pleurotus sp. (Psc-1 and
Psc-2) having 35% variability while sub
cluster Ab divided into two having 37.5%
variability; one cluster consisted only one
Pleurotus sp.(PL-3) and another consisted
two Pleurotus sp. (PL-1 and PL-2) with
having 30% variability. The sub cluster B was
consisted one species PF-1.
The result is confirmative with finding of Yin
et al., (2013) who investigated that the
molecular markers were used to analyze the
genetic diversity of 15 Chinese P.
pulmonarius cultivars. In total, 21 RAPD
primers selected for generating data based on
their clear banding profiles produced. With
the use of these RAPD primers, a total of 361
RAPD fragments were detected, of which 287
(79.5 %) RAPD fragments were polymorphic.
UPGMA trees of these three methods were
structured similarly, grouping the 15 tested
strains into four clades. Subsequently, visual
DNA fingerprinting and cluster analysis were
performed to evaluate the resolving power of
the combined RAPD markers in the
differentiation among these strains.
The confirming result of Theochari et al.,
(2002) who studies an approach of the
biodiversity was achieved by analyzing allelic
polymorphism at mating type loci in a sample
of P. ostreatus isolates, which made evident
the variability likely to exist in this biological
material.
In conclusion, the genetic diversity of
Pleurotus species was ranged from 30 to
70%. Cluster analysis, using UPGMA, clearly
separate dendrogram was obtained from the
molecular marker systems for all the 8
Pleurotus species. Clustering on the basis of
RAPD marker using Jaccard’s coefficient
generated two (I and II) broad groups of six
and two Pleurotus species. Clusters also
confirmed 70% of genetic diversity among
the Pleurotus species.
References
Crous, P.W. 2006. How many species of
Fungi are there in tip of Africa? Studies
in Mycol., 55: 13.
Dellaporta, S.L., Wood, J. and Hichs, J.B.
1983. Plant Mole. Boil. Repor., 1: 1921.
Manoharachary, C., Sridhar, K., Singh, R.,
Adholeya, A., Suryanarayanan, T.S.,
Rawat, S. and Johri, B.N. 2005. Fungal
biodiversity: Distribution, conservation
and prospecting of fungi from India.
Curr. Sci., 89(1): 58-71.
Pandey, V.N. and Srivastava, A.K. 1994.
Fleshy fungi go ethno-botanical food
use in North Eastern Tarai region of
Uttar Pradesh. Proceeding of the
National Symposium on Mushroom,
NRCM-Solan, 3.
Purkayastha, R.P. and Candra, A. 1985.
Mannual of Indian Edible Mushroom,
Today and Tomorrow Printer and
Publisher, New Delhi, 266.
Rahi, D.K. 2001. Studies on the edible tribal
mushrooms of M. P. and development
of technology for large scale
production. Ph. D. Thesis, R.D.
University, Jabalpur (MP), India.
Rohlf, F.J. 1997. NTSYS-PC Numerical
Taxonomy and Multivariate Analysis
System Version 2.1, Exeter Software.
Appl. Biostatistics, New York.
Theochari, I., Nikolaou, A. and Poulou, A.
2002. Resources of Pleurotus ostreatus
and P. eryngii in Greece perspectives
for
cultivation
and
mushroom
production. ActaHorticulturae, 579: 5963.
Yadav, M.C., Mahfooz, S., Singh, S.K. and
Upadhyay, R.C. 2003. RAPD markers
assisted selection of genetically diverse
parents for hybridization in Agaricus
1266
Int.J.Curr.Microbiol.App.Sci (2017) 6(5): 1260-1267
bisporus. Mush. Res., 12(1): 19-26.
Yadav, M.K., Chandra, Ram and Dhakad, P.
K. 2016. Biodiversity of edible
mushrooms in Vindhya forest of
northern India. Indian J. Agrl. Sci.,
86(8): 1070–5.
Yin, Y., Liu, Y., Huamin, L., Zhao, S., Wang,
S., Liu, Y., Wu, D. and Xu, F. 2013.
Genetic
Diversity
of
Pleurotus
pulmonarius revealed by RAPD, ISSR,
and SRAP Finger printing. Curr.
Microbiol., 1-7.
How to cite this article:
Yadav, M.K., Ram Chandra, H.B. Singh, S.K. Yadav, S.K. Yadav, Sushreeta Naik and
Dhakad, P.K. 2017. Genetic Diversity Characterization of Pleurotus strains by Random
Amplified Polymorphic DNA Fingerprinting. Int.J.Curr.Microbiol.App.Sci. 6(5): 1260-1267.
doi: />
1267