Assessment of genetic divergence in tomato (Solanum lycopersicum L.) through clustering and principal component analysis under mid hills conditions of Himachal Pradesh, India
Bạn đang xem bản rút gọn của tài liệu. Xem và tải ngay bản đầy đủ của tài liệu tại đây (196.07 KB, 9 trang )
Int.J.Curr.Microbiol.App.Sci (2017) 6(5): 1811-1819
International Journal of Current Microbiology and Applied Sciences
ISSN: 2319-7706 Volume 6 Number 5 (2017) pp. 1811-1819
Journal homepage:
Original Research Article
/>
Assessment of Genetic Divergence in Tomato (Solanum lycopersicum L.)
through Clustering and Principal Component Analysis under Mid Hills
Conditions of Himachal Pradesh, India
Nitish Kumar1*, M.L. Bhardwaj1, Ankita Sharma1 and Nimit Kumar2
1
Department of Vegetable Science, Dr YS Parmar University of Horticulture and Forestry,
Nauni, Solan-173 230 (H.P.), India
2
Department of Crop Improvement, CSK Himachal Pradesh Krishi Vishvavidyalaya,
Palampur-176062, India
*Corresponding author
ABSTRACT
Keywords
Solanum
lycopersicum L.,
Genetic divergence,
Mahalanobis D2,
Cluster analysis.
Article Info
Accepted:
17 April 2017
Available Online:
10 May 2017
The nature and magnitude of genetic divergence was estimated in 35 genotypes of tomato
using Mahalanobis D2 – statistics. The genetic material revealed considerable amount of
diversity for all the characters investigated. All the genotypes were grouped into 4 clusters.
Maximum number of genotypes was accommodated in cluster III. The intra cluster
distance was maximum in cluster III (3.103) and minimum in cluster IV (2.435). The inter
cluster distance was found maximum to the tune of 4.790 between cluster I and IV and
minimum (2.765) between cluster II and IV, indicating that hybridization between the
genotypes from cluster I and IV can be utilized for getting superior
recombinants/transgressive segregants in segregating generations of tomato. Principal
component (PC) analysis depicted first four PCs with Eigen-value higher than 1
contributing 72.97% of total variability for different traits. The PC-I showed positive
factor loadings for for most of the traits except fruit shape index, number of locules per
fruit, pericarp thickness and harvest duration.
Introduction
Tomato (Solanum lycopersicum L.) is one of
the important vegetables grown throughout
the world and occupying prime position
among processed vegetable. It is one of the
most popular vegetable in India and is grown
in tropical, subtropical and mild cold climate
regions. Varsality of tomato in fresh and
processed form plays major role in its rapid
and wide spread adoption as an important
food
commodity.
Tomato
is
most
remunerative cash crop of mid hills of
Himachal Pradesh being grown as an off
season vegetable for fresh market and supply
the produce to the plains of northern India.
Longer harvesting period and off season
production of tomato make this crop more
suitable for cultivation in mid-hills
conditions. The productivity of tomato grown
in the region is much less than its potential
yield due to the non availability high yielding
disease and insect pest resistant cultivar for
growing in hilly areas. Realizing this, there is
a need for continuous crop improvement in
tomato which can be achieved by isolating
superior breeding lines/varieties having
desirable horticultural traits and insect- pest
1811
Int.J.Curr.Microbiol.App.Sci (2017) 6(5): 1811-1819
resistance. Progress in breeding for economic
characters often depends upon the availability
of germplasm representing a diverse genetic
origin and has crucial role in sustaining and
strengthening the food and nutrition security
of the country. Estimation of genetic distance
is one of appropriate tools for parental
selection in tomato hybridization programs.
Appropriate selection of the parents is
essential to be used in crossing to enhance the
genetic recombination for potential yield
increase. Some appropriate methods, factor
analysis, cluster analysis and PCA, for
parental selection and genetic diversity
identification. D2 statistics offers a reliable
technique to estimate the genetic divergence
available in the population (Mahalanobis,
1936).
Principal
component
analysis
helps
researchers
to
distinguish
significant
relationship between traits. The main
advantage of using PCA over cluster analysis
is that each genotype can be assigned to one
group only. Hybridization programme
involving
genetically
diverse
parents
belonging to different clusters would provide
an opportunity for bringing together gene
constellations of diverse nature. Following
hybridization, these parental combinations
can possibly produce progenies with elevated
genetic variability, thereby increasing chances
of creating superior genotypes with traits of
interest (Crossa and Franco, 2004). For those
traits, where selection is not responsive and
non-additive gene effects are playing major
role in the expressions, hybridization between
diverse parents on the basis of their mean
performance to get superior hybrids or
transgressive segregants or partitioning of
additive genetic variation and non additive
genetic variation in segregating generations
will be useful. Therefore, studies on genetic
divergence will be helpful in identification of
better parents. Keeping this in view, present
investigation was carried out on 35 genotypes
of tomato to study the nature and magnitude
of genetic divergence.
Materials and Methods
The present investigation was carried out at
the experimental farm of the Department of
Vegetable Science, Dr YS Parmar University
of Horticulture and Forestry, Nauni, Solan,
Himachal Pradesh during Kharif season of
2013. Thirty five genotypes of tomato
including one check Solan Lalima were laid
out in a Randomized Complete Block Design
with three replications. The genotypes along
with their sources are presented in Table 1.
The plot size was 2.0 m × 1.8 m with 90 cm
and 30 cm spacing between rows and plants
respectively. The standard cultural practices
recommended in the Package of Practices of
Vegetable Crops were followed to produce a
healthy crop stand (Anonymous, 2013).
Data were recorded on ten randomly selected
plants from each genotype and each
replication and their means were worked out
for statistical analysis. The mean values of
data were subjected to analysis of variance as
described by Gomez and Gomez (1983). The
observations were recorded on days to 50%
flowering, number of fruits per cluster,
number of fruits per plant, average fruit
weight (g), fruit shape index, number of
locules per fruit, pericarp thickness (mm),
plant height (cm), harvest duration (days),
internodal diatance (cm), days to marketable
maturity, total soluble solids (˚Brix), ascorbic
acid content (mg/100g) and fruit yield per
plant (kg).
The data were subjected to Mahalanobis’s D2
statistics (Mahalanobis 1936). Treating D2 as
the generalized statistical distance between a
pair of populations (genotypes), all
populations were grouped into number of
clusters according to method described by
(Rao, 1952). Principal component analysis
1812
Int.J.Curr.Microbiol.App.Sci (2017) 6(5): 1811-1819
was done using computer software Microsoft
Excel along with XLSTAT.
Results and Discussion
The analysis of variance revealed highly
significant differences among the genotypes
for all the characters studied, indicating the
existence of wide genetic divergence among
them. On the basis of performance of various
traits, the clustering pattern of 35 diverse
genotypes of tomato has been presented in the
table 2. All the genotypes were grouped into
4 clusters. Maximum number of genotypes
was accommodated in cluster III (10)
followed by cluster I (9), cluster IV (9) and
cluster II (7), respectively. Average of inter
and intra cluster divergence (D2) values have
been presented in the table 3. The diagonal
figures in the table represent the intra cluster
distances. The intra cluster distance was
maximum in cluster III (3.103) and minimum
in cluster IV (2.435), whereas, highest inter
cluster distance (4.774) was recorded between
I and IV and lowest (2.767) was observed
between cluster II and IV. Since crossing of
genotypes belonging to same cluster do not
expect to yield superior hybrids or segregants,
inter cluster distances were also worked out.
The cluster means for various horticultural
traits have been presented in the table 4.
Minimum days taken to 50% flowering were
recorded in cluster I (30.67). Maximum
number of fruits per cluster was recorded in
cluster II (5.87). Maximum number of fruits
per plant was recorded in cluster IV (35.83)
followed by cluster II (35.71), cluster I
(16.09) and cluster III (13.51). Maximum
average fruit weight was recorded in cluster
IV (64.34) followed by cluster III (62.41),
cluster I (52.71) and cluster II (48.28).
Maximum fruit shape index values for fruit
shape index were recorded in cluster III (1.10)
followed by cluster I (1.01), clusters II (0.93)
and cluster IV (0.88). Minimum number of
locules per fruits was recorded in cluster III
(2.98). Maximum pericarp thickness was
recorded in cluster IV (6.16). Maximum plant
height was recorded in cluster IV (168.78)
followed by cluster II (131.79), cluster III
(85.44) and cluster I (84.35). Maximum
harvest duration was recorded in cluster IV
(36.67) followed by cluster II (35.95), cluster
I (28.96) and cluster III (27.53). Minimum
internodal distance was recorded in cluster II
(9.55) followed by cluster III (9.64), cluster I
(9.67) and cluster IV (10.92). The minimum
days to marketable maturity was recorded in
cluster I (68.56) followed by cluster II
(70.43), cluster IV (71.78) and cluster III
(74.67). Maximum total soluble solids were
recorded in cluster IV (4.16) followed by
cluster III (3.82), cluster II (3.59) and cluster I
(3.59). Maximum ascorbic acid content was
recorded in cluster III (24.02) followed by
cluster IV (23.14), cluster II (19.91) and
cluster I (18.50). Highest fruit yield per plant
was recorded in cluster IV (2.18) followed by
cluster II (1.63), cluster III (0.82) and cluster I
(0.82). Information on genetic diversity was
also used to identify the promising diverse
genotypes, which may be used in further
breeding programmes. Genotypes from same
centre of origin were placed in separate
clusters, indicating wide genetic diversity
among them. This may be due to frequent
exchange of germplasm between different
geographical regions. The inter cluster
distance was maximum between cluster I and
IV and minimum between cluster II and IV,
indicating that hybridization between the
genotypes from cluster I and IV can be
utilized
for
getting
superior
recombinants/transgressive segregants in
segregating generations of tomato.
Furthermore, for getting the reliable
conformity on the basis of cluster means, the
important cluster for different traits were i.e.
cluster I for days to 50% flowering and days
to marketable maturity.
1813
Int.J.Curr.Microbiol.App.Sci (2017) 6(5): 1811-1819
Table.1 List of tomato genotypes studied along with their sources
Sr. No.
Genotype
Source
1
EC-1749/3
NBPGR, New Delhi
2
3
4
5
6
7
8
9
10
11
12
13
14
15
16
17
18
19
20
21
22
23
24
25
26
27
28
29
30
31
32
33
34
35
EC-8910-155
EC-37239
EC-191531
EC-191535-3
EC-267727
EC-535580
EC-620370
EC-620374
EC-620375
EC-620378
EC-620383
EC-620396
EC-620397
EC-620398
EC-620400
EC-620402
EC-620407
EC-620410
EC-620424
EC-620434
EC-620435
JTS-1-1
JTS-1-3
JTS-7-6
JTS-10-1
JTS-10-2
JTS-10-3
JTS-10-10
LE-79-5
BT-1
BT-10
Yalabingo
Arka Keshav
Solan Lalima (Check Variety)
NBPGR, New Delhi
NBPGR, New Delhi
NBPGR, New Delhi
NBPGR, New Delhi
NBPGR, New Delhi
NBPGR, New Delhi
NBPGR, New Delhi
NBPGR, New Delhi
NBPGR, New Delhi
NBPGR, New Delhi
NBPGR, New Delhi
NBPGR, New Delhi
NBPGR, New Delhi
NBPGR, New Delhi
NBPGR, New Delhi
NBPGR, New Delhi
NBPGR, New Delhi
NBPGR, New Delhi
NBPGR, New Delhi
NBPGR, New Delhi
NBPGR, New Delhi
RHRS, Jachh
RHRS, Jachh
RHRS, Jachh
RHRS, Jachh
UHF, Nauni, Solan
UHF, Nauni, Solan
RHRS, Jachh
RHRS, Bajaura
UHF, Nauni, Solan
UHF, Nauni, Solan
UHF, Nauni, Solan
IIHR, Bangalore
UHF, Nauni, Solan
1814
Int.J.Curr.Microbiol.App.Sci (2017) 6(5): 1811-1819
Table.2 Clustering pattern of 35 genotypes of tomato on the basis of genetic divergence
Cluster
Number of genotypes
I
9
II
7
III
10
IV
9
Genotypes
EC-620383, EC-620397, EC-620398, EC-620400, EC620407, EC-620410, EC-620424, EC-620434, BT-1
EC-8910-155, EC-191531, EC-191535-3, EC-535580,
JTS-10-3, JTS-10-10, LE-79-5
EC-620370, EC-620374, EC-620375, EC-620378, EC620396, EC-620402, EC-620435, JTS-1-3, JTS-7-6, Arka
Keshav
EC-1749/3, EC-37239, EC-267727, JTS-1-1, JTS-10-1,
JTS-10-2, BT-10, Yalabingo, Solan Lalima
Table.3 Average intra and inter cluster distance (D2)
Cluster
I
II
III
IV
I
II
III
IV
2.477
3.255
2.982
4.774
2.733
4.244
2.767
3.103
4.697
2.435
Table.4 Cluster mean for different characters among 35 genotypes of tomato
Characters
Days to 50% flowering
Number of fruits per cluster
Number of fruits per plant
Average fruit weight (g)
Fruit shape index
Number of locules per fruit
Pericarp thickness (mm)
Plant height (cm)
Harvest duration (days)
Internodal distance (cm)
Days to marketable maturity
Total soluble solids (o Brix)
Ascorbic acid content (mg/100g)
Fruit yield per plant (kg)
Clusters
I
30.67
4.61
16.09
52.71
1.01
3.43
5.17
84.35
28.96
9.67
68.56
3.59
18.50
0.82
II
32.05
5.87
35.71
48.28
0.93
3.28
5.72
131.79
35.95
9.55
70.43
3.59
19.91
1.63
1815
III
33.13
4.14
13.51
62.41
1.10
2.98
5.35
85.44
27.53
9.64
74.67
3.82
24.02
0.82
IV
33.15
5.30
35.83
64.34
0.88
3.24
6.16
168.78
36.67
10.92
71.78
4.16
23.14
2.18
Int.J.Curr.Microbiol.App.Sci (2017) 6(5): 1811-1819
Table.5 Principal component for 35 genotypes on 14 characters in tomato
DFF
NFPC
NFPP
AFW
FSI
NLPF
PT
PH
HD
ID
DMM
TSS
ASC
FYPP
0.896
0.158
Eigen
value
4.663
2.449
Variability
(%)
33.31
17.49
Cumulative
%
33.310
50.805
PC1
PC2
0.139
0.742
0.646
-0.046
0.908
-0.206
0.067
0.523
-0.659
0.202
-0.080
-0.293
-0.284
0.504
0.923
0.108
0.305
0.355
-0.111
0.834
0.518
0.391
0.144
0.386
PC
0.485
-0.221
0.133
-0.387
0.507
-0.489
0.013
0.105
0.405
PC4
0.120
0.112
-0.140
0.486
0.413
-0.283
0.693
0.337
0.153
0.911
0.201
0.115
0.156
0.180
-0.008
0.266
0.333
0.307
-0.188
1.573
11.24
62.044
0.636
0.205
1.530
10.93
72.969
DFF-Days to 50% flowering, NFPC-Number of fruits per cluster, NFPP-Number of fruits per plant, AFW-Average fruit weight (g),
FSI-Fruit shape index, NLPF-Number of locules per fruit, PT-Pericarp thickness (mm), PH-Plant height (cm), HD-Harvest duration
(days), ID-Internodal distance (cm), DMM-Days to marketable maturity, TSS-Total soluble solids (o Brix), ASC-Ascorbic acid
content (mg/100g), FYPP-Fruit yield per plant (kg)
1816
Int.J.Curr.Microbiol.App.Sci (2017) 6(5): 1811-1819
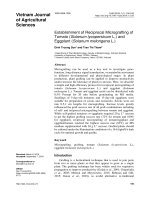
Fig.1 Bi-plot of tomato genotypes for first two principal components
Cluster II for the traits viz., number of fruits
per cluster, number of fruits per plant and
internodal distance, cluster III for fruit shape
index and ascorbic acid content. Cluster IV
for average fruit weight, pericarp thickness,
plant height, harvest duration, total soluble
solids and fruit yield per plant. The genotypes
having wide genetic base and desirable
characteristics can be involved in intraspecific crosses which would lead to
transmission of good genetic gain for various
traits including yield. Earlier workers like Rai
et al., (1998), Mohanty and Prusti (2001),
Mehta et al., (2007), Shashikant et al., (2010),
Pathak and Kumar (2011), Narolia and Reddy
(2012) and Reddy et al., (2013) have also
indicated the significance of genetic
divergence in tomato.
Principal component analysis (PCA)
PCA reflects the importance of the largest
contributor to the total variation at each axis
of differentiation. The eigen values are often
used to determine how many factors to retain.
The sum of the eigen values is usually equal
to the number of variables. Therefore, the
present study revealed that out of 14 principal
components (PCs), four viz., PC-1, PC-II, PCIII and PC-IV had Eigen values >1 and
contributed for 72.97% of total cumulative
variability among different genotypes (Table
5). The contribution of PC-I towards
variability was highest (33.31%) followed by
PC-II, PC-III and PC-IV which contributed
17.49%, 11.24% and 10.93% variability
respectively. The PC-I showed positive factor
loadings for most of the traits except fruit
shape index, number of locules per fruit,
pericarp thickness and harvest duration while
PC-II indicated positive factor loading for
days to 50% flowering, average fruit weight,
fruit shape index, pericarp thickness, plant
height, internodal distance, harvest duration,
total soluble solids, ascorbic acid content and
fruit yield per plant. Traits which contributed
1817
Int.J.Curr.Microbiol.App.Sci (2017) 6(5): 1811-1819
positive factor loadings towards PC-III were
days to 50% flowering, number of fruits per
plant, number of locules per fruit, plant
height, internodal distance, harvest duration
and ascorbic acid content. PC-IV indicated
highest positive factor loading for number of
locules per fruit followed by average fruit
weight and pericarp thickness. It is evident
that fruit yield per plant shows higher
contribution to PC-I and chief contributors to
PC-II. Number of locules per fruit contributed
maximum share in PC-III and PC-IV. These
results clearly indicated that PC (s) analysis in
parallel to characterization of genetic
resources also highlighted certain traits for
exercising selection of interest for practical
breeding purposes. Similar results were found
in earlier article of Krasteva and Dimova
(2007). In further support to our findings,
Merk et al., (2012) reported that first two PC
(s) explained 28% and 16.2% of the variance
and were heavily weighted by measures of
fruit shape and size in tomato.
The first two principal components who
contributed 50.80% towards total variance
were plotted on PC-I x-axis and PC-II on yaxis to detect the association between
different clusters (Fig. 1). It can be seen that
fruit yield per plant was significantly positive
correlated with plant height, number of fruits
per cluster and harvest duration.
In conclusion, present genetic divergence
studies grouped thirty five genotypes of
tomato into four clusters.
The cluster I and IV were found most
divergent, therefore genotypes from these
clusters could be selected for hybridization to
develop promising F1 hybrids or transgressive
segregants in succeeding generations.
Principal component (PC) analysis depicted
first four PC (s) with Eigen-value higher than
1 contributing 72.97% of total variability for
different traits. The PC-I showed positive
factor loadings for for most of the traits
except fruit shape index, number of locules
per fruit, pericarp thickness and harvest
duration.
Acknowledgements
A special thanks to Dr YS Parmar University
of Horticulture and Forestry, Nauni, Solan
(HP) for providing me the necessary facilities
to conduct the investigation.
References
Anonymous. 2013. Package of Practices for
Vegetable Science. Dr YSPUHF Nauni,
Solan, Himachal Pradesh.
Crossa, J., and Franco, D.J. 2004. Statistical
methods for classifying genotypes.
Euphytica, 137: 19-37.
Gomez, K.A., and Gomez, A.A. 1983.
Statistical Procedures for Agricultural
Research. John Wiley and Sons Inc.
New York, USA., pp. 357-427.
Krasteva, L., and Dimova, D. 2007.
Evaluation of a canning determinate
tomato collection using cluster analysis
and principal component analysis
(PCA). Acta Horticulturae, 729: 89-93.
Mahalanobis, P.C. 1936. On the generalized
distance in statistics. Proceedings of
National Academy of Science, (India) 2:
49-55.
Mehta, D.R., I.J. Golani, V.L. Purohit, M.V.
Naliyadhara and Pandya, H.M. 2007.
Genetic diversity in tomato. Orissa J.
Horticulture, 35(2): 70-72.
Merk, H.L., S.C. Yarnes, A.V. Deynez, N.
Tong, N. Menda, L.A. Mueller, M.A.
Mutschler, S.A. Loewen, J.R. Myers
and D.M. Francis. 2012. Trait diversity
and potential for selection indices based
on variation among regionally adapted
processing tomato germplasm. J. Am.
Soc. Hort. Sci., 137(6): 427-437.
Mohanty, B.K., and Prusti, A.M. 2001.
1818
Int.J.Curr.Microbiol.App.Sci (2017) 6(5): 1811-1819
Analysis of genetic distance in tomato.
Res. Crops, 2(3): 382-385.
Narolia, R.K., and Reddy, R.S.K. 2012.
Genetic divergence studies in tomato
(Lycopersicon esculentum Mill.). Crop
Res. Hisar, 44(1/2): 125-128.
Pathak, P., and Kumar, K. 2011. D2 analysis
in some varieties of tomato. Adv. Plant
Sci., 24(1): 335-338.
Rai, N., Y.S. Rajput and Singh, A.K. 1998.
Genetic divergence in tomato using a
non-hierarchical clustering approach.
Veg. Sci., 25(2): 133-135.
Rao, R. 1952. Advanced Statistical Methods
in Biometrical Research. John Willey
and Sons Inc. New York, USA., pp.
357-363.
Reddy, B.R., H. Begum, N. Sunil and Reddy,
T.M. 2013. Genetic divergence studies
in exotic collections of tomato
(Solanum lycopersicum L.). Int. J. Agri.
Sci., 9(2): 588-592.
Shashikanth, B.N., B.C. Patil, M. Salimath,
R.M. Hosamani and Krishnaraj, P.U.
2010. Genetic divergence in tomato
(Solanum lysopersicon [Mill.] Wettsd.).
Karnataka J. Agri. Sci., 23(3): 538-539.
How to cite this article:
Nitish Kumar, M.L. Bhardwaj, Ankita Sharma and Nimit Kumar. 2017. Assessment of Genetic
Divergence in Tomato (Solanum lycopersicum L.) through Clustering and Principal Component
Analysis under Mid Hills Conditions of Himachal Pradesh, India. Int.J.Curr.Microbiol.App.Sci.
6(5): 1811-1819. doi: />
1819