Response of castor (Ricinus communis L.) to varying weather variables and crop geometry with levels of nitrogen under rabi season
Bạn đang xem bản rút gọn của tài liệu. Xem và tải ngay bản đầy đủ của tài liệu tại đây (223.61 KB, 10 trang )
Int.J.Curr.Microbiol.App.Sci (2017) 6(5): 2409-2418
International Journal of Current Microbiology and Applied Sciences
ISSN: 2319-7706 Volume 6 Number 5 (2017) pp. 2409-2418
Journal homepage:
Original Research Article
/>
Response of Castor (Ricinus communis L.) To Varying Weather Variables and
Crop Geometry with Levels of Nitrogen under Rabi Season
Mukesh Kumar Man*, A.U. Amin, K.M. Choudhary and Annu Devi Gora
Department of Agronomy, C.P. College of Agriculture, S.D. Agricultural University,
Sardarkrushinagar 385 506, India
*Corresponding author:
ABSTRACT
Keywords
Castor,
Dates of sowing,
Crop geometry,
Nitrogen
Article Info
Accepted:
25 April 2017
Available Online:
10 May 2017
A field experiment was conducted on loamy sand soil during rabi season of 2011-12 and
2012-13 to find out the response of three weather variables (15 th September, 30th
September and 15th October) and three crop geometry (150 cm x 60 cm, 120 cm x 60 cm
and 90 cm x 60 cm) with two levels of nitrogen (80 kg and 120 kg ha -1) on growth, yield
attributes and yield of castor (Ricinus communis L.). In general, growth and yield attributes
decreased with delay in sowing from 15 th September to 30th October. The growth
characters viz., plant height, number of branches per plant and numbers of nodes up to
primary spike as well as yield attributing parameters viz., length of primary spike, number
of capsules per primary spike, number of effective spikes per plant, seed yield per primary
spike and per plant as well as seed yield of first and second pickings were significantly
higher under early sown crop i.e. 15th September than late sown crop i.e. 15th October. The
growth parameters viz., plant height and number of nodes up to primary spikes was
significantly higher under crop geometry 90 cm x 60 cm than 150 cm x 60 cm crop
geometry. While, number of branches per plant was the significantly maximum under crop
geometry at 150 cm x 60 cm. Significantly the higher values of yield attributes were
recorded under crop geometry of 150 cm x 60 cm as compared to crop geometry of 90 cm
x 60 cm. Both the wider crop geometry i.e. 150 cm x 60 cm and 120 cm x 60 cm were at
par and recorded significantly higher seed and stalk yields as well as productivity per day
than crop geometry of 90 cm x 60 cm. Fertilizing the castor crop with 120 kg N ha -1
significantly increased growth and yield parameters as well as seed and stalk yields of
castor than 80 kg N ha-1. Interaction effect between dates of sowing and crop geometry
was significant and D1xG1 i.e. crop sown on 15th September at 150 cm x 60 cm crop
geometry recorded the maximum number of branches per plant, number of effective spikes
per plant, seed yield per plant, seed yield of first and second pickings.
Introduction
Castor is an important non-edible oilseed crop
grown during the monsoon season mainly for
its seed, from which 40–50% oil is extracted.
It does well both under dry land or rainfed
farming and limited irrigation due to deep
root-system. Its cultivation is becoming
popular in north-western part of the country
owing to its better performance under stress
conditions and higher export potential. Newly
developed genotypes of castor are different
from the traditional ones in terms of
morphology, duration, growth response, and
productivity (Kumar et al., 2003; Raghavaiah
et al., 2003). They also respond differently to
2409
Int.J.Curr.Microbiol.App.Sci (2017) 6(5): 2409-2418
different agro-climatic conditions. In northwestern part of the country, some of rainyseason sown castor genotypes continue to
produce flowers and fruits till April- May.
During this period, these genotypes produce
considerable amount of litter in the form of
leaves, flowers, pods and twigs resulting in
significant contribution to soil organic carbon
content and soil organic carbon content
related
changes
in
physico-chemical
properties of soil. Plant density and N
requirement of genotypes vary substantially
with management practices and agro-climatic
conditions. Considering these factors, the
present study was undertaken to evaluate the
performance of 2 genotypes under different
inter-row spacing and N levels in terms of
productivity, economics and changes in soil
physicochemical
properties
over
the
experimental period.
Materials and Methods
A fixed plot field investigation was conducted
at
S.
D.
Agricultural
University,
Sardarkrushinagar (Gujarat) during the rabi
seasons of 2011-12 and 2012-13 on sandyloam soils, having 185, 41.50 and 289 kg/ha
available N, P and K respectively. The initial
soil organic carbon content, pH and bulk
density were 0.19%, 7.82 and 1.31 Mg/m3
respectively.
Treatment
combinations
comprising 3 dates of sowing (15th
September, 30th September and 15th October)
and three crop geometry (150 cm x 60 cm,
120 cm x 60 cm and 90 cm x 60 cm) with two
levels of nitrogen (80 kg and 120 kg ha-1)
were laid out in a 4 times replicated splitsplit-plot design, where dates of sowing were
allotted to main plots, crop geometry in sub
plots and N levels to sub-sub plots. The crop
was sown according to dates of sowing. The
crop received 25 kg each of P2O5 and 20 kg
sulphur at the time of field preparation. As per
treatment, half dose of nitrogen was applied
as basal dose and remaining quantity of
nitrogen was applied as top dressing in two
equal splits at 35 and 70 DAS in form of urea.
The crop received 2 weedings, at 20 and 40
days after planting, and there was no need of
weeding the crop thereafter. Crop received 6
irrigations during each crop season. The crop
was harvested by picking of matured spikes at
different growth stages. The oil content in
seed was determined using nuclear magnetic
resonance. Five plants were tagged randomly
in the net plot area for sampling in each plot
at 50 days and were used for recording
growth and yield attributes of the crop under
different treatments. Economics such as net
returns and benefit: Cost ratios were worked
out at the existing market rate. The
experiment was conducted on the same site
without any change in the layout plan. Bulk
density, pH and soil organic carbon and
available N content of soil were determined at
the beginning of experiment and after
harvesting of crop. For this purpose, soil
samples were drawn from each treatment and
analysed
for
these
physico-chemical
properties.
Results and Discussion
Effect of dates of sowing
It is evident from Table 1.1 that the plant
population at 30 DAS and at harvest was not
influenced significantly due to different dates
of sowing during the course of investigation
and in pooled data.
The results presented in Table 1.1 revealed
that the effect of dates of sowing on number
of branches per plant was significant. Number
of branches per plant reduced significantly
with each delay in sowing from 15th
September to 15th October. Significantly the
maximum number of branches per plant of
8.00, 7.52 and 7.76 were recorded when crop
was sown on 15th September during 2011-12,
2012-13 and in pooled data also, respectively.
2410
Int.J.Curr.Microbiol.App.Sci (2017) 6(5): 2409-2418
However, significantly the minimum number
of branches per plant of 5.67, 5.37 and 5.52
were observed under late sowing i.e. 15th
October during both the years and also in
pooled data, respectively. Plants under 15th
September got more number of branches for
growth and development due to favourable
climatic condition which might have
encouraged cell division and cell expansion
and led to vigorous vegetative growth. Crop
under delayed sown condition experience
shorter days and lower temperatures from
sowing to emergence and higher temperature
during the later period of growth might be
decreased vegetative growth span of crop
consequently resulted in poor number of
branching per plant and nodes up to primary
spike. These results are analogous to those
reported by DOA (1995), Raghvaiah and
Sudhakara (2000), Sree and Reddy (2003),
Patel et al., (2005) and Srivastava and
Chandra (2010).
Seed yield per primary spike was significantly
affected due to different dates of sowing
(Table 1.1). The data revealed that crop sown
on 15th September recorded the maximum
seed yield per primary spike and was
statistically at par with 30th September sowing
but these both the early sowings viz., 15th
September and 30th September recorded
significantly superior seed yield per primary
spike than late sowing i.e. 15th October. The
seed yield per plant was significantly affected
by different sowing dates are presented in
Table 1.2. Each delay in sowing from 15th
September to 15th October reduced seed yield
significantly. Significantly the maximum
(158.83, 151.30 and 155.06 g) as well as
minimum (116.51, 111.13 and 113.82 g) seed
yield per plant were observed when crop
sown on 15th September and 15th October
during the year 2011-12, 2012-13 well as in
pooled data, respectively. Both the early
sowings i.e. 15th September and 30th
September were at par and recorded
remarkably higher seed yield per primary
spike (Table 1.1) than late sowing i.e. 15th
October. Whereas, seed yield per plant (Table
1.2) reduced significantly with each delay in
sowing from 15th September to 15th October.
Respective increase in seed yield per primary
spikes were 7.32 and 17.98, 5.47 and 16.15 as
well as 6.41 and 17.10 during 2011-12, 201213 and in pooled data due to early sowings
viz., 15th and 30th September than late sowing
i.e. 15th October. Reduction in seed yield per
plant was due to late sowings viz., 30th
September and 15th October were 9.87 and
36.23 per cent as compared to early sowing
i.e. 15th September. Better vegetative growth
in term of plant height and number of
branches per plant under early sowing might
have responsible for increased in yield
attributes which improved seed yield per
primary spike and per plant. On the contrary,
less time for vegetative growth under delayed
sowing might be responsible for poor
vegetative
growth.
Moreover,
poor
synchronization of flowering or capsules
development with lowers temperature which
might
have
affected
fertilization
(Nagabhushanam and Raghavaiah 2005). The
results are complete agreement with those of
Baby Akula and Reddy (1998), Sesha et al.,
(2008) and Srivastava and Chandra (2010).
An appraisal of data (Table 1.2) indicated that
100-seed weight did not differ significantly
due to various dates of sowing during 201112, 2012-13 and also in pooled data,
respectively. However, delay in sowing
reduced 100-seed weight slightly. Similar
findings were reported by Chauhan and
Yakadri (2004).
Oil yield reduced significantly with each
delay in sowing from 15th September to 15th
October (Table 1.2). The significantly
maximum oil yield of 1114, 1015 and 1065
kg ha-1 was recorded under 15th September
sowing during 2011-12, 2012-13 and in
2411
Int.J.Curr.Microbiol.App.Sci (2017) 6(5): 2409-2418
pooled data also. But it was the significantly
lowest when crop was sown on 15th October.
However, oil yield increased remarkably with
each successive early in sowing from 15th
October to 15th September (Table 1.2). The
magnitude of increase in oil yield was to the
tune of 13.0 and 40.0, 14.0 and 41.0 as well as
14.0 and 41.0 per cent with 15th September
sown crop over late sown i.e. 30th September
and 15th October crops during 2011-12, 201213 as well as in pooled data, respectively. The
oil yield is dependent on oil content in seed
and seed yield. Therefore, the higher seed
yield was responsible for higher oil yield
under early sown crop. Reduction, in oil yield
with delayed sowing in rabi season was also
reported by Chauhan et al., (2005) and Sesha
et al., (2008).
Effect of crop geometry
Examination of data given in Table 1.1
indicated that varying crop geometry
exhibited significant influence on plant
population at 30 DAS and at harvest.
Significantly the maximum plant population
was observed at 30 DAS under crop geometry
of 90 cm x 60 cm whereas, it was the
significantly lowest under the wider spacing
of 150 cm x 60 cm during both the years and
in pooled data also.
Number of branches per plant in general
increased with increase in spacing between
two rows from 90 cm to 150 cm but
significant increase was observed up to 120
cm row spacing (Table 1.1). The maximum
number of branches per plant viz., 7.78, 7.33
and 7.56 were recorded under crop geometry
of 150 cm x 60 cm during 2011-12, 2012-13
and in pooled data, respectively and was at
par with geometry of 120 cm x 60 cm. Both
the wider crop geometry was significantly
superior to narrow geometry of 90 cm x 60
cm. The significant effect of crop geometry
was found on number of branches per plant
(Table 1.1). Crop sown under wider crop
geometry of 150 cm x 60 cm and 120 cm x 60
cm were at par and recorded remarkably
higher number of branches per plant than with
crop geometry of 90 cm x 60 cm. The per cent
increase in number of branches per plant due
to wider crop geometry of 150 cm x 60 cm
were 3.87 and 40.69 in 2011-12, 0.83 and
40.15 during 2012-13 as well as 2.44 and
40.52 in pooled data, respectively over closer
crop geometry i.e. 120 cm x 60 cm and 90 cm
x 60 cm. Wider crop geometry provided more
space around each plant resulting in more
metabolic activities through better utilization
of light, space, water and nutrients which
might be turned in better vegetative growth in
term of number of branches per plant. Dense
population under closer crop geometry
reduced number of branches per plant might
be due to less availability of space for each
plant which increased competition among the
plants for available resources. These results
corroborate
with
the
findings
of
Lakshmamma et al., (2003), Singh (2003) and
Venugopal et al., (2007).
Crop sown at geometry of 150 cm x 60 cm
and 120 cm x 60 cm were at par and noted
seed yield per primary spike of 53.87, 50.49
and 52.18 g as well as 52.01, 49.59 and 50.80
g during 2011-12, 2012-13 and in pooled
data, respectively but these both the geometry
were significantly higher than inter and intra
row spacing of 90 cm x 60 cm. Reduction in
crop geometry each from 150 cm x 60 cm to
90 cm x 60cm reduced seed yield per plant
(Table 1.2) significantly. Crop sown at 150
cm x 60 cm produced the significantly
maximum seed yield per plant of 175.25,
169.15 and 172.20 g during 2011-12, 2012-13
and in pooled data, respectively. However, it
was the significantly lowest under crop
geometry of 90 cm x 60 cm. The seed yield
per primary spike (Table 1.1) and seed yield
per plant (Table 1.2) were increased
significantly with increase in inter row
2412
Int.J.Curr.Microbiol.App.Sci (2017) 6(5): 2409-2418
spacing up to 120 cm. The increase in seed
yield per primary spike and seed yield per
plant with crop geometry of 150 cm x 60 cm
were to the tune of 2.72 and 7.10 and as well
as 25.17 and 71.79 per cent on pooled data
basis over crop geometry viz., 120 cm x 60
cm and 90 cm x 60 cm, respectively. This
was due to reflection of yield attributing
characters usually achieved well under
optimum availability of space, where
competition within the crop plant was
minimum. On the other hand, closer crop
geometry might be increased competition
within the crop plant which resulted in poor
growth that decreased the seed yield per
primary spike and seed yield per plant. The
findings are in conformity with those reported
by Singh (2003) and Venugopal et al.,
(2007).
The data showed in Table 1.2 indicated that
the differences in 100-seed weight did not
reach the level of significance due to varying
crop geometry during 2011-12, 2012-13 and
in pooled data also, respectively. Though, the
reduction in crop geometry causes negative
effect on 100-seed weight. Non significant
effect of crop geometry on 100- seed weight
during both the years and in pooled data was
recorded (Table 1.2). This might be due to
100-seed weight was a variety-specific
attribute which was profoundly affected by
genetic parameters, but its quantity was
determined by the conditions at maturity
period, so that these conditions could not
change 100-seed weight (Jalilian et al., 2005).
There results were in accordance with the
reported by Rana et al., (2006) and Patel et
al., (2009).
Data given in Table 1.2 indicated that varying
crop geometry exhibited significant response
on oil yield. When crop was sown under
geometry of 150 cm x 60 cm produced the
maximum oil yield and was at par with 120
cm x 60 cm but these both the crop geometry
were significantly superior than 90 cm x 60
cm during the period of investigation and in
pooled data also. However, the significantly
minimum oil yield of 907, 820 and 860 kg ha1
was obtained under crop geometry of 90 cm
x 60 cm during 2011-12, 2012-13 and in
pooled data, respectively. However, oil yield
(Table 1.2) increased with increasing in crop
geometry from 90 cm x 60 cm to 150 cm x 60
cm but significant increase was found up
to120 cm x 60 cm. Respective per cent
increase in oil yield with crop geometry of
150 cm x 60 cm were to the tune of 1.0 and
10.0, 2.0 and 11.0 as well as 2.0 and 11.0
during 2011-12, 2012-13 as well as in pooled
data also over crop geometry of 120 cm x 60
cm and 90 cm x 60 cm. The oil yield is
dependent on oil content in seed and seed
yield. Higher seed yield at crop geometry of
150 cm x 60 cm responsible for higher oil
yield. The findings are in accordance with the
results reported by Thadoda (1993), Vala et
al., (2000) and Patel et al., (2009).
Effect of levels of nitrogen
The effect of varying levels of nitrogen on
plant population at 30 DAS and at harvest
were non-significant during 2011-12, 2012-13
and in pooled data also.
Data showed in Table 1.2 revealed that the
differences in number of branches per plant
were increased significantly with increase in
nitrogen levels. Crop fertilized with 120 kg N
ha-1 produced the significantly higher number
of branches per plant during the course of
investigation and in pooled data also than
with 80 kg N ha-1. Marked effect of nitrogen
on number of branches per plant was recorded
(Table 1.1). Significantly the more number of
branches was noted with the application of
120 kg N ha-1 which was 28.50, 30.72 and
29.49 per cent higher during 2011-12, 201213 and in pooled data, respectively than
application of 80 kg N ha-1. Thus, increasing
2413
Int.J.Curr.Microbiol.App.Sci (2017) 6(5): 2409-2418
trend in number of branches per plant might
be due to the reason that nitrogen hastens the
metabolic activities in the plant body by
synthesizing the tryptophan, a precursor, for
the auxins, which in turn increased number of
branches per plant. But under limited
availability of nitrogen reduce cell division
and elongation which ultimately reduced
number of branches per plant. The results
obtained in present study are in close
agreement with those reported by Patel et al.,
(2005) and Rana et al., (2006).
An appraisal of data exhibited in Table 1.1
indicated that an application of 120 kg N ha-1
recorded significantly higher seed yield per
primary spike of 53.41, 50.27 and 51.84 g
during 2011-12, 2012-13 and in pooled data,
respectively than that of with 80 kg N ha-1.
The Increase in nitrogen levels from 80 to 120
kg ha-1 increased seed yield per plant
significantly. The seed yield per plant of
143.59, 137.04 and 140.31 g recorded with
application of 120 kg N ha-1 which was
significantly higher than that of with 80 kg N
ha-1 during 2011-12, 2012-13 and in pooled
data, respectively. The increase in level of
nitrogen from 80 to 120 kg ha-1 increased
seed yield per primary spike (Table 1.1) and
seed yield per plant (Table 1.2) significantly.
As compared to 80 kg N ha-1, the per cent
increase in seed yield per primary spike and
per plant with 120 kg N ha-1 were 5.35 and
5.34 in 2011-12, 4.95 and 5.63 in 2012-13 as
well as 5.15 and 5.47 in pooled data,
respectively. This might be due to higher
supply of nitrogen sustained the uptake of
nitrogen at later crop growth stages which
improve vegetative and reproductive growth.
Inadequate availability of nitrogen might have
produced poor vegetative growth as well as
reproductive growth which finally led to less
seed yield per primary spike and plant. The
results are in complete agreement with those
of Patel et al., (2005) and Venugopal et al.,
(2007).
Effect of varying levels of nitrogen on 100seed weight (Table 1.2) was not reach the
level of significant during both the years as
well as in pooled data. But increase in
nitrogen levels showed it beneficial effect on
100-seed weight. Increase the levels of
nitrogen from 80 to 120 kg ha-1 increased oil
yield significantly. The oil yield of 1029, 934
and 981 kg ha-1 was produced by 120 kg N
ha-1 which was significantly higher than the
application of 80 kg N ha-1 during 2011-12,
2012-13 and in pooled data, respectively.
Unlike these, oil yield was significantly
higher with 120 kg N ha-1 than 80 kg N ha-1.
The magnitude of increase in oil yield with
application of 120 kg N ha-1 was 14.20 per
cent than 80 kg N ha-1. Oil yield is dependent
on oil content in seed and seed yield. Increase
in seed yield with increase in nitrogen levels
might be increased the oil yield. The results
obtained in present study are in close
agreement with those reported by Thadoda
(1993), Sree and Reddy (2003), Kathmale et
al., (2008) and Patel et al., (2010).
Significant interaction effects
The data presented in Table 1.1.1 indicated
that the significant interaction effect was
observed due to dates of sowing and crop
geometry. The significantly highest number
of branches per plant of 9.81, 9.04 and 9.42
were recorded when crop sown on 15th
September with crop geometry of 150cm ×
60cm (D1G1) during 2011-12, 2012-13 and in
pooled data, respectively. Each delay in
sowing from 15th September to 15th October
reduced number of branches per plant
significantly in wider spacing i.e. 150cm ×
60cm. Whereas, under closer spacing viz., 90
cm x 60 cm both the late sowings remain at
par and recorded significantly lower number
of branches per plant than early sowing i.e.
15th September. Under crop geometry of 120
cm × 60 cm differences between both the
early sowings were at par but significantly
higher than late sowing.
2414
Int.J.Curr.Microbiol.App.Sci (2017) 6(5): 2409-2418
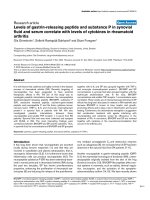
Table.1 Plant population of rabi castor at 30 DAS, number of branches per plant and seed yield per primary spike (g) as influenced by
varying crop geometry and dates of sowing with levels of nitrogen
Plant population per hectare at 30
DAS
Treatments
Dates of sowing (D)
15th September
(D1)
Number of branches per plant
Seed yield per primary spike (g)
2011-12
2012-13
Pooled
2011-12
2012-13
Pooled
2011-12
2012-13
Pooled
14423
14411
14417
8.00
7.52
7.76
56.18
52.42
54.30
th
14338
14226
14282
7.13
6.94
7.04
52.35
49.70
51.03
th
14323
14178
14250
5.67
5.37
5.52
47.62
45.13
46.37
S.Em.±
206
231
201
0.15
0.15
0.15
1.15
1.17
1.16
C.D. at 5 %
C.V. (%)
Crop geometry (G)
150cm X 60cm
(G1)
120cm X 60cm
(G2)
90cm X 60cm
(G3)
S.Em.±
C.D. at 5 %
C.V. (%)
Nitrogen levels (N)
80 kg ha-1
(N1)
NS
7.02
NS
8.10
NS
7.00
0.53
10.78
0.53
11.37
0.53
11.06
3.98
10.85
4.02
11.63
3.99
11.20
10988
13697
18399
238
704
8.10
10862
13550
18403
317
938
10.87
10925
13623
18401
265
786
9.08
7.78
7.49
5.53
0.14
0.40
9.54
7.33
7.27
5.23
0.13
0.37
9.30
7.56
7.38
5.38
0.13
0.39
9.42
53.87
52.01
50.27
0.95
2.81
8.93
50.49
49.59
47.17
0.89
2.64
8.89
52.18
50.80
48.72
0.92
2.72
8.89
14345
14262
14303
6.07
5.73
5.90
50.70
47.90
49.30
14378
14282
14330
7.80
7.49
7.64
53.41
50.27
51.84
223
NS
9.30
215
NS
9.06
214
NS
8.95
0.12
0.35
10.37
0.11
0.33
10.32
0.12
0.34
10.34
0.83
2.41
9.60
0.81
2.34
9.87
0.82
2.37
9.71
-
-
-
DxG
DxG
DxG
-
-
-
(D2)
(D3)
(N2)
30 September
15 October
120 kg ha
S.Em.±
C.D. at 5 %
C.V. (%)
Sig. Interaction
-1
2415
Int.J.Curr.Microbiol.App.Sci (2017) 6(5): 2409-2418
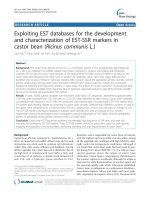
Table.2 Seed yield per plant (g), 100-seed weight (g) and oil yield (kg ha-1) as influenced by varying crop geometry and dates of
sowing with levels of nitrogen on rabi castor
Seed yield per plant (g)
Treatments
2011-12
Dates of sowing (D)
15th September
(D1)
2012-13
Pooled
Oil yield (kg ha-1)
100-seed weight (g)
2011-12
2012-13
Pooled
2011-12
2012-13
Pooled
158.83
151.30
155.06
29.95
29.84
29.90
1114
1015
1065
th
144.51
137.75
141.13
28.14
28.03
28.09
985
889
937
th
15 October
116.51
111.13
113.82
26.78
26.46
26.62
797
719
758
S.Em.±
3.01
3.35
3.18
0.72
0.76
0.74
31
33
32
C.D. at 5 %
C.V. (%)
Crop geometry (G)
150cm X 60cm
(G1)
10.38
10.53
11.57
12.32
10.97
11.40
NS
12.45
NS
13.25
NS
12.79
106
15.63
115
18.66
111
17.03
(D2)
(D3)
30 September
175.25
169.15
172.20
28.61
28.44
28.53
1001
912
957
(G2)
120cm X 60cm
140.96
134.19
137.57
28.44
28.22
28.33
989
891
940
(G3)
90cm X 60cm
S.Em.±
103.64
2.46
96.84
2.48
100.24
2.45
27.82
0.53
27.67
0.53
27.75
0.53
907
26
820
25
863
26
7.27
8.60
7.35
9.12
7.27
8.80
NS
9.23
NS
9.18
NS
9.18
78
13.42
76
14.28
77
13.78
136.31
143.59
129.74
137.04
133.03
140.31
27.84
28.74
27.58
28.65
27.71
28.69
902
1029
815
934
859
981
2.29
6.62
9.82
2.32
6.73
10.46
2.30
6.65
10.09
0.43
NS
9.08
0.44
NS
9.45
0.43
NS
9.22
26
74
15.90
23
67
15.93
24
70
15.85
DxG
DxG
DxG
-
-
-
C.D. at 5 %
C.V. (%)
Nitrogen levels (N)
(N1) 80 kg ha-1
120 kg ha-1
(N2)
S.Em.±
C.D. at 5 %
C.V. (%)
Sig. Interaction
2416
Int.J.Curr.Microbiol.App.Sci (2017) 6(5): 2409-2418
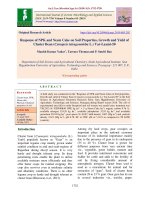
Table.3 Interaction effect of crop geometry and date of sowing on number of branches plant per
plant during 2011-12, 2012-13 and in pooled results
2011-12
G1
G2
9.81
8.10
8.35
7.83
5.27
6.54
0.23
0.69
9.54
Dates of sowing
/Geometry
D1
D2
D3
S.Em.±
C.D. at 5 %
C.V. (%)
2012-13
G1
G2
9.04
7.93
7.96
7.73
5.00
6.15
0.22
0.64
9.30
G3
6.10
5.23
5.20
G3
5.60
5.14
4.95
Pooled
G1
G2
9.42
8.01
8.15
7.78
5.14
6.35
0.23
0.67
9.42
G3
5.85
5.18
5.08
Table.4 Interaction effect of crop geometry and date of sowing on seed yield per plant (g) during
2011-12, 2012-13 and in pooled results
Date of
sowing /
Geometry
D1
D2
D3
S.Em.±
C.D. at 5 %
C.V. (%)
2011-12
G1
G2
2012-13
G3
G1
G2
Pooled
G3
G1
G2
G3
201.17
161.11
114.20
193.64
153.35
106.90
197.41
157.23
110.55
181.97
142.61
147.01
114.77
4.25
12.60
8.60
104.56
92.15
175.37
138.43
139.05
110.16
4.30
12.74
9.12
98.83
84.80
178.67
140.52
143.03
112.46
4.25
12.59
8.80
101.69
88.48
Significant interaction effect was recorded
between dates of sowing and crop geometry
during 2011-12, 2012-13 and in pooled data
also (Table 1.1.2). The significantly
maximum seed yield per plant was recorded
when crop sown on 15th September with
geometry of 150 cm x 60 cm (D1G1).
Significantly the lowest seed yield per plant
was recorded when crop was sown 15th
October at 90 cm x 60 cm crop geometry
(D3G3) during both the years as well as in
pooled data except in 2011-12. Each delay in
sowing with reduced inter row spacing from
150 cm to 90 cm decreased seed yield per
plant significantly during course of
investigation and in pooled data except during
2011-12 where difference between late
sowings i.e. 30th September or 15th October as
well as crop geometry of 90 cm x 60 cm were
non significant.
References
Akula Baby and Reddy Bapi. 1998. Effect of
dates of sowing on yield castor cultivars.
J. Oilseeds Res., 15(2): 375-376.
Chauhan Sreedhar and Yakadri, M. 2004.
Sowing date and genotype effects on
performance of rabi castor (Ricinus
communis L.) in alfisols. J. Res.
ANGRAU, 32(2): 90-92.
Chavan, M., Pujari, B.T. and Lokesha, R.
2005. Available nitrogen content in soil
and its uptake by castor as influenced by
green manures and nitrogen levels on
castor yield. Karnataka J. Agri. Sci.,
18(4): 1078-1080.
DOA. 1995. Effect on dates of sowing on the
yield of actor cultivars (Palem). Annual
Progress Report of All India Co-ordinated
Research Project on Oilseeds, Hyderabad,
2417
Int.J.Curr.Microbiol.App.Sci (2017) 6(5): 2409-2418
pp. 68-69.
Kathmale, D.K., Danawale, N.J. and
Deshpande, A.N. 2008. Effect of spatial
configurations and fertilizer levels on the
performance of castor under dryland
conditions. Indian J. Dry land Agri. Res.
Develop., 23(2): 80-85.
Lakshmamma, P., Lakshmi Prayaga and
Reddy, A. V. (2003). Yield variation due
to nipping of branches in combination
with population manipulations in castor
(Ricinus communis L.). Indian Journal of
Plant Physiology, 8 (1): 70-73.
Nagabhushanam, U. and Raghavaiah, C.V.
2005. Seeding date and irrigation effects
on the productivity and oil quality of postmonsoon grown castor (Ricinus communis
L.) in Alfisols. J. Oilseeds Res., 22(1):
206-208.
Patel, R.M., Patel, M.M. and Patel, G.N.
2010. Effect of preceding kharif crops,
spacing and nitrogen levels on yield and
nutrients uptake by rabi castor. Gujarat
Agri. Univ. Res. J., 3(1): 15-17.
Patel, R.M., Patel, M.M. and Patel, G.N.
2009. Effect of spacing and nitrogen
levels on rabi castor (Ricinus communis
L.) grown under different cropping
sequences in North Gujarat agro-climatic
conditions. J. Oilseeds Res., 26(2): 123125.
Raghvaiah, C.V. and Sudhakara Babu, S.N.
2000. Effect of seedling date, female:
male row proportion and nitrogen on
certified seed production on certified seed
production of GCH 4 (VP 1 x 48 1) castor
hybrid. J. Oilseeds Res., 7(1): 100-106.
Rana, D.S., Giri, G. and Pachauri, D.K. 2006.
Evaluation of castor (Ricinus communis
L.)
genotypes
for
productivity,
economics, litter fall and changes in soil
properties under different levels of interrow spacing and nitrogen. Indian J.
Agronomy, 51(4): 318-322.
Sesha, P., Saila Sree, B., Bhaskar Reddy and
D., Swapna Sree. 2008. Performance of
castor cultivars at different dates of
sowing in rice fallows. J. Agri. Res.,
42(2): 125-128.
Sree, P.S. and Reddy, B.B. 2003.
Performance of castor cultivars at
different dates of sowing. Annals of Agri.
Res., 24(3): 546-551.
Srivastava, S.K. and Chandra, D.R. 2010.
Effect of sowing dates on growth and
productivity of castor (Ricinus communis
L.) genotypes in central agro-climatic
zone of Uttar Pradesh. J. Oilseeds Res,
27(2): 190-191.
Vala, G.M., Khanpara, V.D., Kaneria, B.B.
and Mathukia, R.K. 2000. Performance of
castor (Ricinus communis L.) genotypes
under various sowing times and row
spacing in summer season. Gujarat Agric.
Univ. Res. J., 26(1): 12-15.
Venugopal, C., Reddy, G. K. and Reddy, G.P.
2007. Growth attributes, nitrogen uptake
and seed yield of rainfed castor as
influenced by plant geometry and nitrogen
levels. J. Res. ANGRAU, 35(3): 78-81.
How to cite this article:
Mukesh Kumar Man, A.U. Amin, K.M. Choudhary and Annu Devi Gora. 2017. Response of
Castor (Ricinus communis L.) To Varying Weather Variables and Crop Geometry with Levels
of Nitrogen under Rabi Season. Int.J.Curr.Microbiol.App.Sci. 6(5): 2409-2418.
doi: />
2418