Agreement between MRI and pathologic breast tumor size after neoadjuvant chemotherapy, and comparison with alternative tests: Individual patient data meta-analysis
Bạn đang xem bản rút gọn của tài liệu. Xem và tải ngay bản đầy đủ của tài liệu tại đây (648.16 KB, 12 trang )
Marinovich et al. BMC Cancer (2015) 15:662
DOI 10.1186/s12885-015-1664-4
RESEARCH ARTICLE
Open Access
Agreement between MRI and pathologic
breast tumor size after neoadjuvant
chemotherapy, and comparison with
alternative tests: individual patient data
meta-analysis
Michael L. Marinovich1*, Petra Macaskill1, Les Irwig1, Francesco Sardanelli2, Eleftherios Mamounas3,
Gunter von Minckwitz4, Valentina Guarneri5, Savannah C. Partridge6, Frances C. Wright7, Jae Hyuck Choi8,
Madhumita Bhattacharyya9, Laura Martincich10, Eren Yeh11, Viviana Londero12 and Nehmat Houssami1
Abstract
Background: Magnetic resonance imaging (MRI) may guide breast cancer surgery by measuring residual tumor
size post-neoadjuvant chemotherapy (NAC). Accurate measurement may avoid overly radical surgery or reduce the
need for repeat surgery. This individual patient data (IPD) meta-analysis examines MRI’s agreement with pathology
in measuring the longest tumor diameter and compares MRI with alternative tests.
Methods: A systematic review of MEDLINE, EMBASE, PREMEDLINE, Database of Abstracts of Reviews of Effects,
Heath Technology Assessment, and Cochrane databases identified eligible studies. Primary study authors supplied
IPD in a template format constructed a priori. Mean differences (MDs) between tests and pathology (i.e. systematic
bias) were calculated and pooled by the inverse variance method; limits of agreement (LOA) were estimated. Test
measurements of 0.0 cm in the presence of pathologic residual tumor, and measurements >0.0 cm despite pathologic
complete response (pCR) were described for MRI and alternative tests.
Results: Eight studies contributed IPD (N = 300). The pooled MD for MRI was 0.0 cm (LOA: +/−3.8 cm). Ultrasound
underestimated pathologic size (MD: −0.3 cm) relative to MRI (MD: 0.1 cm), with comparable LOA. MDs were similar for
MRI (0.1 cm) and mammography (0.0 cm), with wider LOA for mammography. Clinical examination underestimated
size (MD: −0.8 cm) relative to MRI (MD: 0.0 cm), with wider LOA. Tumors “missed” by MRI typically measured 2.0 cm or
less at pathology; tumors >2.0 cm were more commonly “missed” by clinical examination (9.3 %). MRI measurements
>5.0 cm occurred in 5.3 % of patients with pCR, but were more frequent for mammography (46.2 %).
Conclusions: There was no systematic bias in MRI tumor measurement, but LOA are large enough to be clinically
important. MRI’s performance was generally superior to ultrasound, mammography, and clinical examination, and it
may be considered the most appropriate test in this setting. Test combinations should be explored in future studies.
Keywords: Breast cancer, Neoadjuvant chemotherapy, Magnetic resonance imaging, Tumor response, Monitoring
* Correspondence:
1
Screening and Test Evaluation Program (STEP), Sydney School of Public
Health, The University of Sydney, A27, Edward Ford Building, Sydney, NSW
2006, Australia
Full list of author information is available at the end of the article
© 2015 Marinovich et al. Open Access This article is distributed under the terms of the Creative Commons Attribution 4.0
International License ( which permits unrestricted use, distribution, and
reproduction in any medium, provided you give appropriate credit to the original author(s) and the source, provide a link to
the Creative Commons license, and indicate if changes were made. The Creative Commons Public Domain Dedication waiver
( applies to the data made available in this article, unless otherwise stated.
Marinovich et al. BMC Cancer (2015) 15:662
Background
Magnetic resonance imaging (MRI) has been proposed to
have a role in guiding breast cancer surgery by measuring
the size of residual tumor after neoadjuvant chemotherapy
(NAC), and has been shown to have high sensitivity for
detecting residual disease [1]. Given that guidelines recommend assessment of the largest tumor diameter [2],
estimation of the largest diameter by MRI may guide decisions about whether subsequent mastectomy or breast
conserving surgery (BCS) should be attempted, as well as
assist in planning resection to achieve clear margins in
BCS. Underestimation of tumor size may therefore lead to
involved surgical margins and repeat surgery; overestimation may lead to overly radical surgery (including mastectomy when BCS may have been possible), and poorer
cosmetic and psychosocial outcomes [3].
Tumor size measurement is subject to potential errors,
and both tumor characteristics and imaging limitations
may differentially affect the measurement accuracy of tests
used for this purpose. MRI may over- or underestimate
tumor size due to artefacts such as partial volume effects
[4] or disruptions to signal intensity from marker placement [5]. Tumors may not be well visualised by mammography in patients with dense breasts [6] or multifocal
cancer [7]. Ultrasound (US) measurements may be compromised by unclear margins [8], acoustic shadowing [9]
or limitations in the field of view [10]. Imaging modalities
also differ in their ability to visualise ductal carcinoma in
situ (DCIS) [11]. The inherent pliability of breast tissue
also means that tumor dimensions may vary depending
on patient positioning [12]; therefore, differences in measurements undertaken in upright (mammography), supine
(US) and prone positions (MRI) may arise. Furthermore,
the effects of NAC may introduce greater bias in residual
tumor measurement relative to the preoperative setting:
reactive inflammation, fibrosis or necrosis may be difficult
to distinguish from residual tumor [13], and measurement
errors may be additive when tumors regress as multiple,
scattered deposits [2].
While many studies have sought to assess the relative
ability of MRI and other tests to estimate tumor size
after NAC, conclusions have been hampered by small
sample sizes and inadequate statistical methods. A previous study-level meta-analysis demonstrated that misleading conclusions about the accuracy of MRI may
result from inappropriate analytic methods that do not
measure agreement between clinical measures (e.g. Pearson or Spearman correlation coefficients) [14]. However,
that meta-analysis was limited in its ability to estimate
the agreement between MRI and pathologic measurements, and to compare MRI with alternative tests, due
to numerous shortcomings in the available data. For
example, inconsistencies in measurement between studies,
such as the inclusion or exclusion of residual ductal
Page 2 of 12
carcinoma in situ (DCIS) in pathologic tumour measurements, may differentially affect the measurement accuracy
of MRI and other tests, and also limit the clinical applicability of pooled estimates. Comparison of MRI and other
tests was also hampered by the tests being reported for
different (or, at best, overlapping) patient groups, for which
test performance may vary. Furthermore, a fundamental
limitation was that assessing the validity of assumptions
underlying the recommended statistical methods (mean
differences and limits of agreement [15]) was often not
possible due to inadequate reporting.
To address those limitations, we investigated agreement between MRI-measured and pathologic tumor size
after NAC in an individual patient data (IPD) metaanalysis of a large number of breast cancer patients,
using appropriate methods for evaluating the agreement
between measurements [15]. Key differences between
this and the previous study-level meta-analysis are summarised in Additional file 1: Appendix 1. The IPD methodology allowed us to standardise tumor measurements
to include invasive cancer only, explore agreement only
when residual tumor is truly present, and describe MRI
measurement errors in detail. In addition, our study
extended previous work by exploring agreement by characteristics that have been suggested to contribute to inaccurate measurement (NAC agents and HER2 status)
[16, 17], and examining MRI’s agreement compared with
and in addition to alternative tests (US, mammography,
clinical examination) when the tests were conducted in
the same patients [18].
Methods
Identification of studies
A systematic literature search up to February 2011 was
undertaken to identify studies of MRI for measuring residual tumor after NAC. MEDLINE and EMBASE were
searched via EMBASE.com; PREMEDLINE, Database of
Abstracts of Reviews of Effects, Heath Technology Assessment, and Cochrane databases were searched via
Ovid. Search terms linked MRI with breast cancer and
response to NAC. Keywords and medical subject headings included ‘breast cancer’, ‘nuclear magnetic resonance imaging’, ‘MRI’, ‘neoadjuvant’, and ‘response’. The
full search strategy has been reported previously [1, 19].
Reference lists were also searched and content experts
consulted to identify additional studies.
Review of studies and eligibility criteria
Abstracts were screened for eligibility by one author
(MLM); a sample of 10 % was assessed independently
(NH) to ensure consistent application of eligibility criteria.
There were no changes to eligibility criteria or coding
schemes based on the independent assessment. Eligible
studies enrolled ≥15 patients with newly diagnosed breast
Marinovich et al. BMC Cancer (2015) 15:662
cancer undergoing NAC, with MRI and at least one other
test (US, mammography, clinical examination) after NAC
to assess residual tumor size (longest diameter) prior to
surgery.
Potentially eligible citations were reviewed in full
(MLM or NH). The screening and inclusion process is
summarised in Additional file 1: Appendix 2.
Individual patient data
A research protocol and database template were drafted a
priori, specifying the study rationale and objectives, IPD
requirements, and planned statistical analyses (Additional
file 1: Appendix 3). Those documents were forwarded to
the authors of eligible studies with an invitation to participate in the IPD meta-analysis, with email follow-up if no
response was received.
For each participating study, data irregularities were
discussed with the authors. Non-numeric tumor measurements were treated as missing data. Observations
with missing pathologic measurements were excluded.
Pathologic measurements considered residual invasive
components only; therefore, the definition of pathologic
complete response (pCR) was standardised across studies as the absence of residual invasive cancer, with or
without the presence of DCIS (i.e. a pathologic measurement of 0.0 cm) [20].
Statistical analysis
For individual studies, Bland-Altman scatterplots of the
differences between measurements by the relevant tests
and pathology (vertical axis) and their mean (horizontal
axis) were constructed. Plots were examined to assess
whether the differences were normally distributed and independent from the underlying size of the measurements
[15]. Scatterplots of log-transformed measurements were
also constructed to assess whether underlying relationships were improved. Preliminary mixed linear models
(PROC MIXED in SAS) of the difference between measurements by their mean, and pathologic size by MRI size,
were unstable and are not reported.
For patients with residual tumor at pathology, measurement biases were estimated as the absolute mean
differences (MDs) between MRI, comparator tests and
pathology; the associated 95 % limits of agreement (LOA)
were also calculated for each study [15]. Relative MDs
were derived by exponentiation of the difference of logtransformed measurements. MDs were pooled by the
inverse variance method using RevMan 5.2. A fixed effect
was assumed unless statistically significant heterogeneity
was present, as assessed by the Cochrane Q statistic. The
extent of heterogeneity was quantified by the I2 statistic
[21]. To estimate the 95 % LOA for a pooled MD, a
pooled variance was computed under the assumption that
the variance of the differences was equal across studies.
Page 3 of 12
The pooled variance was calculated as the weighted average
of these within-study variances, weighted by the corresponding degrees of freedom for each study (i.e. an extension of the approach used for a two sample t-test [22]).
In addition, test measurements of 0.0 cm in the presence of pathologic residual tumor, and measurements
>0.0 cm despite pCR were described for MRI and comparator tests. Exact 95 % confidence intervals for proportions were computed (SAS version 9.2). Paired differences
between tests were tested with McNemar’s test. Differences in characteristics between patients with and without
tumor measurements by comparator tests were compared
with independent samples t-tests for continuous variables
and with chi-squared or Fisher’s exact tests for categorical
variables.
All tests of statistical significance were two-sided. Except for tests of heterogeneity (p < 0.10), the level chosen
for statistical significance was p < 0.05; p ≤ 0.10 was considered to represent weak evidence of a difference [23].
Results
Study characteristics
A total of 2108 citations were identified. Twenty-four studies (1228 patients) were eligible for inclusion [13, 24–46];
eight of those contributed IPD to this analysis (300 patients) [13, 24, 25, 29, 34, 38, 44, 46] (Additional file 1:
Appendix 2). Agreement between residual tumor size
by tests and pathology was compared for MRI and US
in five studies [13, 29, 34, 38, 46]; MRI and mammography in four studies [13, 24, 34, 38]; and MRI and clinical examination in three studies [13, 24, 25]. For one
study [44], MRI and pathologic measurements were
provided but data for alternative tests were unavailable.
Characteristics of the included studies are presented in
Table 1. Included studies were generally representative of
the broader population of studies reported previously,
based qualitative comparison of aggregate descriptive characteristics [14]. However, patients in this analysis were more
likely to have had T3 tumors or stage III disease; were more
commonly treated with anthracycline-taxane-based NAC;
and had a shorter time between MRI and surgery.
Technical characteristics of MRI are presented in
Additional file 1: Appendix 4. The majority of studies
used dynamic contrast-enhanced MRI (88 %) with a 1.5-T
magnet (75 %). Dedicated bilateral breast coils were used
in all studies reporting the coil type. All studies providing
detail on contrast employed gadolinium-based materials,
most commonly gadopentetate dimeglumine (62 %), at
the standard dosage of 0.1 mmol/kg body weight (75 %).
Pathology from surgical excision was the reference
standard for all patients in all but one study [34], where
pCR was verified by localisation biopsy in two cases
(0.7 % of all patients).
Marinovich et al. BMC Cancer (2015) 15:662
Page 4 of 12
Table 1 Summary of cohort, tumour, treatment and reference standard characteristics of studies included in the individual patient
data analysis
Study level estimates
Variable
Patients (%)
Median
IQR
Range
N patients with MRI (8 studies)
300 (NA)
36
28 – 50
13 – 59
Recruitment mid-point (year) (4 studies)
144 (NA)
2003
2001 – 2005
2001 – 2006
Age, mean or median (years) (8 studies)
300 (NA)
47
46 – 48
43 – 49
Pre
51 (72.9)
64.6
60.4 – 68.8
60.4 – 68.8
Peri/post
19 (27.1)
25.0
18.8 – 31.2
18.8 – 31.2
136 (NA)
4.6
4.2 – 6.6
4.0 – 8.2
T1
5 (2.9)
2.9
1.0 – 5.0
0.0 – 6.2
T2
62 (35.8)
43.0
23.9 – 50.3
6.2 – 56.2
T3
78 (45.1)
43.6
38.3 – 49.1
37.5 – 50.0
T4
28 (16.2)
9.8
0.0 – 30.6
0.0 – 41.7
I
1 (0.5)
0.0
0.0 – 0.0
0.0 – 3.1
II
131 (59.0)
66.1
45.0 – 78.0
27.1 – 86.7
III
83 (37.4)
32.3
22.0 – 37.5
0.0 – 72.9
IV
7 (3.2)
0.0
0.0 – 0.0
0.0 – 17.5
191 (84.1)
86.2
74.2 – 87.8
68.8 – 90.0
Cohort characteristics
Menopausal status (%)a (2 studies)
Tumour characteristics
Clinical size, mean or median (cm)a (4 studies)
a
T stage (%) (4 studies)
Stage (%)a (6 studies)
Histology (%)a (6 studies)
IDC
ILC or IDC/ILC
19 (8.4)
9.8
5.1 – 10.0
4.9 – 18.8
Other
17 (7.5)
7.9
4.0 – 12.5
0.0 – 16.1
Positive
109 (72.2)
71.0
62.5 – 80.6
56.2 – 87.8
Negative
42 (27.8)
29.0
19.4 – 37.5
12.2 – 43.8
a
Nodal status (%) (4 studies)
ER (%)a (5 studies)
Positive
113 (60.1)
62.5
60.0 – 64.4
45.0 – 69.2
Negative
73 (38.8)
37.5
32.2 – 40.0
15.4 – 55.0
Unknown or NR
2 (1.1)
0.0
0.0 – 0.0
0.0 – 3.4
Positive
71 (44.9)
41.2
32.9 – 49.8
30.8 – 52.1
Negative
84 (53.2)
51.5
47.5 – 59.4
48.5 – 65.0
Unknown or NR
3 (1.9)
1.0
0.0 – 2.7
0.0 – 3.4
Positive
42 (28.8)
29.2
22.5 – 33.9
22.5 – 33.9
Negative
97 (66.4)
62.5
61.0 – 77.5
61.0 – 77.5
Unknown or NR
7 (4.8)
5.1
0.0 – 8.3
0.0 – 8.3
PR (%)a (4 studies)
HER2 (%) (3 studies)
Marinovich et al. BMC Cancer (2015) 15:662
Page 5 of 12
Table 1 Summary of cohort, tumour, treatment and reference standard characteristics of studies included in the individual patient
data analysis (Continued)
Treatment
NAC regimen (%)a (8 studies)
Anthracycline-based
115 (38.1)
9.3
0.0 – 77.6
0.0 – 100.0
Antracycline-taxane-based
181 (59.9)
88.1
17.4 – 100.0
0.0 – 100.0
Other
6 (2.0)
0.0
0.0 – 2.5
0.0 – 100.0
Trastuzumab used
29 (19.6)
7.3
2.1 – 42.4
2.1 – 42.4
Trastuzumab not used
119 (80.4)
92.7
57.6 – 97.9
57.6 – 97.9
BCS
132 (43.1)
50.3
37.6 – 55.9
6.2 – 59.4
Mastectomy
172 (56.2)
57.2
44.1 – 63.8
34.4 – 93.8
2 (0.7)
0.0
0.0 – 0.0
0.0 – 6.2
298 (99.3)
100.0
100.0 – 100.0
93.8 – 100.0
Trastuzumab (%)a (3 studies)
Type of surgery (%)a (8 studies)
No surgery
b
Reference standard
Type of reference standard (%) (8 studies)
Pathology
2 (0.7)
0.0
0.0 – 0.0
0.0 – 6.2
Time from MRI to surgery, mean or median/estimate (days) (6 studies)
228 (NA)
16
12 – 25
7 - 28
Prevalence of pCR (%) (8 studies)
300 (NA)
19.0
15.5 – 23.4
7.1 – 27.5
Other
b
BCS breast conserving surgery, DCIS ductal carcinoma in situ, ER estrogen receptor, HER2 human epidermal growth factor receptor 2, IDC invasive ductal
carcinoma, ILC invasive lobular carcinoma, IQR inter-quartile range, MRI magnetic resonance imaging, NA not applicable, NAC neoadjuvant chemotherapy, NR not
reported, pCR pathologic complete response, PR progesterone receptor
a
Calculation of values based on total number of patients enrolled, a minority of whom may not have contributed data to this analysis
b
Localisation biopsy showed the absence of residual tumour (i.e. pathologic measurement of 0.0 cm)
MRI when residual tumor present at pathology
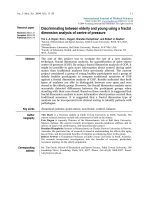
Figure 1a describes the size of residual tumor present at
pathology (N = 243) that was “missed” by MRI (i.e. MRI
tumor measurements of 0.0 cm). Patients for whom MRI
truly detected residual tumor (i.e. measurements > 0.0 cm)
are also included in the column labelled “not applicable”
(N/A). Pathologic measurements of tumors “missed” by
MRI ranged between 0.1-11.0 cm (median = 0.6 cm), and
measured 0.1-1.0 cm for 12 patients (4.9 %); 1.1-2.0 cm
for four patients (1.6 %); 2.1-3.0 cm for one patient
(0.8 %); and >7.0 cm for one patient (0.8 %).
Study-specific Bland-Altman plots, MDs and LOA between MRI and pathology are presented in Additional
file 1: Appendix 5. The plots suggested a tendency in
some studies for larger differences with increasing tumor
size; underlying relationships were not uniformly improved by log transformation (Additional file 1: Appendix
5). Similar relationships were also apparent for US, mammography and clinical examination (Additional file 1: Appendices 6–8). Analyses of absolute differences between
tests and pathology are reported here; analyses of relative
(log) differences were comparable, and are presented in
Additional file 1: Appendices 9–10.
Meta-analysis of MDs between MRI and pathology
(Table 2; Additional file 1: Appendix 11) showed no systematic bias in MRI’s estimation of pathologic tumor size
(pooled MD = 0.0 cm [95 % CI: −0.1-0.2 cm]), with no
evidence of heterogeneity (I2 = 0 %). Scatterplots showed
both over- and underestimation by MRI (Additional file 1:
Appendix 5). Pooled LOA indicated that 95 % of pathologic measurements fall between +/−3.8 cm of the MRI
measurement.
MRI versus US
In 123 patients with pathologic residual tumor and paired
measurements by MRI and US, distributions of pathologic
size were comparable when either test measured 0.0 cm;
tumors “missed” by each test typically measured ≤2.0 cm,
with one MRI measurement in the range of 2.1-3.0 cm
(Fig. 1b).
Pooled MDs showed a tendency for MRI to slightly overestimate pathologic tumor size (MD = 0.1 cm) with no evidence of heterogeneity (I2 = 0 %) (Table 2; Additional file 1:
Appendix 11). A larger tendency for underestimation by
US (MD = −0.3 cm) was observed with substantial heterogeneity (Q = 13.11, df = 4, p = 0.01; I2 = 69 %); the pooled
MD did not change when a fixed or random effect(s) were
assumed. Pooled differences between MRI and US showed
only weak evidence of a difference between the measurements (assuming random effects, p = 0.10). Pooled LOA
were comparable for MRI (+/−2.8 cm) and US (+/−2.6 cm)
(Table 2), with both over- and underestimation observed
Marinovich et al. BMC Cancer (2015) 15:662
Page 6 of 12
(b) MRI versus US (N=123)
(a) MRI alone (N=243)
MRI
180
70
160
60
140
50
120
40
100
80
30
60
20
40
10
20
0
0
0.1-1.0 1.1-2.0 2.1-3.0 3.1-4.0 4.1-5.0 5.1-6.0 6.1-7.0
Percent of patients with residual tumor (%)
Percent of patients with residual tumor (%)
80
90
Number of patients with residual tumor (N)
200
N/A*
MRI
220
30
20
10
10
0
0.1-1.0 1.1-2.0 2.1-3.0 3.1-4.0 4.1-5.0 5.1-6.0 6.1-7.0
> 7.0
60
50
40
40
30
30
20
20
10
0
> 7.0
Pathologic measurement of residual tumor when MRI or mammography
measure 0.0 (cm)
Percent of patients with residual tumor (%)
50
MRI
100
Clinical examination
90
80
80
70
70
60
60
50
50
40
40
30
30
20
20
10
10
0
0
N/A*
0.1-1.0 1.1-2.0 2.1-3.0 3.1-4.0 4.1-5.0 5.1-6.0 6.1-7.0
Number of patients with residual tumor (N)
60
70
0
40
20
90
Number of patienrs with residual tumor (N)
Percent of patietns with residual tumor (%)
50
30
(d) MRI versus clinical examination (N=107)
70
0.1-1.0 1.1-2.0 2.1-3.0 3.1-4.0 4.1-5.0 5.1-6.0 6.1-7.0
60
40
Pathologic measurements of residual tumor when MRI or US measure 0.0 (cm)
Mammography
10
70
50
0
MRI
N/A*
80
60
N/A*
(c) MRI versus mammography (N=78)
80
100
90
70
> 7.0
Pathologic measurements of residual tumor when MRI measures 0.0 (cm)
90
110
US
80
Number of patienrs with residual tumor (N)
90
> 7.0
Pathologic measurement of residual tumor when MRI or clinical examination
measure 0.0 (cm)
Fig. 1 Pathologic size (cm) of tumor “missed” by MRI for: a all patients with residual tumor (N = 243); and compared with b US (N = 123),
c mammography (N = 78), and d clinical examination (N = 107). MRI = magnetic resonance imaging; N/A = not applicable; US = ultrasound.
*Pathology and test(s) measure > 0.0 cm (i.e. residual tumor was not “missed” by MRI or alternative tests).
for both tests (Additional file 1: Appendices 5–6). Combining MRI and US measurements by taking their mean resulted in slight underestimation (MD = −0.1 cm), with a
small reduction in LOA compared with either test alone
(+/−2.3 cm).
US measurements were not possible (due to large or
diffuse lesions, or acoustic shadowing on US images) in
14 patients (10.2 % of patients with MRI). Patients without US had significantly larger tumors at pathology
(mean 5.3 vs 2.0 cm; p = 0.003); were more likely to be
diagnosed with advanced (stage III/IV) disease (83.3 %
vs 32.3 %; p = 0.001); were less likely to have received
taxane-based NAC (38.5 % vs 74.0 %; p = 0.02); and were
more likely to have undergone mastectomy (78.6 % vs
46.3 %; p = 0.02) than patients with US measurements.
For the 14 patients without US, the MD between MRI
and pathology was −1.5 cm (95 % CI: −3.1-0.1 cm) and
the LOA were +/−6.0 cm (Table 2).
MRI versus mammography
For patients with pathologic residual tumor and measurements by MRI and mammography (N = 78), tumors
with measurements of 0.0 cm by the tests typically
measured ≤2.0 cm at pathology (Fig. 1c); however, the
proportion of “missed” tumors within that range was
higher for mammography (23.1 %) than MRI (10.3 %;
p = 0.002). Mammography “missed” two tumors measuring >6.0 cm; one of those (measuring 11.0 cm) also
measured 0.0 cm on MRI.
Pooled MDs showed a tendency for MRI to slightly overestimate pathologic tumor size (MD = 0.1 cm) with no evidence of heterogeneity (I2 = 0 %) (Table 2; Additional file 1:
Appendix 11). No systematic bias was observed for
mammography (MD = 0.0 cm), but moderate heterogeneity was present (I2 = 39 %). No evidence of a difference between MRI and mammographic measurements
was observed (assuming a fixed effect, p = 0.59). Pooled
LOA for mammography (+/−5.0 cm) were wider than for
MRI (+/−4.1 cm) (Table 2); over- and underestimation
were observed for both tests (Additional file 1: Appendices
5 and 7). Combining MRI and mammography by taking
their mean did not improve the MD (0.1 cm) or LOA
(+/−4.2 cm) over MRI alone.
Tumor measurements by mammography were not
possible (due to dense breasts, tumor margins no longer
being assessable, or tumor not being visible) for 25 patients (24.3 % of patients with MRI). Patients without
mammography were significantly younger (mean 42 vs
47 years; p = 0.03) than patients with mammographic
measurements. For those patients, the MD between MRI
and pathology was 0.0 cm (95 % CI −0.7-0.7 cm) and the
LOA were +/−3.5 cm (Table 2).
Marinovich et al. BMC Cancer (2015) 15:662
Page 7 of 12
Table 2 Pooled absolute differences (cm) (fixed effect unless noted) and limits of agreement for studies and patients comparing the
respective tests
N (studies)
N (patients)
Pooled MD (cm) (95 % CI)
I2
LOA (cm)
8
243
0.0 (−0.1, 0.2)
0%
+/−3.8
MRI vs pathology
5
123
0.1 (−0.2, 0.3)
0%
+/− 2.8
a
US vs pathology
5
123
−0.3 (−0.6, 0.1)
69 %
+/− 2.6
MRI and US (mean) vs pathology
5
123
−0.1 (−0.3, 0.1)
16 %
+/− 2.3
All studies and patients
MRI vs pathology
Studies of MRI vs US
a
MRI vs US
5
123
0.3 (−0.1, 0.7)
81 %
NA
MRI vs pathology (patients without US)b
3
14
−1.5 (−3.1, 0.1)
NA
+/− 6.0
MRI vs pathology
4
78
0.1 (−0.1, 0.3)
0%
+/− 4.1
Mammography vs pathology
4
78
0.0 (−0.3, 0.4)
39 %
+/− 5.0
MRI and mammography (mean) vs pathology
4
78
0.1 (−0.1, 0.4)
21 %
+/− 4.2
Studies of MRI vs mammography
MRI vs mammography
4
78
0.1 (−0.2, 0.4)
0%
NA
MRI vs pathology (patients without mammography)b
3
25
0.0 (−0.7, 0.7)
NA
+/− 3.5
3
107
0.0 (−0.2, 0.3)
0%
+/− 4.2
Clinical examination vs pathology
3
107
−0.8 (−1.5, −0.1)*
57 %
+/− 5.1
MRI and clinical examination (mean) vs pathology
3
107
−0.2 (−0.5, 0.1)
9%
+/− 4.1
Studies of MRI vs clinical examination
MRI vs pathology
a
a
3
107
0.9 (0.2, 1.5)*
56 %
NA
MRI vs pathology (patients without clinical examination)b
2
3
NAc
NAc
NAc
MRI vs clinical examination
CI confidence interval, LOA limits of agreement, MD mean difference, MRI magnetic resonance imaging, NA not applicable, US ultrasound
*p < 0.01
a
Random effects
b
Patients without comparator test combined as a single data set. Pooled meta-analysis not undertaken
c
Not calculated due to small number of patients
MRI versus clinical examination
For 107 patients with pathologic residual tumor and
paired measurements by MRI and clinical examination,
tumors “missed” by MRI measured ≤2.0 cm at pathology
in all but one case (0.9 %), but 10 patients (9.3 %) with
measurements of 0.0 cm by clinical examination had
pathologic residual tumor >2.0 cm (p = 0.003). Both tests
“missed” one tumor with a pathologic measurement of
11.0 cm (Fig. 1d).
Pooled MDs showed no systematic bias in MRI’s estimation of pathologic tumor size (MD = 0.0 cm) with no
evidence of heterogeneity (I2 = 0 %) (Table 2; Additional
file 1: Appendix 11). A relatively large tendency for underestimation by clinical examination (MD = −0.8 cm) was
observed with moderate heterogeneity (Q = 4.65, df = 2,
p = 0.1; I2 = 57 %); the pooled MD assuming a fixed effect
was similar (MD = −0.7 cm). Pooled differences between
MRI and clinical examination showed measurements by
clinical examination to be significantly lower than MRI
(assuming random effects, p = 0.006). Pooled LOA for
clinical examination (+/−5.1 cm) were wider than for MRI
(+/−4.2 cm) (Table 2); over- and underestimation were observed for both tests (Additional file 1: Appendices 5 and
8). Combining MRI and clinical examination by taking
their mean did not substantially improve the MD
(−0.2 cm) or LOA (+/− 4.1) over MRI alone.
Estimation of tumor size by clinical examination was
not possible for three patients. In one patient each, MRI
correctly estimated, underestimated (−0.1 cm) and overestimated (0.8 cm) pathologic tumor size.
MRI measurement by NAC agents and HER2 status
In 88 patients treated with non-taxane-based NAC from
three studies [25, 29, 46], the pooled MD showed slight
underestimation by MRI (−0.1 cm) with no evidence of
heterogeneity (I2 = 0 %). Data from 63 patients treated
with taxane-containing NAC in those studies showed a
tendency for overestimation by MRI (MD = 0.2 cm) with
no evidence of heterogeneity (I2 = 0 %) (Additional file 1:
Appendix 12). Pooled LOA in patients treated with nontaxane-based NAC (+/−4.3 cm) were wider than for patients treated with taxanes (+/−2.8 cm). When three additional studies [13, 24, 38] using only taxane-containing
NAC were included in pooled estimates (six studies,
152 patients in total), the MD did not change (0.2 cm;
I2 = 0 %), but LOA were higher (+/−3.9 cm).
Marinovich et al. BMC Cancer (2015) 15:662
Page 8 of 12
Pooled MDs from three studies [24, 29, 46] showed comparable overestimation by MRI in HER2- (MD = 0.2 cm;
N = 97) and HER2+ patients (MD = 0.3 cm; N = 42), with
no evidence of heterogeneity for either group (I2 = 0 %)
(Additional file 1: Appendix 12). Pooled LOA were also
similar (+/−4.3 cm for HER2- patients; +/− 4.2 cm for
HER2+ patients).
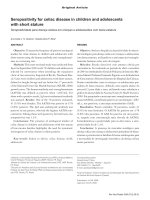
MRI when no residual tumor at pathology (pCR)
For all studies combined, pCR was present in 57/300 patients (19.0 % [95 % CI: 14.7-23.9 %]). Study-specific
rates of pCR ranged from 7.1-27.5 % (median = 19.1 %).
MRI tumor measurements > 0.0 cm for patients with
pCR are presented in Fig. 2a (measurements of 0.0 cm
are also described, representing true identification of
pCR by MRI). MRI measurements >0.0 cm ranged
between 0.3-6.1 cm (median = 2.0 cm), and measured
0.1-1.0 cm for seven patients (12.3 %); 1.1-2.0 cm for six
patients (10.5 %); 2.1-5.0 cm for five patients (8.8 %);
and >5.0 cm for three patients (5.3 %).
MRI versus alternative tests in assessing pCR
Figure 2b–d present the distribution of MRI tumor measurements > 0.0 cm for patients with pCR compared with
measurements by US (N = 35), mammography (N = 13,
MRI
40
30
50
25
40
20
30
15
20
10
10
5
26
US
24
22
60
20
18
50
16
14
40
12
30
10
8
20
6
4
10
Number of patients with pCR (N)
35
60
MRI
70
Number of patients with pCR (N)
Percent of patients with pCR (%)
(b) MRI versus US (N with pCR =35)
MRI alone (N with pCR =57)
70
Discussion
In the neoadjuvant setting, accurate measurement of residual malignancy may assist in guiding surgical management of breast cancer. While past research focussed on
the accuracy of MRI to detect the absence of residual
tumor (pCR) as a predictor of overall and disease-free survival [1], MRI measurements of tumor size have the potential to inform decisions about surgical extent (e.g. BCS
versus mastectomy). Our IPD meta-analysis assessed the
agreement between MRI and pathologic tumor measurements after NAC. Pooled MDs between MRI and pathology indicated that there was no systematic bias in MRI’s
Percent of patients with pCR (%)
(a)
excluding five patients with MRI but no mammographic
measurement), and clinical examination (N = 18). Large
(>5.0 cm) measurement errors in the presence of pCR
were more common by mammography (46.2 %) than MRI
(15.4 %; p = 0.05); both large MRI measurements also
measured >5.0 cm on mammography. The proportion of
large MRI measurement errors was not significantly different from US or clinical examination.
For 5/18 patients (27.8 %) with no mammographic
measurement (due to dense breasts or tumor margins
not being assessable post-NAC), MRI measurements
>0.0 cm occurred in three patients, ranging between
1.1–2.0 cm.
2
0
0
0.0
0.1-1.0 1.1-2.0 2.1-3.0 3.1-4.0 4.1-5.0 5.1-6.0 6.1-7.0
0
0
> 7.0
0.0
MRI measurements in the presence of pCR (cm)
0.1-1.0 1.1-2.0 2.1-3.0 3.1-4.0 4.1-5.0 5.1-6.0 6.1-7.0
> 7.0
MRI and US measurements in the presence of pCR (cm)
(c) MRI versus mammography (N with pCR =13) (d) MRI versus clinical exam (N with pCR =18)
MRI
MRI
70
8
60
7
50
6
40
5
30
4
3
20
2
10
1
0
0
0.0
0.1-1.0 1.1-2.0 2.1-3.0 3.1-4.0 4.1-5.0 5.1-6.0 6.1-7.0
> 7.0
MRI and mammography measurements in the presence of pCR (cm)
12
Clinical examination
11
10
9
50
8
7
40
6
30
5
4
20
3
2
10
Number of patients with pCR (N)
60
9
Number of patients with pCR (N)
Percent of patietns with pCR (%)
Mammography
Percent of patients with pCR (%)
70
1
0
0
0.0
0.1-1.0 1.1-2.0 2.1-3.0 3.1-4.0 4.1-5.0 5.1-6.0 6.1-7.0
> 7.0
MRI and clinical examination measurements in the presence of pCR (cm)
Fig. 2 MRI measurements (cm) for: a all patients with pCR (N = 57); and compared with measurements by b US (N = 35), c mammography
(N = 13), and d clinical examination (N = 18). Measurements of 0.0 cm denote correct identification of pCR. MRI = magnetic resonance imaging;
pCR = pathologic complete response; US = ultrasound
Marinovich et al. BMC Cancer (2015) 15:662
estimation of tumor size when residual tumor was present. Measurement variability for agreement was lower
than estimated by our previous study-level analysis [14];
however, both over- and underestimation by MRI were
observed, and LOA (+/−3.8 cm) show that substantial disagreement with pathology is possible. MRI measurement
errors within that range may be of clinical importance in
terms of their implications for the choice of treatment.
The IPD methodology used in this analysis allowed for
measurement errors to be explored in greater detail than
that permitted by study-level analyses [14]. Tumors
“missed’ by MRI generally measured ≤2.0 cm at pathology; however, MRI measurements >5.0 cm occurred in
a small proportion of cases where pCR was achieved. Although descriptive reporting of such overestimation was
not standard across included studies, one of the three
cases of MRI measurements >5 cm in the presence of
pCR observed in this data set was attributed to the presence of extensive DCIS. Other possible causes include
reactive inflammation, fibrosis or necrosis induced by
NAC [13]. Description of cases of large overestimation
in future studies would be valuable in guiding future
research and practice. Assuming that surgeons consider
the MRI-determined measurement when planning resection, such overestimation would lead to unnecessarily
large excision. Although those patients are likely to
benefit from improved disease-free and overall survival
conferred by pCR [47], they are less likely to benefit
from a reduction in surgical extent after NAC.
Comparisons of MRI and US in the same patients
showed similar LOA, suggesting comparable performance
by MRI and US when residual tumor is present (although
substantial heterogeneity for US reflects its operator dependence [2]). However, contrary to our previous studylevel analysis [14], a small bias towards underestimation of
tumor size was found for US; clinical preference for either
slight overestimation (MRI) or underestimation (US) of
pathologic size should be considered in the choice of test.
Furthermore, our analysis extends previous work by suggesting that considering the mean measurement of both
tests may further improve tumor measurement. Given
that studies may not have interpreted MRI blinded to US,
this result is likely to underestimate the value of combining the tests. Clinicians adopting this testing strategy
should be aware that the direction of MRI’s systematic
bias was reversed (slight underestimation) when the tests
were combined.
It is noteworthy that MRI did not estimate tumor size
as accurately in patients for whom US measurement was
not possible, with (on average) relatively large underestimation and wide LOA. Tumor characteristics are likely
to have contributed to measurement being challenging
for both tests. Patients without US had larger tumors
(and consistent with this, were diagnosed with more
Page 9 of 12
advanced disease and were more likely to have undergone mastectomy), reflecting limitations in the US field
of view [10]. The higher rate of non-taxane-based NAC
in that group may also have contributed to the larger
residual tumor size [48]. When planning resection, clinicians should note that although tumor measurement by
MRI may be possible for such patients, the potential for
size underestimation may lead to incomplete excision.
This analysis is the first to consider those patients separately, and directly compare MRI and US when measurement by both tests can be undertaken. Our findings
highlight the importance of study authors reporting
MRI’s agreement with pathology separately for patients
with and without alternative tests [14, 18].
In patients with measurements by both MRI and mammography, a systematic bias in estimating tumor size was
found only for MRI (slight overestimation); the larger
overestimation for mammography found in a previous
analysis (which included fewer studies comparing mammography and MRI) [14] was not observed. However, the
difference between test measurements was small, and
mammography’s moderate heterogeneity, wider LOA, and
tendency to “miss” smaller tumors (≤2.0 cm) indicate
greater variability for agreement with pathology. Consequently, combining MRI and mammography did not improve tumor measurement compared with MRI alone. In
addition, a tendency for large mammographic measurements in the presence of pCR suggests that mammography may lead to overly radical surgery when pCR is
achieved. Mammographic tumor measurements were
frequently not possible due to breast density, reflected in
the younger age of those women [49]. These findings
therefore suggest that MRI would be the preferred test in
this setting.
Direct comparison of MRI and clinical examination
showed no systematic bias in MRI’s measurement of residual tumor; relatively large underestimation, moderate
heterogeneity and wider LOA for clinical examination
were observed, suggesting greater variability for agreement with pathology. In addition, apart from one case,
tumors with pathologic measurements of >2.0 cm were
“missed” only by clinical examination, highlighting the
potential for inadequate resection if surgical planning
was based on clinical examination alone. While better
overall agreement between MRI and pathology suggest
that MRI is the more appropriate assessment method, it
is possible that a combination of US and clinical examination may be superior to either test individually [50], but
that testing strategy could not be explored in this analysis. The relative performance of test combinations
should be considered in future studies.
Data from single studies have suggested that underestimation by MRI is common in HER2- patients [16] or
those treated with taxane-containing regimens [17], but
Marinovich et al. BMC Cancer (2015) 15:662
previous study-level meta-analyses were unable to further explore the effect of these variables. Similar effects
were not observed in our IPD analysis. For patients with
data available on HER2 status, MRI performed comparably regardless of tumor biology. Although that analysis
was based on relatively few studies, the combined sample size is substantially larger than the previous study
exploring the effect of this variable, and the studies that
did not contribute data predate the routine testing of
HER2. Furthermore, contrary to previous reports, a
slight bias towards underestimation (and poorer overall
agreement with pathology) was found in patients treated
with non-taxane-based NAC. However, although more
detailed analyses were attempted, statistical models were
unstable and therefore the results presented are primarily descriptive. Further exploration of the effect of these
characteristics on measurement accuracy is warranted in
large primary studies, controlling for the effect other
potentially important covariates.
Given that not all eligible studies contributed IPD to this
meta-analysis, selection bias may have been introduced.
Although studies in this analysis were similar in most respects to the broader population of eligible studies [14], a
higher proportion of T3 tumors and stage III disease was
apparent. Other differences suggest that included studies
are more applicable to current practice (i.e. NAC with taxanes was more common), and less susceptible to changes
in tumor dimensions between MRI and pathologic measurement (i.e. shorter interval between tests). Our IPD
analysis also included a larger number of studies than the
only previous (study-level) meta-analysis utilising appropriate statistical techniques to address this clinical question [14] (see Additional file 1: Appendix 1).
Although MDs and LOA are the most methodologically appropriate measures of agreement between MRI
and pathology [15], there was no clear indication to consider either absolute or relative differences between the
tests in our analysis. Plots of the data suggest that the
absolute MDs reported here are likely to be most applicable to mid-sized tumors, but may differ for small or
large residual cancers. However, analyses of absolute and
relative differences were comparable, and therefore inferences about MRI and its performance compared to
alternative tests are likely to be robust.
Due to pCR being achieved in a minority of patients
(between 7.1 % and 27.5 % in the included studies),
analyses of measurement errors in the presence of pCR
are based on relatively small sample sizes and should
therefore be interpreted cautiously. Furthermore, to
standardise the definition of pCR across studies, this
analysis considered the presence of invasive cancer only.
This represents an advance in methods over previous
analyses by reducing the potential for heterogeneity and
improving the clinical applicability of pooled estimates.
Page 10 of 12
However, tests may differ in their ability to visualise
DCIS or calcifications [11], and hence the accuracy of
MRI and alternative tests to measure those outcomes
may differ from our estimates. Our findings that alternative tests could not evaluate residual tumor in a proportion of patients should also be interpreted with awareness
that corresponding data about non-evaluable tumors by
MRI were unavailable.
Conclusion
Our meta-analysis is the largest and most statistically
appropriate evaluation of the agreement between MRI
and pathologic residual tumor size post-NAC, and the
only meta-analysis on this topic using IPD methodology.
Our work suggests that there is no systematic bias in
MRI’s measurement of residual invasive tumor, but that
both over- and underestimation by MRI is possible, with
LOA large enough to be of clinical importance. MRI’s
performance was generally superior to that of US, mammography, and clinical examination, and in light of those
findings, MRI may be considered the most appropriate
test in this setting. However, large MRI measurements
are possible in a small proportion of pCR cases, and
patient characteristics that render tumors non-evaluable
by US may contribute to inaccurate size measurements
by MRI; those potential disadvantages should be considered in the choice of test. Furthermore, it is possible that
a combination of US and clinical examination may be
superior to those tests individually, and such a testing
strategy has potential advantages over MRI in terms of
lower cost and greater accessibility. Combinations of
alternative tests, and their performance relative to MRI,
should be explored in future studies.
Additional file
Additional file 1: Appendix 1. Methodological comparison of IPD
meta-analysis and previous study-level analysis of agreement between
MRI and pathologic tumor measurements post-NAC. Appendix 2.
PRISMA flowchart. Appendix 3. Research protocol and data collection
template. Appendix 4. MRI technical characteristics of studies included
in the IPD analysis. Appendix 5. Bland Altman Plots for MRI (absolute
and log transformed values). Appendix 6. Bland Altman Plots for US (absolute and log transformed values). Appendix 7. Bland Altman Plots for
mammography (absolute and log transformed values). Appendix 8. Bland
Altman Plots for clinical examination (absolute and log transformed values).
Appendix 9. Pooled relative differences (%) (fixed effect unless noted)
and limits of agreement for studies and patients comparing the respective tests. Appendix 10. Forest plots of MRI and comparator tests
(relative mean differences with pathology). Appendix 11. Forest plots
of MRI and comparator tests (absolute mean differences with pathology). Appendix 12. Forest plots of MRI by chemotherapy agent and
HER2 status (absolute mean differences with pathology). (DOC 796 kb)
Competing interests
SCP receives research funding from Philips Healthcare. The other authors
declare no competing interests.
Marinovich et al. BMC Cancer (2015) 15:662
Authors’ contributions
MLM conceived and co-ordinated the study, conducted the literature
searches and review of studies, performed the statistical analysis, and drafted
the manuscript. PM conceived the statistical methods used, advised on data
analysis and interpretation, and contributed to drafting the manuscript. LI advised on methodological aspects, data interpretation and contributed to
drafting the manuscript. FS advised on MRI technical issues and clinical aspects, and contributed to drafting the manuscript. EPM advised on clinical
aspects and contributed to drafting the manuscript. GvM advised on clinical
aspects and contributed to drafting the manuscript. VG collected and assembled data and contributed to drafting the manuscript. SCP collected and assembled data and contributed to drafting the manuscript. FCW collected
and assembled data and contributed to drafting the manuscript. JHC collected and assembled data and contributed to drafting the manuscript. MB
collected and assembled data and contributed to drafting the manuscript.
LM collected and assembled data and contributed to drafting the manuscript. EY collected and assembled data and contributed to drafting the
manuscript. VL collected and assembled data and contributed to drafting
the manuscript. NH conceived the study, advised on literature searches and
study eligibility, advised on clinical aspects and data interpretation, and contributed to drafting the manuscript. All authors read and approved the final
manuscript.
Page 11 of 12
5.
6.
7.
8.
9.
10.
11.
12.
Acknowledgements
This work was partly funded by National Health and Medical Research
Council (NHMRC Australia) program grant 633003 to the Screening & Test
Evaluation Program. M. L. Marinovich was supported by a NHMRC
postgraduate scholarship. N. Houssami receives research support through a
National Breast Cancer Foundation (NBCF Australia) Practitioner Fellowship.
The funding bodies had no role in the study design; in the collection,
analysis, and interpretation of data; in the writing of the manuscript; and in
the decision to submit the manuscript for publication.
Author details
1
Screening and Test Evaluation Program (STEP), Sydney School of Public
Health, The University of Sydney, A27, Edward Ford Building, Sydney, NSW
2006, Australia. 2Dipartimento di Scienze Biomediche per la Salute, Università
degli Studi di Milano, Unità di Radiologia, IRCCS Policlinico San Donato,
Piazza E. Malan 2, San Donato Milanese, Milano, Italy. 3MD Anderson Cancer
Center Orlando, 1400 South Orange Avenue, MP 700, Orlando, FL 32806,
USA. 4German Breast Group & Universitäts-Frauenklinik Frankfurt,
Martin-Behaim-Str. 12, 63263 Neu-Isenburg, Germany. 5University of Padova,
Division of Medical Oncology 2, Istituto Oncologico Veneto IRCCS, Padova,
Italy. 6Department of Radiology, University of Washington, 825 Eastlake Ave
E, G3-200, Seattle, WA 98109-1023, USA. 7Division of General Surgery,
Sunnybrook Health Sciences Centre, 2075 Bayview Avenue, Toronto, ON M4C
5T2, Canada. 8School of Medicine, Jeju National University Hospital, Aran
13gil 15(ara-1 dong), Jeju-si, Jeju-do, South Korea. 9Berkshire Cancer Centre,
Royal Berkshire NHS Foundation Trust, London Road, Reading RG1 5AN, UK.
10
Direzione Radiodiagnostica, Fondazione del Piemonte per
l’Oncologia-IRCCS, Str. Prov.142, Candiolo, Torino, Italy. 11Department of
Radiology, Brigham and Women’s Hospital, 75 Francis St, Boston, MA 02115,
USA. 12Institute of Radiology, University of Udine, p.le S.M. della Misericordia,
15, 33100 Udine, Italy.
Received: 24 February 2015 Accepted: 29 September 2015
13.
14.
15.
16.
17.
18.
19.
20.
21.
22.
23.
24.
References
1. Marinovich ML, Houssami N, Macaskill P, Sardanelli F, Irwig L, Mamounas EP, et
al. Meta-analysis of Magnetic Resonance Imaging in Detecting Residual Breast
Cancer After Neoadjuvant Therapy. J Natl Cancer Inst. 2013;105:321–33.
2. Eisenhauer EA, Therasse P, Bogaerts J, Schwartz LH, Sargent D, Ford R, et al.
New response evaluation criteria in solid tumours: Revised RECIST guideline
(version 1.1). Eur J Cancer. 2009;45:228–47.
3. Irwig L, Bennetts A. Quality of life after breast conservation or mastectomy:
A systematic review. Aust New Zealand J Surg. 1997;67:750–4.
4. Delille JP, Slanetz PJ, Yeh ED, Halpern EF, Kopans DB, Garrido L. Invasive
ductal breast carcinoma response to neoadjuvant chemotherapy:
Noninvasive monitoring with functional MR imaging - Pilot study.
Radiology. 2003;228:63–9.
25.
26.
27.
Genson CC, Blane CE, Helvie MA, Waits SA, Chenevert TL. Effects on breast
MRI of artifacts caused by metallic tissue marker clips. Am J Roentgenol.
2007;188:372–6.
Kolb TM, Lichy J, Newhouse JH. Comparison of the Performance of
Screening Mammography, Physical Examination, and Breast US and
Evaluation of Factors that Influence Them: An Analysis of 27,825 Patient
Evaluations. Radiology. 2002;225:165–75.
Sardanelli F, Giuseppetti GM, Panizza P, Bazzocchi M, Fausto A, Simonetti G, et al.
Sensitivity of MRI versus mammography for detecting foci of multifocal,
multicentric breast cancer in fatty and dense breasts using the whole-breast
pathologic examination as a gold standard. Am J Roentgenol. 2004;183:1149–57.
Bosch AM, Kessels AGH, Beets GL, Rupa JD, Koster D, Van Engelshoven JMA,
et al. Preoperative estimation of the pathological breast tumour size by
physical examination, mammography and ultrasound: A prospective study
on 105 invasive tumours. Eur J Radiol. 2003;48:285–92.
Baker JA, Soo MS, Rosen EL. Artifacts and Pitfalls in Sonographic Imaging of
the Breast. Am J Roentgenol. 2001;176:1261–6.
Hieken TJ, Harrison J, Herreros J, Velasco JM. Correlating sonography,
mammography, and pathology in the assessment of breast cancer size. Am
J Surg. 2001;182:351–4.
Lehman CD. Magnetic Resonance Imaging in the Evaluation of Ductal
Carcinoma In Situ. JNCI Monographs. 2010;41:150–1.
Tucker FL. Imaging-assisted large-format breast pathology: Program
rationale and development in a nonprofit health system in the United
States. Int J Breast Cancer 2012;1. />2012/171792/cta/.
Yeh E, Slanetz P, Kopans DB, Rafferty E, Georgian-Smith D, Moy L, et al.
Prospective comparison of mammography, sonography, and MRI in patients
undergoing neoadjuvant chemotherapy for palpable breast cancer. Am J
Roentgenol. 2005;184:868–77.
Marinovich ML, Macaskill P, Irwig L, Sardanelli F, Von Minckwitz G,
Mamounas E, et al. Meta-analysis of agreement between MRI and
pathologic breast tumour size after neoadjuvant chemotherapy. Br J Cancer.
2013;109:1528–36.
Bland JM, Altman DG. Statistical methods for assessing agreement between
two methods of clinical measurement. Lancet. 1986;327:307–10.
Chen JH, Feig B, Agrawal G, Yu H, Carpenter PM, Mehta RS, et al. MRI
evaluation of pathologically complete response and residual tumors in
breast cancer after neoadjuvant chemotherapy. Cancer. 2008;112:17–26.
Denis F, Desbiez-Bourcier AV, Chapiron C, Arbion F, Body G, Brunereau L.
Contrast enhanced magnetic resonance imaging underestimates residual
disease following neoadjuvant docetaxel based chemotherapy for breast
cancer. Eur J Surg Oncol. 2004;30:1069–76.
Bossuyt PM, Irwig L, Craig J, Glasziou P. Comparative accuracy: assessing
new tests against existing diagnostic pathways. Br Med J. 2006;332:1089–92.
Marinovich ML, Sardanelli F, Ciatto S, Mamounas E, Brennan M, Macaskill P, et
al. Early prediction of pathologic response to neoadjuvant therapy in breast
cancer: Systematic review of the accuracy of MRI. Breast. 2012;21:669–77.
Ogston KN, Miller ID, Payne S, Hutcheon AW, Sarkar TK, Smith I, et al. A new
histological grading system to assess response of breast cancers to primary
chemotherapy: Prognostic significance and survival. Breast. 2003;12:320–7.
Higgins JPT, Thompson SG, Deeks JJ, Altman DG. Measuring inconsistency
in meta-analyses. Br Med J. 2003;327:557–60.
Woodward M. Basic analytical procedures. Epidemiology: Study design and
data analysis. Boca Raton: Chapman & Hall/CRC; 1999. p. 31–105.
Bland M. Significance tests. In: Bland M, editor. An Introduction to Medical
Statistics. 3rd ed. Oxford: Oxford University Press; 2000. p. 137–55.
Wright FC, Zubovits J, Gardner S, Fitzgerald B, Clemons M, Quan ML, et al.
Optimal assessment of residual disease after neo-adjuvant therapy for locally
advanced and inflammatory breast cancer - Clinical examination, mammography,
or magnetic resonance imaging? J Surg Oncol. 2010;101:604–10.
Partridge SC, Gibbs JE, Lu Y, Esserman LJ, Sudilovsky D, Hylton NM.
Accuracy of MR imaging for revealing residual breast cancer in patients
who have undergone neoadjuvant chemotherapy. Am J Roentgenol.
2002;179:1193–9.
Prati R, Minami CA, Gornbein JA, Debruhl N, Chung D, Chang HR. Accuracy
of clinical evaluation of locally advanced breast cancer in patients receiving
neoadjuvant chemotherapy. Cancer. 2009;115:1194–202.
Segara D, Krop IE, Garber JE, Winer E, Harris L, Bellon JR, et al. Does MRI
predict pathologic tumor response in women with breast cancer
undergoing preoperative chemotherapy? J Surg Oncol. 2007;96:474–80.
Marinovich et al. BMC Cancer (2015) 15:662
28. Akazawa K, Tamaki Y, Taguchi T, Tanji Y, Miyoshi Y, Kim SJ, et al.
Preoperative evaluation of residual tumor extent by three-dimensional
magnetic resonance imaging in breast cancer patients treated with
neoadjuvant chemotherapy. Breast J. 2006;12:130–7.
29. Guarneri V, Pecchi A, Piacentini F, Barbieri E, Dieci MV, Ficarra G, et al.
Magnetic resonance imaging and ultrasonography in predicting infiltrating
residual disease after preoperative chemotherapy in stage II-III breast cancer.
Ann Surg Oncol. 2011;18:2150–7.
30. Rosen EL, Blackwell KL, Baker JA, Soo MS, Bentley RC, Yu D, et al. Accuracy
of MRI in the Detection of Residual Breast Cancer After Neoadjuvant
Chemotherapy. Am J Roentgenol. 2003;181:1275–82.
31. Nakahara H, Yasuda Y, Machida E, Maeda Y, Furusawa H, Komaki K, et al. MR
and US imaging for breast cancer patients who underwent conservation
surgery after neoadjuvant chemotherapy: comparison of triple negative
breast cancer and other intrinsic subtypes. Breast Cancer. 2011;18:152–60.
32. Julius T, Kemp SEG, Kneeshaw PJ, Chaturvedi A, Drew PJ, Turnbull LW. MRI
and conservative treatment of locally advanced breast cancer. Eur J Surg
Oncol. 2005;31:1129–34.
33. Balu-Maestro C, Chapellier C, Bleuse A, Chanalet I, Chauvel C, Largillier R.
Imaging in evaluation of response to neoadjuvant breast cancer treatment
benefits of MRI. Breast Cancer Res Tr. 2002;72:145–52.
34. Bhattacharyya M, Ryan D, Carpenter R, Vinnicombe S, Gallagher CJ. Using
MRI to plan breast-conserving surgery following neoadjuvant chemotherapy
for early breast cancer. Br J Cancer. 2008;98:289–93.
35. Bollet MA, Thibault F, Bouillon K, Meunier M, Sigal-Zafrani B, Savignoni A, et
al. Role of Dynamic Magnetic Resonance Imaging in the Evaluation of
Tumor Response to Preoperative Concurrent Radiochemotherapy for Large
Breast Cancers: A Prospective Phase II Study. Int J Radiat Oncol Biol Phys.
2007;69:13–8.
36. Montemurro F, Martincich L, De Rosa G, Cirillo S, Marra V, Biglia N, et al.
Dynamic contrast-enhanced MRI and sonography in patients receiving
primary chemotherapy for breast cancer. Eur Radiol. 2005;15:1224–33.
37. Chen X, Moore MO, Lehman CD, Mankoff DA, Lawton TJ, Peacock S, et al.
Combined use of MRI and PET to monitor response and assess residual
disease for locally advanced breast cancer treated with neoadjuvant
chemotherapy. Acad Radiol. 2004;11:1115–24.
38. Londero V, Bazzocchi M, Del Frate C, Puglisi F, Di Loreto C, Francescutti G,
et al. Locally advanced breast cancer: Comparison of mammography,
sonography and MR imaging in evaluation of residual disease in women
receiving neoadjuvant chemotherapy. Eur Radiol. 2004;14:1371–9.
39. Bodini M, Berruti A, Bottini A, Allevi G, Fiorentino C, Brizzi MP, et al.
Magnetic resonance imaging in comparison to clinical palpation in
assessing the response of breast cancer to epirubicin primary
chemotherapy. Breast Cancer Res Tr. 2004;85:211–8.
40. Weatherall PT, Evans GF, Metzger GJ, Saborrian MH, Leitch AM. MRI vs.
histologic measurement of breast cancer following chemotherapy:
Comparison with x-ray mammography and palpation. J Magn Reson Im.
2001;13:868–75.
41. Moon HG, Han W, Lee JW, Ko E, Kim EK, Yu JH, et al. Age and HER2
expression status affect MRI accuracy in predicting residual tumor extent
after neo-adjuvant systemic treatment. Ann Oncol. 2009;20:636–41.
42. Dose-Schwarz J, Tiling R, Avril-Sassen S, Mahner S, Lebeau A, Weber C, et al.
Assessment of residual tumour by FDG-PET: Conventional imaging and
clinical examination following primary chemotherapy of large and locally
advanced breast cancer. Br J Cancer. 2010;102:35–41.
43. Kim HJ, Im YH, Han BK, Choi N, Lee J, Kim JH, et al. Accuracy of MRI for
estimating residual tumor size after neoadjuvant chemotherapy in locally
advanced breast cancer: Relation to response patterns on MRI. Acta Oncol.
2007;46:996–1003.
44. Martincich L, Montemurro F, De Rosa G, Marra V, Ponzone R, Cirillo S, et al.
Monitoring response to primary chemotherapy in breast cancer using
dynamic contrast-enhanced magnetic resonance imaging. Breast Cancer
Res Tr. 2004;83:67–76.
45. Esserman L, Kaplan E, Partridge S, Tripathy D, Rugo H, Park J, et al. MRI
phenotype is associated with response to doxorubicin and
cyclophosphamide neoadjuvant chemotherapy in stage III breast cancer.
Ann Surg Oncol. 2001;8:549–59.
46. Choi JH, Lim HI, Lee SK, Kim WW, Kim SM, Cho E, et al. The role of PET CT
to evaluate the response to neoadjuvant chemotherapy in advanced breast
cancer: Comparison with ultrasonography and magnetic resonance
imaging. J Surg Oncol. 2010;102:392–7.
Page 12 of 12
47. Montagna E, Bagnardi V, Rotmensz N, Viale G, Pruneri G, Veronesi P, et al.
Pathological complete response after preoperative systemic therapy and
outcome: Relevance of clinical and biologic baseline features. Breast Cancer
Res Tr. 2010;124:689–99.
48. Bear HD, Anderson S, Smith RE, Geyer J, Mamounas EP, Fisher B, et al.
Sequential preoperative or postoperative docetaxel added to preoperative
doxorubicin plus cyclophosphamide for operable breast cancer: National
surgical adjuvant breast and bowel project protocol B-27. J Clin Oncol.
2006;24:2019–27.
49. Checka CM, Chun JE, Schnabel FR, Lee J, Toth H. The relationship of
mammographic density and age: Implications for breast cancer screening.
Am J Roentgenol. 2012;198:W292–5.
50. Herrada J, Iyer RB, Atkinson EN, Sneige N, Buzdar AU, Hortobagyi GN.
Relative value of physical examination, mammography, and breast
sonography in evaluating the size of the primary tumor and regional lymph
node metastases in women receiving neoadjuvant chemotherapy for locally
advanced breast carcinoma. Clin Cancer Res. 1997;3:1565–9.
Submit your next manuscript to BioMed Central
and take full advantage of:
• Convenient online submission
• Thorough peer review
• No space constraints or color figure charges
• Immediate publication on acceptance
• Inclusion in PubMed, CAS, Scopus and Google Scholar
• Research which is freely available for redistribution
Submit your manuscript at
www.biomedcentral.com/submit