Báo cáo y học: "Application of Small Angle X-ray Scattering (SAXS) for Differentiation between Normal and Cancerous Breast Tissue"
Bạn đang xem bản rút gọn của tài liệu. Xem và tải ngay bản đầy đủ của tài liệu tại đây (260.35 KB, 4 trang )
Int. J. Med. Sci. 2005 2
118
International Journal of Medical Sciences
ISSN 1449-1907 www.medsci.org 2005 2(3):118-121
©2005 Ivyspring International Publisher. All rights reserved
Short research communication
Application of Small Angle X-ray Scattering (SAXS) for Differentiation between
Normal and Cancerous Breast Tissue
Vahid Changizi
1
, Mohammad A. Oghabian
1
, Robert Speller
2
, Saeed Sarkar
1
, Ali Arab Kheradmand
1
1. Department of Medical Physics, Faculty of Medicine, Tehran University of Medical Sciences, & Research Center for Science &
Technology in Medicine, Imam Khomaini Hospital, Bolvare Keshavarz, Tehran, Iran
2. Department of Medical Physics and Bioengineering, University College London, Gower Street, London WC1E 6BT, UK
Corresponding address: Vahid Changizi.
Received: 2005.02.07; Accepted: 2005.06.20; Published: 2005.07.05
Introduction: Small angle, between 3
°
and 10
°
, X ray scattering is predominantly coherent giving rise to diffraction
effects that can be observed as constructive and destructive interferences. These interferences carry information about
the molecular structure of the tissue and hence can be used to identify changes that occur due to cancer.
Method: In this study an energy dispersive X-ray diffraction method was used. The optimum scattering angle,
determined from a series of measurements on adipose breast tissue at several angles from 4 to 7.3 degrees, was found to
be 6.5
°
. Once optimized the system was used to measure the diffraction profiles (corrected scattered intensity versus
momentum transfer) of a total of 99 breast tissue samples. The samples were both normal and tumour samples.
Results: Adipose tissue showed a sharp, high intensity peak at low momentum transfer values of approximately 1.1nm-
1. Adipose tissue, mixed tissue (adipose & fibroglandular) and tumor have peaks at different values of momentum
transfer that can be used to identify the tissue. Benign and malignant breast tissues can also be differentiated by both
peak positions and peak heights. It was also observed that the results were reproducible even after the tissue had been
preserved at liquid nitrogen temperatures.
Conclusion: We were able to differentiate between normal, benign and malignant breast tissues by using energy
dispersive small angle x-ray scattering.
Keywords: small angle x-ray scattering, normal and cancerous breast tissues
1. Introduction
Breast cancer is the most widespread cancer in
women. Incidence rates are continuously increasing in
many parts of the world and currently, in the industrial
world, the rate is about one in 12. It is a major cause of
death in middle-aged women of 33-55 years [11] and the
need for early and more accurate diagnosis has been
identified as a major factor that could help in saving many
women
ُ
s lives.
Scattering of X-rays at small angles is dominated by
coherent (elastic) scattering. These coherent scattering
events interfere and produce diffraction effects. The latter
gives rise to a unique scattering signature characteristic of
the tissue that has been irradiated. This signature is
dependant upon the molecular composition of the target
and hence could be used to characterize the tissue. There
have been several papers describing possible applications
of these effects. Kosanetzky et al [6] presented the
diffraction patterns for some plastics and several
biological samples. The characteristic nature of scattering
was also reported by Evans et al [2]. More recently the
sensitivity of photon scattering due to molecular level
changes in tissue was presented by Kidane et al [5]. By
using SAXS, systematic differences in the intensities and
d-spacing have been clearly demonstrated among the
collagen of normal, malignant and benign breast tissues
by Lewis et al [7]. Furthermore, Keyrilainen et al showed
that the average intensity of scattering from cancerous
regions is an order of magnitude higher than the intensity
from healthy regions [3]. As a clear demonstration of how
the scattering profile is material dependant, Poletti et al
demonstrated that tissue equivalence for X-ray
transmission does not lead to tissue equivalence in
scattering properties [12].
Applications outside of the biomedical field have
also been reported. Malden et al [8] used CdZnTe
detectors to collect energy dispersive diffraction spectra at
a range of scattering angles, obtained from sheets of
explosive materials hidden in baggage. They have shown
that the combined information from these ‘signatures’ can
be used to determine whether an explosive sample is
present or not. In another example, Desouky et al,
presented low angle X-ray scattering profiles for five
different spices; anise, coriander, cumin, fennel and
nigella [1].
It is clear that there exists a body of data on tissue
scattering. However, in order to evaluate possible
applications of small angle x-ray scattering as a diagnostic
tool, it is important that its ability to distinguish normal
from benign disease and benign from malignant breast
disease be established. This paper looks at the scattering
profiles obtained from normal, benign and malignant
breast tissues.
2. Materials and methods
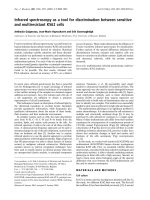
Equipment - Energy Dispersive X- Ray Diffraction
(EDXRD) was used. A schematic diagram of the small
angle x-ray scattering set up is shown in Figure 1.
The tungsten target X-ray tube was operated at 10
mA and 60 kV. Two collimators, acceptance angle
approximately 1
°
, were used to define the incident and
scattered beams of 1 mm diameter. The source to sample
distance was 150mm and sample to detector distance was
Int. J. Med. Sci. 2005 2
119
170mm. All system components were mounted on an
isolated optical table.
The detection system was a planar HpGe detector
(model GEM, Ortec EG&G) with energy resolution of 850
eV at 59.7 keV. In order to minimize multiply scattered
background from the laboratory, lead was placed around
the detector. The output pulses were fed to a PC – based
multichannel analyzer (92X Spectrum Master, EG&G
Ortec). The analyzer was used to digitize the analog
information contained in each pulse, to process and store
the data in memory and finally to display the contents of
the processed data in the form of counts against channel
number. Channel number was converted into photon
energy by performing a calibration using Am-241.
All samples were prepared as 5 mm diameter and 5
mm height pieces of tissue contained in low scattering,
thin walled plastic holders. In order to obtain scatter
signatures the samples were positioned at the center of the
scattering volume defined by the collimation geometry.
During the scatter measurements, the sample was rotated
at constant speed to ensure that all parts of the tissue
sample were exposed uniformly to the beam.
The total counting time per sample was 500 seconds
giving rise to a statistical error of 0.02 per channel.
Raw data corrections – Raw scatter data were corrected
as follows:
• Energy values were transformed into momentum transfer
values by using Q=(1/λ)sin(θ/2) where λ is the wavelength
of the radiation used and θ the scatter angle.
• The background due to scattering from the sample holder
was subtracted from the raw data.
• Each measured spectrum was corrected for the shape of the
incident spectrum. This allows comparison with other
worker’s data.
• Finally, baseline subtraction was performed for each
coherent intensity versus momentum transfer curve.
Evaluation of optimum scattering angle - In order to
obtain the optimum scattering angle, the diffraction
profiles of a test adipose sample were measured over a
range of scattering angles from 4
°
to 7.3
°
. The optimum, in
terms of peak width and peak intensity was found to be at
an angle of 6.5
°
. Therefore, all other tissue sample
measurements were performed at 6.5
°
and at a
temperature of 18
°
C ± 1
°
C.
Samples - A total of 99 samples were collected from
women who underwent mastectomy at the Imam
Khomaini hospital, Tehran, Iran. A section from each
sample was sent for histological analysis whilst the
remaining tissue was prepared for scatter analysis. All
measurements were made with the tissue at room
temperature and all tissues were stored between
measurements at liquid nitrogen temperature.
Histological analysis of the samples gave the following
breakdown of tissue types: 20 pure adipose tissues, 17
mixed (adipose plus fibroglandular) normal tissues, 41
carcinoma and 21 fibrocystic changes.
Effects of storage – In order to study the effects of
tissue storage upon the diffraction profiles measurements
were made within 1.5 hours of harvesting and then
repeated at intervals of two months during which the
tissue was stored at liquid nitrogen temperatures.
3. Results
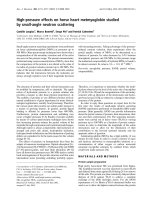
Mean diffraction profiles for the four different tissue
types studied in this work are shown in Figure 2. Adipose
tissue presents a sharper peak at lower momentum
transfer values compared with other tissues. The width of
the curve for tumors is noticeably greater than for adipose
tissue. Table 1 gives mean values for the peak positions
and widths. It can be seen that the peak height (0.11±0.01
normalized relative intensity) for adipose is more than for
tumors (0.09±0.01 for carcinoma and 0.07±0.02 for
fibrocystic change) as well as for fibroglandular (0.08±
0.01).
Table 2 tabulates the significance, obtained by
student’s t-test, of the change of peak position between
different tissues. It can be seen that peak position, is a
reliable way to differentiate between normal and tumor
breast tissues. Furthermore, it is possible to differentiate
between fibrocystic changes and carcinoma using this
parameter. The difference between adipose and tumors is
further highlighted and even though the fibroglandular
and fibrocystic changes peaks are close, they are
statistically separated.
Using the results in Table 2 effective d-spacings have
been found. These are 0.33, 0.36, 0.46 and 0.4 nm for
carcinoma, fibrocystic changes, adipose and
fibroglandular tissues respectively.
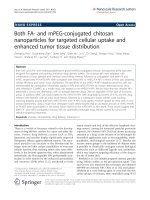
Comparison of the measured signatures between the
fresh and frozen tissues is shown in Figure 3. It can be
seen that there are no significant differences between the
fresh and frozen samples in terms of their diffraction
profiles.
4. Discussion
A noticeably shaper peak in the diffraction profile
was obtained for adipose compared to other tissues. This
is a result of the high levels of lipid fat cells that exist in
adipose tissue.
Figure 2 shows that in this study peak positions can
be used to identify tissues and their positions in this study
are similar to the results obtained by Kidane et al (1999).
The peak positions for the adipose and carcinoma were
1.09±0.03 nm-1 and 1.53±0.03 nm-1 respectively.
Connective tissue that supports the malignant cells varies
in composition from fibroblastic to densely hyaline and
contains varying amounts of collagen, extra cellular mucin
and elastic tissue [9]. This tissue replaces fat as the tumour
invades it. Thus, carcinoma is typically characterized by
the lack of isolated pockets of fat within its mass and this
is demonstrated in these results by the lack of any adipose
peak in the carcinoma diffraction profile.
The peak positions for the adipose and fibrocystic
changes were 1.09±0.03 nm-1 and 1.38±0.04 nm-1
respectively. In this case, adipose tissue has been replaced
by fibrocystic changes. Fibrocystic changes as lobular
lesions in which the individual acini or terminal ductules
dilate, untwist, and unfold to produce a solitary locule
that then enlarges as a cyst. Understandably, fibrosis is
often reported by pathologists in an attempt to explain
clinical palpability or mammographic density [4]. But
adenocarcinoma including ductal carcinoma, lobular
carcinoma and in-situ ductal carcinoma studied in this
work is referred to as glandular tissue. Therefore, it is
expected different peak positions will exist for carcinoma
and fibrocystic changes. Our results confirmed this
expectation. The peak position of fibrocystic change was
close to that of carcinoma. However, the t-test
examination revealed that they could be separated
statistically into two different groups. In all cases p-value
were less than 0.0001.
Int. J. Med. Sci. 2005 2
120
It was found that the total integrated intensity of
coherent scattering from cancerous tissues is higher than
that of normal adipose tissue. This is similar to the finding
of Keyrilainen et al [3], although the diffraction profiles
differ. This is possibly due to the angular dispersive
technique used by Keyrilainen et al.
5. Conclusion
Measurements of coherently scattered X-ray photons
can be used to identify breast disease. In this study using
diffraction profiles from EDXRD, distinct peak positions
were obtained for different breast tissues including
adipose (1.09±0.03 nm-1), fibroglandular (1.25±0.05 nm-1),
carcinoma (1.53±0.03 nm-1) and fibrocystic tissues
(1.38±0.04 nm-1). It has been shown that these differences
are significant (p<0.001) and therefore allow tissues to be
characterized. It was also shown that peak height (i.e.,
scattered intensity) could help differentiate between
normal tissue and breast tumours. As the result, this
method could be adapted for use in mammography for
the early detection of breast cancer.
There were no significant differences in peak
position, peak height or area between diffraction curves
obtained from tissue before and after storing at liquid
nitrogen temperatures. Therefore, it can be concluded that
freezing does not create any molecular changes that can
be observed in these measurements.
Acknowledgments
This study has been supported by the Tehran
University of Medical Sciences. We would like to thank
The Institute of Applied Physics for its collaboration.
Conflict of interest
None declared.
References
1. Desouky OS, Ashour AH, Abdullah MI, Elshemey WM. Low angle
X-ray scattering from spices. Radiation Physics and Chemistry 2002;
64: 267-271.
2. Evans SH, Bradley DA, Dance DR, Bateman JE, Jones CH.
Measurement of small angle photon scattering for some breast
tissues and tissue substitute materials. Phys Med Biol 1991; 36 (1): 7-
18.
3. Fernandez M, Keyrilainen J, Serimaa R, Torkkeli M, Karjalainen-
Lindsberg ML, Tenhunen M, Thomilnson W, Urban V, Suortti P.
Small angle x-ray scattering studies of human breast tissue samples.
Phys Med Biol 2002; 47: 577-592.
4. Harris JR, Lippman ME, Morrow M, Osborne C. Diseases of the
breast (second edition). Philadelphia: Lippincott Williams and
Wilkins. 1999.
5. Kidane G, Speller RD, Royle GJ, Hanby AM. X-ray scatter signatures
for normal and neoplastic breast tissues. Phys Med Biol 1999; 44:
1791-1802.
6. Kosanetzky J, Knoerr B, Harding G, Neitzel U, et al. X-ray diffraction
measurement of some plastic materials and body tissues. Med Phys
1987; 14 (4): 1811-1816.
7. Lewis RA, Rogers KD, Hall CJ, Towns-Andrews E, Slawson S, Evan
A, Pinder SE, Ellis IO, Boggis CRM, Hufton AP and Dance DR.
Breast cancer diagnosis using scattered X-rays. J Synchrotron Rad
2000; 7: 348-352.
8. Malden CH, Speller RD, et al. A CdZnTe array for the detection of
explosives in baggage by energy dispersive X-ray diffraction
signatures at multiple scatter angles. Nuclear Instruments and
Methods in Physics Research A. 2000; 449: 408-415.
9. Mills RR, Hanby AM, Girling AC. Diagnostic Surgical Pathology.
New York: Raven. 1994.
10. Morin LRM. Molecular form factors and photon coherent scattering
cross sections of water. J Phys Chem 1982; 11: 1091.
11. Parking DM, Laara E, Muri CS, et al. Estimates of the world wide
frequency of sixteen major cancers in 1980. Int J Cancer 1988; 41: 184.
12. Poletti ME, Goncalves OD, Mazzaro I. Measurements of X-ray scatter
signatures for some tissue-equivalent materials. Nuclear Instruments
and Methods in Physics Research B. 2004; 213: 595-598.
Tables and Figures
Table 1. Major parameters from the diffraction profiles
measured at a scattering angle of 6.5° for 99 breast tissue
samples. The samples were histologically classified.
Tissue type
(histological
classification)
Number
of
samples
Peak
position
(nm
-1
)
FWHM
(nm
-1
)
Peak Height
(Normalized
relative
intensity)
Carcinoma 41 1.53± 0.03 0.3± 0.05 0.09± 0.01
Fibrocystic changes 21 1.38± 0.04 0.29± 0.03 0.07± 0.02
Adipose 20 1.09± 0.03 1.56± 0.03 0.125± 0.015
Mixed (adipose+
Fibroglandular)
17 1.09± 0.03
&
1.25± 0.05
0.025±
0.02
0.12± 0.01
&
0.08± 0.01
Table 2. Significance values for the student’s t-test carried out
on the peak positions associated with different types of breast
disease.
95% confidence
interval of the
difference
Tissue type Numbers Peak
position
(nm
-1
)
T
value
P-
value
lower upper
Carcinoma 41 1.53± 0.03
Fibrocystic
changes
21 1.38± 0.04
13 P<0.0001 0.13 0.18
Carcinoma 41 1.53± 0.03
Adipose 20 1.09± 0.03
65 P<0.0001 0.43 0.46
Fibrocystic
changes
21 1.38± 0.04
Adipose 20 1.09± 0.03
25 P<0.0001 0.27 0.32
Carcinoma 41 1.53± 0.03
Fibroglandular 17 1.25± 0.05
47 P<0.0001 0.27 0.3
Fibrocystic
changes
21 1.38± 0.04
Fibroglandular 17 1.25± 0.05
12 P<0.0001 0.11 0.16
Int. J. Med. Sci. 2005 2
121
Figure 1. Schematic experimental set up for EDXRD method with Hp Ge detector.
Figure 2: Mean corrected diffraction profiles for the tissue types listed in table 1. Each of the curves is the average value of corrected
intensity of samples within its classification. The number of samples of each type is given in table 1.
Figure 3: The corrected diffraction profile from adipose tissue before and after preserving in a liquid nitrogen facility for 2 months.