Methylation-associated Has-miR-9 deregulation in paclitaxel- resistant epithelial ovarian carcinoma
Bạn đang xem bản rút gọn của tài liệu. Xem và tải ngay bản đầy đủ của tài liệu tại đây (1.18 MB, 10 trang )
Li et al. BMC Cancer (2015) 15:509
DOI 10.1186/s12885-015-1509-1
RESEARCH ARTICLE
Open Access
Methylation-associated Has-miR-9 deregulation
in paclitaxel- resistant epithelial ovarian carcinoma
Xiao Li1,2, Qianqian Pan1,3, Xiaoyun Wan2, Yuyan Mao2, Weiguo Lu2, Xing Xie2 and Xiaodong Cheng2*
Abstract
Background: Drug resistance is still one of the key causes of death in epithelial ovarian carcinoma (EOC) patients,
however there are very few strategies to reverse chemoresistance. Here we try to clarify whether and how miR-9
takes part in the regulation of paclitaxel sensitivity.
Methods: miR-9 expressions in EOC cells and tissues were detected by Realtime PCR. The target of miR-9 was
validated through dual luciferase reporter assay and Western Blot. Methylation study, RNAi technique and cytotoxicity
assay were used to determine the intrinsic mechanism of miR-9 in paclitaxel sensitivity regulation.
Results: miR-9 is down-regulated in paclitaxel resistant EOC. The patients with lower miR-9, Grade 3, Stage III –IV and
suboptimal surgery present shorter survival time. miR-9 and suboptimal surgery are independent prognostic factors of
EOC. Modulating miR-9 expression could change paclitaxel sensitivity of EOC cells. CCNG1, validated as a direct target
of miR-9, mediates paclitaxel resistance. miR-9-1 and 3 gene hypermethylation would decrease miR-9 expression, while
demethylation of miR-9 gene could restore miR-9 expression and improve paclitaxel sensitivity in chemoresistance EOC
cells. Furthermore, methylation-associated miR-9 deregulation in EOC cells could be induced by paclitaxel exposure.
Conclusions: Methylation-associated miR-9 down-regulation is probably one of the key mechanisms for paclitaxel
resistance in EOC cells, via targeting CCNG1. Our findings may also provide a new potential therapeutic target to
reverse paclitaxel resistance in EOC patients.
Keywords: Ovarian carcinoma, Chemoresistance, miR-9, Methylation
Background
Although improved combination of surgery and chemotherapy is commonly applied for epithelial ovarian carcinoma (EOC), EOC is still the leading cause of death
among gynecologic cancer nowadays [1, 2]. Initial response to chemotherapeutic drugs can be achieved in
about 70 % EOC patients, but most of patients eventually develop chemoresistance and succumb to their
diseases [1, 3]. Numerous evidences showed that chemoresistance is a clinically formidable problem in managing
EOC patients. Obviously, reversion of drug resistance
would contribute to improve prognosis.
As we know,miRNAs are small noncoding RNAs involved in the initiation and progression of human cancer
[4]. Previous studies have suggested that miRNAs can
* Correspondence:
2
Department of Gynecologic Oncology, Women’s Hospital, School of
Medicine, Zhejiang University, No.1 Xueshi Road, 310006 Hangzhou,
Zhejiang, China
Full list of author information is available at the end of the article
act as oncogenes or tumor suppressors, exerting a key
function in tumorigenesis and progression [5, 6]. For instance, miR-9 is under-expressed in gastric cancer, and
ectopic expression of miR-9 can influence cell growth
and cell cycle [7]. As a highly conserved miRNA found
in insects and primates, miR-9 has three independent
gene loci: miR-9-1, miR-9-2, and miR-9-3, located at
chromosomes 1, 5, and 15, respectively [8]. miR-9 expression can be epigenetically modified. Studies showed
that miR-9 deregulation and gene methylation was associated with cancer development and recurrence [9–11].
Heller [12] recently found that miR-9-3 methylation was
related to shorter overall survival and disease-free survival of lung squamous cell carcinoma patients. But no
study, to our best knowledge, has been reported about
the intrinsic relationship between miR-9 deregulation
and paclitaxel resistance in cancer research up to today.
Our previous studies have identified a deregulated
miRNA profile in paclitaxel resistant EOC using miRNA
© 2015 li et al. This is an Open Access article distributed under the terms of the Creative Commons Attribution License (http://
creativecommons.org/licenses/by/4.0), which permits unrestricted use, distribution, and reproduction in any medium, provided
the original work is properly credited. The Creative Commons Public Domain Dedication waiver ( />publicdomain/zero/1.0/) applies to the data made available in this article, unless otherwise stated.
Li et al. BMC Cancer (2015) 15:509
microarray and Realtime PCR [13]. Of those, miR-9 is
one of the top down-regulated miRNAs, which implies
that miR-9 might participate the regulation process of
chemoresistance. In present study we try to inspect
whether miR-9 take part in the process of chemoresistance regulation, and how about the methylation status
of three miR-9 gene loci is in paclitaxel sensitive and
resistant EOC. Which would help us to understand
chemoresistant mechanism at the molecular level and
illuminate fundamental properties of drug resistance in
EOC.
Methods
Patient’s characteristics
In total 66 human epithelial ovarian carcinoma tissues
were collected from Women’s Hospital, School of
Medicine, Zhejiang University. All patients received
chemotherapy including paclitaxel after primary surgery.
Patients who had undergone preoperative radiotherapy
or chemotherapy were excluded. All samples were
immediately snap-frozen in liquid nitrogen and stored
at −80 °C. Tumor histology was evaluated by an expert
pathologist. Written informed consent was obtained
from the participants and the study was approved by the
ethical committee of Women’s Hospital, School of Medicine, Zhejiang University (Reference number: 20110027).
The characteristics of the patients are listed in
Additional file 1: Table S1. The term of paclitaxel resistant, paclitaxel sensitive, overall survival time (OS) and
progression free survival time (PFS) was defined as before [13]. Since First-line treatment for EOC patients is
usually based combined therapy, paclitaxel resistance is
actually resistance to treatment (both paclitaxel and
platinum). We will use chemoresistant or chemosensitive instead of paclitaxel resistant and sensitive for EOC
patients.
Page 2 of 10
(RT-PCR). To analyze the effect of miR-9 restoration upon
demethylation, cells were seeded in six-well plates at a
density of 1×10⁶ cells/ml and treated with 2uM 5-aza-2′deoxycytidine (DAC, Sigma–Aldrich, St. Louis, MO, USA)
for 72 h, replacing the drug and medium every 24 h.
RNA extraction and realtime RT-PCR
Total RNA was extracted using TRIzol (Invitrogen) and
RNeasy mini kit (Qiagen, Hilden, Germany) from
ovarian cell lines or tissues. RNA concentrations were
determined with Nanodrop 2000 thermo scientific spectrophotometer (Wilmington, DE, USA). RT reactions
and Real-time PCR for miRNA and mRNA were performed as previously [13]. For miRNA quanitification,
total RNA 0.5 μg (5ul), 62.5nM RT primer 1.0ul
((Ribobio) were incubated at 70 °C for 10 min and
snapped on ice for 3 min, then added with 5 × RT Buffer
2.0 μl, dNTPs 0.5ul, RNase Inhibitor Protein 0.5ul,
M-MLV 0.5ul (all from TaKaRa, DaLian, China) in a
final volume of 10 μl, and incubated at 42 °C for 60 min,
70 °C for 15 min. Real-time PCR was performed using
SYBR Premix Ex Taq kit (Takara, DRR081A). PCR volume was 20 μl, containing 1 μl RT product. Following
cycling conditions were used [95 °C for 30 s, (95 °C for
5 s, 60 °C for 20 s, 70 °C for 10 s) × 40 cycles]. For
mRNA, total cDNA was synthesized with the PrimeScript RT reagent Kit (TaKaRa, DRR037A) and Realtime PCR was performed using SYBR Premix Ex Taq kit
(TaKaRa, DRR081A). The U6 snRNA and GAPDH were
used as endogenous control for miRNA and mRNA respectively. The primers for CCNG1 and GAPDH were
listed in Additional file 1: Table S2. Relative expression
was calculated using the 2−ΔΔCt method. ΔCt (miR-9) =
Ct (miR-9)-Ct (U6), while ΔCt (CCNG1) = Ct (CCNG1)Ct (GAPDH) in the same sample. ΔΔCt = (Group resistant
ΔCt) - (Group sensitive Group ΔCt). Group ΔCt was the
ΔCt mean of the paxlitaxel sensitive cells or tissues.
Cell culture and transfection
The EOC cell line SKOV3 was purchased from American
Type Culture Collection (Manassas, VA, USA). Paclitaxel
resistant cell line SKOV3-TR30 (ST30) was induced from
SKOV3 [14]. The EOC cell line A2780 (European
Collection of Cell Cultures, Salisbury, Wiltshire, UK)
and its pacilitaxel resistant variants A2780R were
obtained from professor Ding Ma (Tongji hospital,
Tongji medical college, Huazhong university of science and technology, Wuhan, China).
Regulation of miR-9 was performed as before [13]. To
regulate the expression of Cyclin G1 (CCNG1), cells
were transfected with three different CCNG1 siRNA 1, 2, 3,
or their negative control (50nM) (Ribobio, Guangzhou,
China) by using Lipofectamine 2000(Invitrogen, Carlsbad,
CA, USA). At 48 h after transfection, treated cells were
harvested for reverse transcript-polymerase chain reaction
Western blotting
Total protein extracts from the cells were prepared at
72 h after transfection. Western blot analysis was performed as previously [13], using the primary antibody
against CCNG1 (sc-8016, 1:500, clone F-5, Santa Cruz,
CA, USA), GAPDH (sc-25778, 1:1000, Santa Cruz) was
used as an endogenous control.
Cytotoxicity assay
To determine the effect of miR-9, DAC and CCNG1
siRNA2 on paclitaxel sensitivity of EOC cells, the cells
treated with different conditions were suspended in 96well plates (5 × 10³cells/well) overnight, then paclitaxel
(Bristol-Myers Squibb, New York, NY, USA) was added
in gradually increasing concentration (0, 1, 10, 50, 500,
1000nM) for 72 h. The cells exposed to culture medium
Li et al. BMC Cancer (2015) 15:509
only used as control. Viability of cells was determined
using Cell-Titter 96 AQueous One Solution Cell Proliferation Assay (MTS, Promega, Madison, WI, USA). In brief,
20 μL Reagent was added to each well, and incubated
for 3 h. The absorbance was read on a Varioskan Flash
spectral scanning Multimode Reader (Thermo Scientific)
at 490 nm. Three wells were used for each condition,
and experiments were performed in triplicate. The
inhibited rate of EOC cells = 1 - the absorbance of EOC
cells treated with paclitaxel/the absorbance of control
EOC cells. IC50 values (the concentration of drugs
that produced a 50 % reduction of absorbance) were
analyzed.
Dual luciferase reporter assay
Dual luciferase reporter assay was performed as previously [13]. In brief, the 3′-untranslated region (UTR) of
CCNG1 (1367BP) mRNA containing the miR-9 binding
site were PCR amplified, and cloned into the pmiR-RBREPORT™ dual luciferase reporter vector (Promega).
Site-directed Gene Mutagenesis Kit (Beyotime, Jiangsu,
China) was used to produce the mutations of the miR-9
targeting site. The primers and mutation primers were
synthesized by RiboBio and listed in Additional file 1:
Table S2. The luciferase activities were measured at 48 h
after cotransfection with miRNA mimic or its negtive
control (50 nM) and different reporter vectors (50nM).
The experiments were performed in triplicate and repeated three times.
Methylation studies
To analyze the methylation status of miR-9 genes family
(miR-9-1, miR-9-2 and miR-9-3), bisulfite sequencing
(BSP) and methylation-specific polymerase chain reaction (MSP) were carried out as described previously
[10]. Genomic DNA was extracted from tissue sample
and cell lines using AxyPrep Multisource Genomic DNA
Minprep kit (Axygen, Hangzhou, China), and treated
with sodium bisulfite using the EZ DNA MethylationGold kit (Zymo Research, Orange, CA, USA). For bisulfite sequencing, amplified PCR products were cloned
into PMD18T vector (TAKARA), and 10–12 clones from
each sample were sequenced.
Statistical analysis
Kaplan-Meier survival functions and log-rank test were
used to assess PFS and OS based on median miR-9
expression level. To further determine whether miR-9 is
associated with survival, univariate and multivariate Cox
Regression analysis were applied. Other data were analyzed using chi square test or student’s t-test. All statistical analyses were two-sided and performed with SPSS
11.5 software package. P-values less than 0.05 were
considered statistically significant.
Page 3 of 10
Results
miR-9 expression is down-regulated in paclitaxel resistant
EOCs and correlated with prognosis
In accordance with our previous results [13], we validated that miR-9 expressions were reduced by 95.26-fold
and 18.96-fold in paclitaxel resistant ST30 and A2780R
cell lines, compared with their parental cell lines respectively (Fig. 1a). Further detection revealed that miR-9
expressions in 22 chemoresistant EOC patients were
reduced by 7.80-fold compared with 44 chemosensitive
EOC patients (Fig. 1b), which was consistent with our
previous result of formalin-fixed paraffin-embedded
samples [13]. In addition, we divided all tissues into high
and low miR-9 expression group based on the median
miR-9 value, and found a significantly longer progression
free survival time (29.00(21.12-36.88) months) and overall survival time (not yet reached, as clearly showed by
relative curve) in patients with higher miR-9 expression
than those with lower miR-9 level (9.00(5.62-12.38)
months and 39.00(14.53-63.47) months respectively), as
shown in Figure 1c and d. Moreover, univariate cox analysis showed that lower miR-9, Grade 3, Stage III –IV
and suboptimal surgery were associated with poor PFS
(HR = 0.43, 0.34, 0.21 and 0.33 respectively) and OS
(HR = 0.43, 0.26, 0.08 and 0.25 respectively). Type II
cancer was associated with poor OS (HR = 0.07). Multivariate cox analysis revealed that lower miR-9 and suboptimal
surgery were independent predictors for poor PFS (HR =
0.24 and 0.24) and OS (HR = 0.37 and 0.41) (Table 1).
Hence, our data confirm that miR-9 expression is downregulated in chemoresistant EOCs, and lower miR-9
predicts poorer prognosis of EOC patients.
Modulating miR-9 expression changes paclitaxel sensitivity
of EOC cells
A significant reduction of miR-9 level was observed in
SKOV3 cells after miR-9 inhibitor transfection, and a
significant increase of miR-9 level was observed in ST30
cells after miR-9 mimic transfection (Additional file 2:
Figure S1A, B). The cytotoxic effect of paclitaxel on
EOC cell lines was assessed after transfection of miR-9
mimic or inhibitor (or negative control). miR-9 mimic
induced a decreased IC50 value of paclitaxel in ST30
and A2780R cells, whereas miR-9 inhibitor brought an
increased IC50 value in SKOV3 and A2780 cells (Fig. 2a,
d). These data suggest that elevated miR-9 expression
enhances paclitaxel cytotoxicity to drug-resistant EOC
cells, while reduced miR-9 expression inhibits paclitaxel
cytotoxicity to drug-sensitive EOC cells.
CCNG1 is one of the targets directly regulated by miR-9
TargetScan database (www.targetscan.org, Released 6.0,
Nov 2011) predicted CCNG1 contain the putative miR-9
binding site. Western blot validated that up-regulated
Li et al. BMC Cancer (2015) 15:509
Page 4 of 10
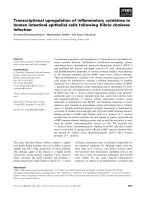
Fig. 1 miR-9 expression in EOC and its clinical significances. a. Realtime RT-PCR for miR-9 in ovarian carcinoma cell lines (P = 0.000). b. Realtime
RT-PCR for miR-9 in ovarian carcinoma tissues (P = 0.000). The experiments were performed in triplicate. c. Progression free survival time (PFS) of
66 EOC patients by miR-9 level (P = 0.004), MST, median PFS in months. d. Overall survival time (OS) of 66 EOC patients by miR-9 level (P = 0.014).
MST, median OS in months
Table 1 Univariate and multivariate Cox regression analysis of PFS and OS
PFS
OS
HR(95 % CI)
P value
HR(95 % CI)
P value
0.98(0.95-1.01)
0.148
0.99(0.96-1.02)
0.481
Univariate analysis
Age
miR-9(high vs low)
0.43(0.24-0.77)
0.005
0.43(0.21-0.86)
0.018
Grade1, 2 vs 3
0.34(0.17-0.67)
0.002
0.26(0.11-0.64)
0.003
Stage I-II vs III-IV
0.21(0.07-0.58)
0.003
0.08(0.01-0.61)
0.015
Optimal vs Suboptimal
0.33 (0.18-0.59)
0.000
0.25 (0.13-0.51)
0.000
Type I vs Type II
0.52(0.24-1.13)
0.099
0.07(0.01-0.51)
0.009
Multivariate analysis
miR-9
0.24(0.12-0.50)
0.000
0.37(0.18-0.76)
0.007
Stage I-II vs III-IV
0.31(0.11-0.89)
0.029
0.15(0.02-1.16)
0.069
Optimal vs Suboptimal
0.24(0.11-0.53)
0.000
0.41(0.20-0.85)
0.016
Type I vs Type II
0.87(0.38-2.01)
0.750
0.11(0.01-0.78)
0.028
HR, hazard ratio; CI, confidence interval
Li et al. BMC Cancer (2015) 15:509
Page 5 of 10
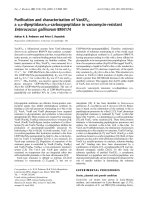
Fig. 2 CCNG1 is the direct target of miR-9 and modulates the paclitaxel sensitivity of EOC cells a. Modulating miR-9 expression changed
paclitaxel sensitivity of ST30 and SKOV3 cells. ST30 cells were transfected with miR-9 mimic or negative control(IC50 = 820.89 ± 21.62 nM VS 2424.56 ±
56.83nM, P = 0.001), SKOV3 cells were transfected with miR-9 inhibitor or negative control (IC50 = 122.74 ± 10.12 nM VS64.63 ± 2.74 nM, P = 0.000), the
cytotoxicity of paclitaxel on EOC cells were assessed by MTS assay. b. Western blot analysis of CCNG1 in ST30 cells transfected with miR-9 mimic or
negative control. GAPDH was used as house-keeping gene. c. Dual luciferase reporter assay. 293 T cells were transfected with CCNG1 -wild type
3′UTR vectors or mutant 3′UTR vectors together with miR-9 mimic or its negative control. Luciferase activity was measured 48 h after cotransfection.
A decrease of the luciferase activity was observed in miR-9 overexpressing cells compared with control (* P = 0.008). d. Modulating miR-9 expression
changed paclitaxel sensitivity of A2780 and A2780R cells. A2780 cells were transfected with miR-9 inhibitor or negative control (IC50 = 95.644 ± 12.03 nM VS
38.16 ± 6.18 nM, P = 0.000), A2780R cells were transfected with miR-9 mimic or negative control(IC50 = 194.94 ± 9.36 nM VS 774.03 ± 49.19 nM,
P = 0.002). e. Western blot analysis of CCNG1 in SKOV3 cells transfected with miR-9 inhibitor, negative control or inhibitor combined with
CCNG1 siRNA. GAPDH was used as house-keeping gene. f. Modulating CCNG1 expression changed paclitaxel sensitivity of ovarian carcinoma.
Knockdown of CCNG1 alone enhanced paclitaxel cytotoxcity to ST30 cells (IC50 = 1468.50 ± 32.19 nM VS 2545.84 ± 168.83 nM, P = 0.000), while
deleption CCNG1 reversed the role of miR-9 inhibitor on the paclitaxel sensitivity of SKOV3 cells (IC50 = 65.35 ± 13.47 nM VS 177.36 ± 20.88 nM, P = 0.001).
The experiments were repeated three times
miR-9 could inhibit CCNG1 expression in ST30 cells,
while down-regulated miR-9 enhanced CCNG1 expression in SKOV3 cells (Fig. 2b, e). Using dual luciferase
reporter assay, we found that the relative luciferase
activities were significantly reduced in cells transfected
with CCNG1 WT- 3′UTR/miR-9 mimic vectors compared with those transfected with CCNG1 WT-3′UTR/
miR-9 mimic control (Fig. 2c). Furthermore, Realtime
RT-PCR suggested that mRNA expression of CCNG1 in
ST30 cells was significantly higher than that in SKOV3
(2.14 fold), which was contrary to the miR-9 expression
trends in SKOV3 and ST30 cells (Additional file 2: Figure
S1C). These data validate that miR-9 can directly bind to 3′
UTR of CCNG1 and CCNG1 is regulated by miR-9.
Li et al. BMC Cancer (2015) 15:509
CCNG1 depletion enhances the paclitaxel sensitivity of
EOC cells
CCNG1 was initially identified as a p53-regulated transcript induced by DNA damage [15]. Although its precise role on cellular growth control is still controversial,
CCNG1 has been regarded as an oncogene [16, 17].
CCNG1 gene copy number is an independent marker of
postsurgical survival in EOC patients who have received
chemotherapy with taxanes and platinum compounds
[18]. Thus it suggests that CCNG1, the target of miR-9,
probably modulates the paclitaxel-sensitivity of EOC. To
validate this hypothesis, we knocked down CCNG1
in ST30 cells through transfecting CCNG1 siRNA. The
roles of CCNG1 siRNAs were confirmed using realtime
RT-PCR and Western blot, and the most effective siRNA
was chosen (Additional file 2: Figure S1D, E). IC50 of
paclitaxel in ST30 cells was significantly decreased
after CCNG1 depletion (Fig. 2f ), which confirmed that
knockdown of CCNG1 alone would enhance paclitaxel
cytotoxicity to EOC cells. Furthermore, when miR-9 inhibitor was transfected into SKOV3 cell accompanied
with CCNG1 siRNA, the CCNG1 expression and the
affection of miR-9 inhibitor on paclitaxel sensitivity were
significantly reversed (Fig. 2e, f ). Therefore, the results
indicate that CCNG1, as one direct target of miR-9,
participates in the regulation of paclitaxel-sensitivity in
EOC cells.
miR-9-1 and 3 loci are hypermethylated in paclitaxel
resistant EOC cells
BSP revealed higher frequency of DNA methylation of
miR-9-1 and miR-9-3 in ST30 and A2780R cells compared with their parental cells (Fig. 3a-c and Table 2).
Again, MSP presented similar results (Fig. 3d). We
further detected the methylation status of all three independent miR-9 gene loci in 66 EOC tissues using MSP
and found chemo-resistant specific DNA hypermethylation
patterns. The miR-9-1 and 3 genes exhibited a significantly
DNA hypermethylation status in the chemoresistant
tissues compared with chemosensitive tissues, as shown
in Table 3. Thus, our data suggest that decreased miR-9
expression might result from DNA hypermethylation in
EOC cells.
Regulating miR-9 gene methylation changes
chemo-sensitivity of ST30 cells
To confirm the influence of DNA methylation on miR-9
expression and chemo- sensitivity in EOC cells, miR-9
level of EOC cells were detected after cultured with or
without DAC, an unspecific demethylation reagent. We
found that low miR-9 expression in ST30 cells could be
restored by genomic DNA hypomethylation (Fig. 3e).
Therefore, Regulating DNA methylation would change
Page 6 of 10
the transcriptional activity of miR-9 in paclitaxel resistant EOC cells.
MTS assay showed that the IC50 value of ST30 was
significantly increased in miR-9 inhibitor treated group
and significantly decreased in DAC treated group, compared with that in miR-9 inhibitor control group. While
DAC combined with miR-9 inhibitor group had no significantly effect on IC50 of ST30. (Fig.3f ). These results
suggest that hypermethylation of miR-9 genes, mainly
miR-9-1 and miR-9-3, would down-regulate miR-9
expression of EOC. Consequently, decreased miR-9 expression results in paclitaxel resistance of EOC cells.
Thus, miR-9 is probably a potential therapeutic target
and ablation of miR-9 hypermethylation status may
partly reverse chemo-sensitivity in paclitaxel resistance
EOC cells.
Paclitaxel induces decreased miR-9 expression in EOC
cells through influencing DNA methylation
SKOV3 and A2780 were exposed to 10uM paclitaxel for
60 min before the drug was washed out. The miR-9
levels decreased after drug exposure in both cell lines,
with the peak at 24 h (Fig. 4d), suggesting that the
changes in miR-9 expression might be induced by paclitaxel. Since DNA hypermethylation was confirmed in
paclitaxel resistant cells, we further determined whether
the DNA methlyation status of ovarian carcinoma cell
lines was changed after paclitaxel treatment. BSP results
(Fig. 4a, c and Table 2) revealed a higher frequency of
DNA methylation of miR-9-1 and 3 in both cell lines at
24 h after drug exposure. In addition, DNA methylation
of miR-9-2 was also increased after drug exposure,
although not significantly (Fig. 4b). Our findings suggest
that paclitaxel resistance produced by methylation- associated miR-9 deregulation may be secondary from paclitaxel treatment in EOC cells.
Discussion
Despite multiple new approaches of treatment, the high
rates of death from EOC have remained largely unchanged
for many years, with a five-year overall survival of only
30–39 % [19]. Dramatically poor prognosis of EOC patients is due to the development of chemoresistance.
Therefore, it is imperative to identify new therapeutic
targets that can reverse chemoresistance of EOC.
miRNA represents a new class of small non-coding
RNA that regulates multiple gene expression. Upregulated miRNA could potentially target and downregulate tumor suppressor genes, whereas down-regulated
miRNA could potentially increase the expression of oncogenes [20]. Furthermore, studies suggested that miRNA
might influence the response to chemotherapy [21–23].
Several studies have revealed that miR-9 possesses opposite
functions in different types of cancer. For examples, miR-9
Li et al. BMC Cancer (2015) 15:509
Page 7 of 10
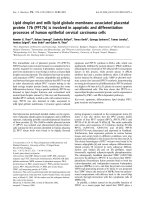
Fig. 3 Methylation status of Hsa-miR-9 genes in EOC cells and their effects on the paclitaxel sensitivity. a. BSP results of the hsa-miR-9-1 CpG
island region in two pairs of paclitaxel sensitive and resistant EOC cell lines. 10 clones were sequenced for each cell line. Each circle indicates a
CpG dinucleotide, black circle: methylated CpG; open circle: unmethylated CpG. b. BSP results of the hsa-miR-9-2 CpG island region in two pairs
of paclitaxel sensitive and resistant EOC cell lines. 10–12 clones were sequenced for each cell line. c. BSP restuls of the hsa-miR-9-3 CpG island
region in two pairs of paclitaxel sensitive and resistant EOC cell lines. 11 clones were sequenced for each cell line. d. MSP of three hsa-miR-9
genes in different ovarian carcinoma cell lines. e. Real-time RT-PCR analysis of miR-9 in ST30 cell lines treated with or without DAC. Low miR-9
expression in ST30 cells was restored by DAC (P = 0.000). f. The effect of DAC and miR-9 inhibitor on the paclitaxel sensitivity of ST30 cell lines.
The inhibited rates of paclitaxel on ST30 cell lines treated with or without miR-9 inhibitor, DAC combined with miR-9 inhibitor or DAC were
assessed by MTS assay and the IC50 values were 3295.54 ± 154.87nM, 2590.36 ± 126.68nM, and 2057.35 ± 13.54nM in turn, compared with control
(IC50 = 2898.94 ± 155.75 nM), P = 0.001, 0.056 and 0.035 in turn. The experiments were repeated three times
Table 2 The methylation proportion of miR-9 genes in different EOC cell lines
SKOV3
SK-treated
ST30
A2780
A2780-treated
A2780R
miR-9-1
48.89 %
64.44 %#
65.56 %*
78.33 %
92.22 %#
93.33 %*
miR-9-2
74.07 %
78.70 %
75.76 %
4.44 %
11.11 %
10.10 %
miR-9-3
21.56 %
28.29 %##
55.84 %**
11.43 %
18.86 %##
88.05 %**
The methylation proportions of miR-9-1 and miR-9-3 in ST30 and A2780 cells were significantly higher compared with their parent paclitaxel sensitive EOC cell
lines SKOV3 and A2780, *P = 0.001 and 0.000, **P = 0.000 and 0.000. The methylation proportions of miR-9-1 and miR-9-3 were also increased significantly in
paclitaxel treated SKOV3 and A2780 cells. #P = 0.002 and 0.000, ##P = 0.035 and 0.005
Li et al. BMC Cancer (2015) 15:509
Page 8 of 10
Table 3 MSP of three miR-9 genes in paclitaxel sensitive and
resistant ovarian carcinoma tissues
miR-9-1a
miR-9-2
b
miR-9-3
b
M
M/U
U
Ratio
sensitive
5
17
0
18.18 %
resistant
1
43
0
2.27 %
sensitive
0
13
9
59.09 %
resistant
0
17
27
38.64 %
sensitive
0
17
5
77.27 %
resistant
0
21
23
47.73 %
P-value
0.006
0.116
0.022
M methylated, M/U homozygously methylated, U unmethylated
a
The methylation ratio of miR-9-1 was calculated as methylated patients/all
patients, because none was unmethylated
b
The methylation ratio of miR-9-2 and 3 was calculated as homozygously
methylated patients/all patients
inhibits the growth of ovarian cancer and metastasis
of gastric cancer [24, 25], and affects cell metabolism
in cervical cancer [26]. Conversely, miR-9 promotes
epithelial-mesenchymal transition and stimulates metastasis in breast cancer [27]. These opposing effects
of miR-9 in different cancers imply that miR-9 is
histological type specific and context-dependent. However,
the effect of miR-9 on paclitaxel-sensitivity is still unclear
up to date.
Paclitaxel is most widely used as a first-line therapeutic drug for EOC patients today. Here, we validated
that miR-9 was significantly down-regulated in chemoresistant EOC cells and tissues, as our previous microRNA
microarray result. miR-9 level was strongly correlated
with PFS and OS of EOC patients and those with lower
miR-9 expression presented poorer prognosis. The association of miR-9 level with prognosis implies a link between miR-9 and the paclitaxel-sensitivity of EOC. Just
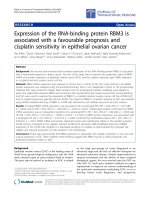
Fig. 4 Paclitaxel down-regulates miR-9 expression in EOC cells through influencing DNA methylation. a. BSP results of the hsa-miR-9-1 CpG island
region in different ovarian carcinoma cell lines before and after 24 h paclitaxel treatment. 10 clones were sequenced for each cell line. Each circle
indicates a CpG dinucleotide, black circle: methylated CpG; open circle: unmethylated CpG. b. BSP results of the hsa-miR-9-2 CpG island region in
different ovarian carcinoma cell lines before and after 24 h paclitaxel treatment. 10–12 clones were sequenced for each cell line. c. BSP results of
the hsa-miR-9-3 CpG island region in different ovarian carcinoma cell lines before and after 24 h paclitaxel treatment. 10–11 clones were sequenced for
each cell line. d. Real-time RT-PCR analysis of miR-9 in SKOV3 and A2780 cell lines treated with paclitaxel at different time. The experiments
were repeated three times
Li et al. BMC Cancer (2015) 15:509
as we supposed, enforced expression of miR-9 significantly increased paclitaxel sensitivity in resistant EOC
cells, while inhibition of miR-9 expression significantly
decreased paclitaxel sensitivity in sensitive cells. Our
findings suggest that miR-9 negatively regulates paclitaxel sensitivity and up-regulation of miR-9 probably can
abolish paclitaxel-resistance of EOC cells.
Identification of miRNA gene targets helps us to
understand the mechanism of miRNA function. According to the TargetScan database, we found over 1200
predicted Hsa-miR-9 targets, including some familiar
oncogenes. Among them, CCNG1 is confirmed as one
of the direct targets for miR-9, which is consistent with
recent study [28]. Increased CCNG1 is accompanied
with paclitaxel-induced spindle assembly checkpointmediated mitotic arrest and promotes cell survival after
paclitaxel exposure [18]. Thus, CCNG1 may serve as a
marker for the sensitivity of cancers to anti-mitotic therapy through regulating the outcome of taxane-induced
mitotic arrest. Here, we found that depletion of CCNG1
increased the paclitaxel toxicity to EOC cells, and the
effect of miR-9 inhibitor on paclitaxel sensitivity of
SKOV3 was remarkably reversed by CCNG1 siRNA.
Our findings indicate that CCNG1-mediated paclitaxel
resistance might be induced by decreased miR-9. And
miR-9, as well as its target gene CCNG1, may be one of
the key pathways in regulating paclitaxel-sensitivity in
EOC cells.
To identify epigenetic mechanism involved in aberrant
miR-9 expression, methylation status of miR-9 genes in
EOC was detected. We found methylations of the miR9-1 and 3 genes were significantly higher in paclitaxel
resistant EOC than those in paclitaxel sensitive cells.
Furthermore, demethylation reagent DAC not only
restored miR-9 expression, but also enhanced the
paclitaxel-sensitivity in resistant cells, suggesting that decreased miR-9 level in chemoresistant EOC results from
DNA hypermethylation. As we know, chemoresistance
can be de novo or acquired in clinical settings and may
be a strategy by which cells stand against paclitaxel exposure [29]. To uncover the causation of miR-9 deregulation and DNA methylation in paclitaxel resistant EOC
cells, we treated EOC cells with paclitaxel. Results revealed that DNA methylation of miR-9 was increased
and miR-9 expression was decreased in EOC cells after
24 h paclitaxel expoure. These data suggest paclitaxel induces miR-9 gene hypermethylation and down-regulates
miR-9 expression in EOC cells. Consequently, miR-9
down-regulation induces the CCNG1 overexpression
and causes paclitaxel resistance. Thus, paclitaxel resistance in EOC cells may be secondary and result from
paclitaxel treatment, which inversely results in chemotherapy failure. These findings not only help us to uncover an intrinsic pathway of paclitaxel-induced miR-9
Page 9 of 10
down-regulation and CCNG1 overexpression, but also
provide a novel insight into the underlying molecular
mechanisms in chemoresistant EOC.
Conclusions
In summary, we identified miR-9 as a regulator for paclitaxel sensitivity in EOC. miR-9 expression is regulated
by gene hyperemthylation and related to prognosis. Demethylation of miR-9 gene would restore miR-9 expression
and improve the paclitaxel sensitivity of EOC. Inversely,
methylation-associated miR-9 deregulation could be induced by paclitaxel exposure in EOC cells. CCNG1, as a
direct target of miR-9, could mediate paclitaxel resistance.
These findings might provide a new potential therapeutic
target to reverse paclitaxel resistance in EOC patients.
Additional files
Additional file 1: Table S1. The characteristics of ovarian carcinoma
patients. Table S2. The sequences of primers in Real time RT-PCR and the
dual luciferase reporter assay.
Additional file 2: Figure S1. The trasnsfection efficiency in EOC cells
validated by Real-time RT-PCR and Western Blot. A and B. Real-time
RT-PCR analysis of miR-9 in transfected cells. Compared with negative
control, (A) miR-9 mimic transfected ST30 cells showed a 2219.37 fold
increase of miR-9 (P = 0.000), (B) miR-9 inhibitor transfected SKOV3 cells
led to a 12.59 fold reduction of miR-9 compared with negative control
(P = 0.002). C. Real-time RT-PCR analysis of CCNG1 in ST30 cell and SKOV3
cells. D. Real-time RT-PCR analysis of CCNG1 in ST30 cell lines treated with
CCNG1 siRNA1, 2, 3 or their negative control. All three siRNA achieved
more than 80 % interference efficiency. E. Western Blot analysis of CCNG1
in ST30 cell lines treated with CCNG1 siRNA1, 2, 3 or their negative
control. siRNA2 was validated as the most effective siRNA.
Abbreviations
EOC: Epithelial ovarian carcinoma; OS: Overall survival time; PFS: Progression
free survival time; ST30: SKOV3-TR30; CCNG1: Cyclin G1; RT-PCR: Reverse
transcript-polymerase chain reaction; DAC: 5-aza-2′-deoxycytidine; MTS:
Cell-Titter 96 AQueous one solution cell proliferation assay; IC50 values: The
concentration of drugs that produced a 50 % reduction of absorbance;
BSP: Bisulfite sequencing; MSP: Methylation-specific polymerase chain
reaction.
Competing interests
The authors declare that they have no competing interests.
Authors’ contributions
XL carried out cell culture, transfection and dual luciferase reporter assay,
and drafted the manuscript. QP did statistical analysis and cell culture. XW
collected clinical information and samples, and participated the epigenetic
studies. YM carried out PCR. WL carried out Western Blot. XX carried out
Cytotoxicity assay and participated in the design of the study. XC conceived
of the study and designed the experiment. All authors read and approved
the final manuscript.
Acknowledgements
We thank Professor Ding Ma (Tongji Hospital, Tongji Medical College,
Huazhong University of Science and Technology, Wuhan, Hubei, China) for
his kindly gift of ovarian carcinoma cell lines: A2780 and A2780R. We also
thank pathologist Dr. Xiaoduan Chen for her histological diagnosis and Mr.
Chengliang Zhou and Jiajie Shen for their experimental technique supports.
This work was funded by the projects of National Natural Science
Foundation of China (81001164), Zhejiang Province Natural Scientific
Foundation for Distinguished Young Scientists (LR15H160001), Commonweal
Li et al. BMC Cancer (2015) 15:509
Technology Research and Social Development Project of Science Technology
Department of Zhejiang Province (2010C33041) and National High
Technology Research and Development Program (863) (2012AA02A507).
Author details
1
Women’s Reproductive Health Laboratory of Zhejiang Province, Women’s
Hospital, School of Medicine, Zhejiang University, No.1 Xueshi Road, 310006
Hangzhou, Zhejiang, China. 2Department of Gynecologic Oncology,
Women’s Hospital, School of Medicine, Zhejiang University, No.1 Xueshi
Road, 310006 Hangzhou, Zhejiang, China. 3Zhejiang Financial College, No.
118 Xueyuan Street, 310018 Hangzhou, Zhejiang, China.
Received: 14 July 2014 Accepted: 19 June 2015
References
1. Siegel R, Naishadham D, Jemal A. Cancer statistics. CA Cancer J Clin.
2013;63:11–30.
2. Burger RA, Brady MF, Bookman MA, Fleming GF, Monk BJ, Huang H, et al.
Incorporation of bevacizumab in the primary treatment of ovarian cancer.
N Engl J Med. 2011;365:2473–83.
3. Bookman MA, Brady MF, McGuire WP, Harper PG, Alberts DS, Friedlander M,
et al. Evaluation of new platinum-based treatment regimens in advanced-stage
ovarian cancer: a Phase III Trial of the Gynecologic Cancer Intergroup. J Clin
Oncol. 2009;27:1419–25.
4. Garzon R, Calin GA, Croce CM. MicroRNAs in cancer. Annu Rev Med.
2009;60:167–79.
5. Esquela-Kerscher A, Slack FJ. OncomiRs-microRNAs with a role in cancer.
Nat Rev Cancer. 2006;6:259–69.
6. Hammond SM. MicroRNAs as tumor suppressors. Nat Genet. 2007;39:582–3.
7. Tsai KW, Liao YL, Wu CW, Hu LY, Li SC, Chan WC, et al. Aberrant
hypermethylation of miR-9 genes in gastric cancer. Epigenetics.
2011;6:1189–97.
8. Li SC, Chan WC, Hu LY, Lai CH, Hsu CN, Lin WC. Identification of
homologous microRNAs in 56 animal genomes. Genomics. 2010;96:1–9.
9. Laios A, O’Toole S, Flavin R, Martin C, Kelly L, Ring M, et al. Potential role of
miR-9 and miR-223 in recurrent ovarian cancer. Mol Cancer. 2008;7:35.
10. Lujambio A, Calin GA, Villanueva A, Finn SP, Barrett C, Loda M, et al. A
microRNA DNA methylation signature for human cancer metastasis. Proc
Natl Acad Sci U S A. 2008;105:13556–61.
11. Hildebrandt MA, Gu J, Lin J, Ye Y, Tan W, Tamboli P, et al. Hsa-miR-9
methylation status is associated with cancer development and metastatic
recurrence in patients with clear cell renal cell carcinoma. Oncogene.
2010;29:5724–8.
12. Heller G, Weinzierl M, Noll C, Babinsky V, Ziegler B, Altenberger C, et al.
Genome-wide microRNA expression profiling identifies miR-9-3 and
miR-193a as targets for DNA methylation in non-small cell lung cancers.
Clin Cancer Res. 2012;18:1619–29.
13. Li X, Lu Y, Chen Y, Lu W, Xie X. MicroRNA profile of paclitaxel-resistant
serous ovarian carcinoma based on formalin-fixed paraffinembedded
samples. BMC Cancer. 2013;13:216.
14. Fu Y, Ye D, Chen H, Lu W, Ye F, Xie X. Weakened spindle checkpoint with
reduced BubR1 expression in paclitaxel-resistant ovarian carcinoma cell line
SKOV3-TR30. Gynecol Oncol. 2007;105:66–73.
15. Okamoto K, Beach D. Cyclin G is a transcriptional target of the p53 tumor
suppressor protein. EMBO J. 1994;13:4816–22.
16. Gramantieri L, Ferracin M, Fornari F, Veronese A, Sabbioni S, Liu CG, et al.
Cyclin G1 is a target of miR-122a, a microRNA frequently down-regulated in
human hepatocellular carcinoma. Cancer Res. 2007;67:6092–9.
17. Fornari F, Gramantieri L, Giovannini C, Veronese A, Ferracin M, Sabbioni S,
et al. MiR-122/cyclin G1 interaction modulates p53 activity and affects
doxorubicin sensitivity of human hepatocarcinoma cells. Cancer Res.
2009;69:5761–7.
18. Russell P, Hennessy BT, Li J, Carey MS, Bast RC, Freeman T, et al. Cyclin G1
regulates the outcome of taxane-induced mitotic checkpoint arrest.
Oncogene. 2012;31:2450–60.
19. Parmar MK, Ledermann JA, Colombo N, du Bois A, Delaloye JF, Kristensen
GB, et al. Paclitaxel plus platinum-based chemotherapy versus conventional
platinum-based chemotherapy in women with relapsed ovarian cancer:
the ICON4/AGO-OVAR-2.2 trial. Lancet. 2003;361:2099–106.
Page 10 of 10
20. Liu S, Kumar SM, Lu H, Liu A, Yang R, Pushparajan A, et al. MicroRNA-9
up-regulates E-cadherin through inhibition of NF-κB1–Snail1 pathway in
melanoma. J Pathol. 2012;226:61–72.
21. Helleman J, Jansen MP, Burger C, van der Burg ME, Berns EM. Integrated
genomics of chemotherapy resistant ovarian cancer: a role for extracellular
matrix, TGFbeta and regulating microRNAs. Int J Biochem Cell Biol.
2010;42:25–30.
22. van Jaarsveld MT, Helleman J, Berns EM, Wiemer EA. MicroRNAs in
ovarian cancer biology and therapy resistance. Int J Biochem Cell Biol.
2010;42:1282–90.
23. Sorrentino A, Liu CG, Addario A, Peschle C, Scambia G, Ferlini C. Role
of microRNAs in drug-resistant ovarian cancer cells. Gynecol Oncol.
2008;111:478–86.
24. Guo LM, Pu Y, Han Z, Liu T, Li YX, Liu M, et al. MicroRNA-9 inhibits
ovarian cancer cell growth through regulation of NF-kappaB1. FEBS J.
2009;276:5537–46.
25. Wan HY, Guo LM, Liu T, Liu M, Li X, Tang H. Regulation of the transcription
factor NF-kappaB1 by microRNA-9 in human gastric adenocarcinoma.
Mol Cancer. 2010;9:16.
26. Hu X, Schwarz JK, Lewis Jr JS, Huettner PC, Rader JS, Deasy JO, et al. A
microRNA expression signature for cervical cancer prognosis. Cancer Res.
2010;70:1441–8.
27. Ma L, Young J, Prabhala H, Pan E, Mestdagh P, Muth D, et al. miR-9,
a MYC/MYCN activated microRNA, regulates E-cadherin and cancer
metastasis. Nat Cell Biol. 2010;12:247–56.
28. Selcuklu SD, Donoghue MT, Rehmet K, de Souza GM, Fort A, Kovvuru P,
et al. MicroRNA-9 inhibition of cell proliferation and identification of novel
miR-9 targets by transcriptome profiling in breast cancer cells. J Biol Chem.
2012;287:29516–28.
29. Munker R, Liu CG, Taccioli C, Alder H, Heerema N. MicroRNA profiles of
drug-resistant myeloma cell lines. Acta Haematol. 2010;123:201–4.
Submit your next manuscript to BioMed Central
and take full advantage of:
• Convenient online submission
• Thorough peer review
• No space constraints or color figure charges
• Immediate publication on acceptance
• Inclusion in PubMed, CAS, Scopus and Google Scholar
• Research which is freely available for redistribution
Submit your manuscript at
www.biomedcentral.com/submit