Expression of an estrogen-regulated variant transcript of the peroxisomal branched chain fatty acid oxidase ACOX2 in breast carcinomas
Bạn đang xem bản rút gọn của tài liệu. Xem và tải ngay bản đầy đủ của tài liệu tại đây (1.94 MB, 13 trang )
Bjørklund et al. BMC Cancer (2015) 15:524
DOI 10.1186/s12885-015-1510-8
RESEARCH ARTICLE
Open Access
Expression of an estrogen-regulated variant
transcript of the peroxisomal branched
chain fatty acid oxidase ACOX2 in breast
carcinomas
Sunniva Stordal Bjørklund1,2,5, Vessela N. Kristensen1,5,6, Michael Seiler7, Surendra Kumar1,6, Grethe I. Grenaker Alnæs1,
Yao Ming2, John Kerrigan2, Bjørn Naume5,8, Ravi Sachidanandam4, Gyan Bhanot2,3, Anne-Lise Børresen-Dale1,5
and Shridar Ganesan2*
Abstract
Background: Alternate transcripts from a single gene locus greatly enhance the combinatorial flexibility of the
human transcriptome. Different patterns of exon usage have been observed when comparing normal tissue to
cancers, suggesting that variant transcripts may play a role in the tumor phenotype.
Methods: Ribonucleic acid-sequencing (RNA-seq) data from breast cancer samples was used to identify an intronic
start variant transcript of Acyl-CoA oxidase 2, ACOX2 (ACOX2-i9). Difference in expression between Estrogen Receptor
(ER) positive and ER negative patients was assessed by the Wilcoxon rank sum test, and the findings validated in The
Cancer Genome Atlas (TCGA) breast cancer dataset (BRCA). ACOX2-i9 expression was also assessed in cell lines using
both quantitative reverse transcriptase-polymerase chain reaction (qRT-PCR) and Western blot analysis. Knock down by
short hairpin RNA (shRNA) and colony formation assays were used to determine whether ACOX2-i9 expression would
influence cellular fitness. The effect of ACOX2-i9 expression on patient survival was assessed by the Kaplan-Meier
survival function, and association to clinical parameters was analyzed using a Fisher exact test.
Results: The expression and translation of ACOX2-i9 into a 25 kDa protein was demonstrated in HepG2 cells as well as
in several breast cancer cell lines. shRNA knock down of the ACOX2-i9 variant resulted in decreased cell viability of
T47D and MDA-MB 436 cells. Moreover, expression of ACOX2-i9 was shown to be estrogen regulated, being induced
by propyl pyrazoletriol and inhibited by tamoxifen and fulvestrant in ER+ T47D and Mcf-7 cells, but not in the ERMDA-MB 436 cell line. This variant transcript showed expression predominantly in ER-positive breast tumors as assessed
in our initial set of 53 breast cancers and further validated in 87 tumor/normal pairs from the TCGA breast cancer
dataset, and expression was associated with better outcome in ER positive patients.
Conclusions: ACOX2-i9 is specifically enriched in ER+ breast cancers where expression of the variant is associated with
improved outcome. These data identify variant ACOX2 as a potential novel therapeutic biomarker in ER+ breast tumors.
Keywords: Breast cancer, Fatty acid oxidation, Gene transcription, Steroid hormone receptor, Tumor marker
* Correspondence:
2
Rutgers Cancer Institute of New Jersey, 195 Little Albany Street, New
Brunswick, NJ, 08903, USA
Full list of author information is available at the end of the article
© 2015 Bjørklund et al. This is an Open Access article distributed under the terms of the Creative Commons Attribution
License ( which permits unrestricted use, distribution, and reproduction in any
medium, provided the original work is properly credited. The Creative Commons Public Domain Dedication waiver (http://
creativecommons.org/publicdomain/zero/1.0/) applies to the data made available in this article, unless otherwise stated.
Bjørklund et al. BMC Cancer (2015) 15:524
Background
Breast cancer is the most common form of cancer
among women worldwide. It is a greatly heterogeneous
disease with respect to prognosis, treatment response,
and patient outcome. In the past decade, clinically diverse subclasses based on the expression profiles of specific sets of genes, have been identified [1–3]. Different
methods have identified at least four stable subgroups of
cancer which correspond with the following clinical
characteristics 1. ER- positive, HER2-nonamplified and
low-grade (Lum-A), 2. ER-positive, HER2-nonamplified
and high-grade (Lum-B), 3. ER-, PR-, and Her2-negative
(Basal-like), 4. ERBB2/Her2-amplified (HER2 enriched).
Recently Curtis et al. proposed a further subdivision into
ten distinct molecular groups based on both expression
and copy number [4]. This emphasizes the complexity of
breast cancer, and the need for robust classification and
biomarkers for the existing subtypes in order to make
optimal treatment decision for each individual patient.
Alternate transcripts from alternative splicing of a
single gene locus increase the number of gene products
encoded by the human genome. It is estimated that
90 % of all multi-exon genes are subjected to some
form of alternative splicing [5]. Alternate promoter usage
and post-transcriptional processing of mRNAs can give
rise to functionally distinct protein isoforms. There is
increasing evidence linking aberrant and alternative
transcription to cancer. However, to date, very little is
known about the mechanisms involved, or whether alternate transcripts are a driving force or the result of
cancer progression [6].
Cancer cells are known to undergo several changes in
metabolism, which render them more efficient at producing macromolecules necessary for growth and proliferation. Numerous studies have focused on the metabolic
switch to aerobic glycolysis, a process that may not be as
efficient for ATP production, but which is highly responsive to changes in the cell’s need for energy and macromolecules used for building mass [7]. This form of
glycolysis also supports lipid synthesis and directs amino
acids to protein synthesis, both processes necessary for
growth and proliferation [8]. Recent studies have focused
on fatty acid oxidation (FAO), showing that increased
FAO facilitates survival of mammary epithelial cells as
they detach from the extra cellular matrix [9]. Additionally, the expression of genes involved in increased FAO
have been shown to be associated with poor prognosis
in breast cancer [10].
ACOX2 is the rate limiting enzyme in the β-oxidation
of branched, long chain fatty acids and in the synthesis
of Bile-acid precursor molecules [11] (Fig. 1a). A variant
transcript of ACOX2 has been detected in hepatocellular
carcinoma (HCC) where it was suggested to play a role
in tumor progression [12].
Page 2 of 13
Using RNA-seq data, we found that this ACOX2 variant, ACOX2-i9, is present in a subset of human breast
cancers. We further demonstrated that this variant is
translated into a detectable protein in breast cancer cell
lines, and that knockdown of the variant led to decreased cell growth and viability. The TCGA breast cancer dataset and an independent cohort of 113 tumors
from patients with long term follow up was used to investigate expression of the variant in clinical samples as
well as to study it’s association with clinical outcome.
Methods
Cell lines
HeLa, Hek-293 T, HepG2, Mcf-7, MDA-MB 231, MDAMB 436, MDA-MB 468, and T47D cells were obtained
from ATCC and kept in recommended growth media at
37 degrees, supplemented with 5 % CO2.
qRT-PCR
RNA was extracted from cells using the Trizol reagent
according to the manufacturer’s instructions. Complementary DNA was transcribed using Superscript II
from Invitrogen for cell lines and High-Capacity cDNA
Reverse Transcription Kit (Applied Biosystems) for patient samples. Real-Time PCR was carried out on the
Mx3005p QPCR system using SYBR green dye for detection. Transcript levels were assayed in triplicates
and normalized to GAPDH mRNA expression. Primer
efficiency was assayed for all pairs using a standard dilution curve, and relative expression levels were calculated using the method suggested in [13]. Primers were
designed using Primer3 software and were as follows:
ACOX2 forward 5’GCAAAGGTCCTGGACTACCA3’,
reverse 5’CCAGGGGACATCTGAGTCT3’. ACOX2-i9
forward 5’ACAGGGTTGGTCCCTATGGT3’, reverse 5’AG
GTCAGGTGCGGTGAGATA3’. The same primers were
used for qRT-PCR, conventional RT-PCR, and Sanger sequencing of patient samples.
Cloning and constructs
RNA from HepG2 cells was isolated using the Trizol
reagent, and cDNA was synthesized using Superscript II
from Invitrogen. PCR was carried out with the Pfu ultra
enzyme (Sigma). Full length ACOX2, and ACOX2-i9
were cloned into the TOPO-pcDNA3.1-V5/His vector
(Sigma) using the following primers; ACOX2 forward
5’CACCATGGGCAGCCCAGTGCA 3’, ACOX2-i9 forward 5’ CACCATGAGTAGATGCTCAGTA 3’, reverse
(same for both) 5’ TAGCTTGGATCTCCAACTTTG 3’
and both constructs were confirmed by sequencing.
shRNAs and stable knock down cells
shRNA constructs in the pLKO.1 Lentiviral vector
were purchased from Sigma. Viral packaging vectors
Bjørklund et al. BMC Cancer (2015) 15:524
Fig. 1 (See legend on next page.)
Page 3 of 13
Bjørklund et al. BMC Cancer (2015) 15:524
Page 4 of 13
(See figure on previous page.)
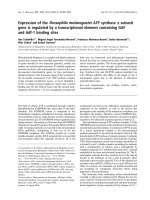
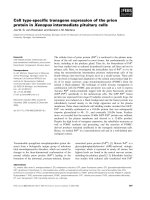
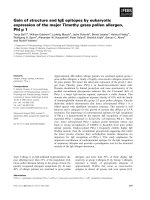
Fig. 1 ACOX2 expression in TCGA BRCA cohort. ACOX2 is involved in the oxidation of very long chain fatty acids, VLCFA, and branched chain
fatty acids, BCFA, and in the synthesis of bile-acid precursor molecules as schematically illustrated in Fig. 1a. The ACOX2 intronic variant, ACOX2-i9, is
initiated just upstream of exon 10 of the full-length transcript (b). The translated protein retains the Acyl-CoA oxidase domain, and the Preoxisomal
Targeting Signal, but lacks the fatty acid binding domain of the full-length protein. 1c shows a model of ACOX2-i9 aligned with 2DDH (Rat ACOX2).
The template 2DDH is colored green and the model (i9) is colored cyan. The fatty acid is depicted as orange colored spheres and the FAD molecule
(and water depicted as small red spheres) is depicted as ball-stick and colored by element. The difference in Log2 R(ACOX2-i9/ACOX2) Tumor – log2 R
Normal in 87 tumor/normal pairs from the TCGA BRCA dataset are shown in d, see Methods for details. Values > 0 indicate that the Ratio of ACOX2-i9/
ACOX2 is higher in the tumor. e shows log2 expression of ACOX2 in Normal/Tumor. ACOX2 is expressed at higher levels in the Normal sample when
the log2 ratio >0. Normalized log2 RPKM expression of each exon of ACOX2 in Her2 negative background separated by ER status are shown in f, and
in ER negative patients separated by Her2 status (g)
psPAX2 and pMD2.G were obtained from Addgene
(plasmids 12260 and 12259). Recommended protocol
from Addgene was followed. Briefly; Hek-293 T cells
were transfected with three plasmids, psPAX2, pMDG.2,
and either empty pLKO.1 vector (control), pLKO.1 vector
with shRNA targeting the N-terminal region of ACOX2
(TRCN0000046214 (N) and TRCN0000046215 (N’), or
shRNA targeting the C-terminal region (TRC0000046217
(C) and TRCN0000046216 (C’) using the Fugene 6 transfection reagent. Viral particles were harvested after 48 and
72 h, and were used to infect T47D and MDA-MB 436
cells in media containing 8ug/ml polybrene. Cells were selected using RPMI1640/DMEM:F12(1:1) media supplemented with 2,5 ug/ml Puromycin for 5 days and kept
under selective pressure. Knockdown was confirmed by
Western blotting.
Western Blot
Protein lysate was extracted using NETN buffer (20 mM
Tris (pH 8.0), 150 mM NaCl, 1 mM EDTA, 0.5 % NP40,
1x Protease inhibitor cocktail (Roche)). 30–40 ug protein,
optimized for each cell line, was loaded onto an Any-kD
SDS Polyacrylamide gel from Biorad, transferred to a
Nitrocellulose-membrane and probed with the C-terminal
monoclonal ACOX2 antibody from Sigma (SAB1404576)
or with a Tubulin antibody (Invitrogen).
In-vitro transcription and translation
In-vitro expression of ACOX2-i9 was carried out using
the human In vitro protein expression kit for DNA templates (Pierce) using 1 ug pcDNA3.1-V5/His-ACOX2-i9
vector and following the manufacturers instructions. Expression was assayed by western blotting using the Cterminal ACOX2 antibody.
Treatment of cell lines with selective estrogen receptor
modulators (SERMs)
T47D, Mcf-7, MDA-MB 436, and HepG2 cells were maintained under normal growth conditions and supplemented
with vehicle (EtOH/DMSO), 100nM 4-Hydroxytamoxifen
(4-OHT, tamoxifen) (HepG2- 200nM), 100nM fulvestrant
(ICI 182,780), or 1-100nM propyl pyrazoletriol (PPT) as
indicated for 48 h. For estrogen depletion, cells were kept
in Phenol-Red-free RPMI1640/DMEM/DMEM:F12(1:1)
supplemented with 10 % Charcoal stripped FBS for 72 h.
Colony formation assay
T47D stable cell lines were plated 200 cells per well in 6
well plates. MDA-MB 436 cells were plated 500 cells per
well in 6 well plates. All experiments were carried out in
triplicates and replicated at least 3 times. Cells were kept
in normal growth conditions, supplemented with 2.5 μg
Puromycin for 15 days. Cells were fixed by Methanol fixation, and stained with 0.5 % Crystal Violet. Colonies
containing 50 cells or more were counted as colonies.
Datasets
A. 37 tissue samples from the Cancer Institute of New
Jersey (CINJ) in NJ, USA and 16 tissue samples from
Oslo University Hospital, Radiumhospitalet, Norway,
Norway underwent RNA extraction using the Trizol
reagent per the manufacturer’s protocol. We followed
the standard Truseq protocol recommended by
Illumina for library preparation, and sequencing was
carried out using the Illumina Genome Analyzer IIx
or the Illumina HiSeq 2000 at the Mount Sinai School
of Medicine (MSSM). Raw sequence data is available
from the Sequence Read Archive using accession
number SRA057220. 29 bp single end reads were
aligned using TopHat version 2.0.9 against the human
reference genome (GRCh37.72). Cufflinks-2.2.0 was
used to assemble and estimate transcript abundance
using the annotation file provided in the package.
Cuffdiff was used to assess differential expression
between ER positive and ER negative samples. The
CummeRbund R package was used to further
explore, visualize and analyze result files obtained
from cuffdiff.
B. A total of 113 breast tumor tissue samples from the
MicMa cohort [14] underwent RNA extraction
using the Trizol reagent per the manufacturer’s
protocol, and PCR was performed to determine
whether the variant could be detected. Long-term
follow up data from this dataset was used for
survival analysis.
Bjørklund et al. BMC Cancer (2015) 15:524
C. Clinical and RNAseq data from the publically available
TCGA dataset from 846 breast cancer patients,
including all the 97 samples with a matched normal
sample was obtained and used for analysis of
ACOX2-i9 expression in tumor versus normal samples,
and of expression in groups of different clinical
compositions. ER and Her2 status were determined by
immunohistochemistry and annotated in the clinical
file. A total of 87 tumor/normal pairs with clearly
known ER status were used for this analysis.
Expression of the two different ACOX2 transcripts
were calculated based on the following; The ACOX2
gene has 15 exons. Let L0 be the sequence length of
exons 1–15 and let L1 be the sequence length of exons
10 through 15. Let r0 be the sum of reads mapped to
exons 1–9 and r1 be the sum of reads mapped to exons
10–15. Note that these are raw reads and not log transformed or processed into RPKM.
We will assume that the reads per unit nucleotide are
uniform for both the full transcript and the i9 transcript
(i.e., that these are the only two variants in the sample).
In this case, the number of reads assignable to the full
transcript are:
F0 ¼ ðr0 Â L0Þ=ðL0−L1Þ;
and the number of reads assignable to the i9 transcript are:
F1 ¼ r1ÀF0 Â L1=L0:
We then define the fraction R, which estimates the ratio of the mRNA level of the i9 transcript to the full
transcript as:
R ¼ ðmRNA Expression of i9 transcriptÞ=
ðmRNA Expression of full transcriptÞ
From this it follows that:
R ¼ ðF1=L1Þ=ðF0=L0Þ
log2 RPKM pr exon was used to plot all exons in the
ACOX2 locus from all patients in the TCGA cohort. The
difference in R in distinct clinical subgroups was assessed
by a Wilcoxon rank sum test.
Survival analysis
Kaplan-Meier survival curves were calculated using the
Survival package in R. 6 of the 113 patients in the cohort
did not have survival data and were excluded from this
part of the analysis. For statistical analysis the tumors
were categorized as ACOX2-i9 positive if a band was detected after 35 cycles of PCR, or ACOX2-i9 negative if
no band was detected. For test of association to clinical
parameters, a Fisher exact test was used. Analysis was
conducted in the R environment using R version 3.1.2.
Page 5 of 13
Ethics statement
Use of the samples from Oslo University Hospital was
approved by the Norwegian Regional Committee (REC)
for Medical and Health Research Ethics (REC South
East, reference numbers S97103 and 429–04148), all patients were informed and have declared written informed
consent that their samples are used for research. Samples from Rutgers Cancer Institute of New Jersey were
de-identified patient samples collected under a tissue
banking protocol and approved for use in this study by
The Rutgers Health Sciences New Brunswick/Piscataway
Institutional Review Board, number 0220080121. Individual patient consent for the use of these patient samples was not required.
Results
A variant of ACOX2 was identified in a subset of breast
carcinomas, and its presence was validated in the TCGA
BRCA dataset
In a genome wide screen aimed at identifying alternative
transcripts in breast tumors using RNA-seq, the presence
of an alternative mRNA transcribed from the ACOX2
locus in breast cancers was identified (Additional file 1:
Figure S1). This variant, ACOX2-i9, consists of exons 10–
15 of the full-length transcript, with a start site in intron 9,
approximately 150 base pairs upstream of exon 10
(Fig. 1b). Figure 1c shows the ACOX2-i9 sequence in a
model together with the rat homolog, 2DDH, for which
the crystal structure has been solved [15]. The ACOX2-i9
variant retains the sequence coding for a catalytic AcylCoA oxidase domain and the three amino acid C-terminal
Peroxisomal Targeting Signal, but lacks the full flavin adenine dinucleotide (FAD) and fatty acid binding domain of
the full-length protein [15]. ACOX2-i9 showed significantly higher expression in ER positive than in ER negative
tumors (Additional file 1: Figure S1C, p = 0.0148). It is
likely that the transcript detected in the breast tumors is
the same variant that was described in hepatocellular carcinoma [12]. RNA-seq and clinical data from the publically available TCGA BRCA dataset was then used to
validate the presence and expression of ACOX2-i9 [16].
The expression of ACOX2 and ACOX2-i9 in 87 tumor/
normal pairs with known ER status was calculated from
exon count data at the ACOX2 locus (see Methods
for details). Plotting the difference in log2 ratio of
ACOX2-i9 over ACOX2 in matched tumor/normal
samples from TCGA confirmed that ACOX2-i9 has
higher expression in tumors (Fig. 1d and Additional file 1:
Figure S2) (Difference in log2 R(Tum)-log2 R(Norm) >1
in 82 of 87 samples). The full length ACOX2 transcript is
expressed at higher levels in the normal samples from the
same patient (Fig. 1e and Additional file 1: Figure S2B).
ACOX2-i9 is expressed at significantly higher levels in ERpositive/Her2-negative samples compared to ER-negative/
Bjørklund et al. BMC Cancer (2015) 15:524
Her2-negative patients (Fig. 1f) (p = 0.000002, Wilcoxon
rank sum test, ratio of ACOX2-i9/ACOX2), and is also
higher in ER-negative/Her2-positive compared to ERnegative/Her2-negative patients (p = 0.001) (Fig. 1g).
ACOX2-i9 is expressed in breast cancer cell lines
RNA extracts from a panel of breast cancer cell lines, as
well as HepG2 hepatocellular carcinoma cells, were analyzed for the full length and variant ACOX2 transcripts
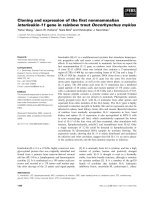
by qRT-PCR (Fig. 2a). Full length ACOX2 mRNA was
mainly detected in the HepG2 and T47D cell lines, but
it was also detectable in the MDA-MB 231 and MDAMB 436 cell lines. Using a forward primer that hybridized to a region in intron 9 (see Methods for details)
we observed that the variant transcript ACOX2-i9 was
highly expressed in HepG2 and the ER positive T47D
cell line, and present in detectable, but lower, levels in
the ER positive Mcf-7 cell line, as well as in the ER
negative MDA-MB 231, MDA-MB 436, and MDA-MB
468 cell lines.
ACOX2-i9 is translated into protein
In order to identify a possible protein product of ACOX2i9, protein was extracted from the breast cancer cell
lines and HepG2 cells and probed with a monoclonal
antibody raised against the far C-terminal (100aa) domain of ACOX2 (Fig. 2b). HepG2 cells showed high
levels of full-lenght ACOX2 at 75 kDa, which was not
detected in the breast cancer cell lines tested here. Instead, most prominently in T47D and MDA-MB 436, a
faster migrating species was detected as 2 bands at
Page 6 of 13
approximately 25–30 kDa. This short variant was also
strongly present in HepG2 cells, and detectable at low
intensity in MDA-MB 321 cells. When a highly sensitive chemiluminescent substrate was used for photodetection, Mcf-7 and MDA-MB 468 were also shown
to express ACOX2-i9 (Fig. 2c).
In order to validate the protein product of ACOX2-i9,
cDNAs encoding ACOX2 and ACOX2-i9 were engineered into expression vectors, both expressed in a cell
free translation system and transfected into HeLa cells.
Cells transfected with the full length ACOX2 showed a
distinct band at 75 kDa, whereas expression of ACOX2-i9
gave rise to a double band at ~35 kDa, and when taking
into account the presence of the 4 kDA tag, is consistent
with the endogenous short form ACOX2 protein detected
previously in the cell lines (Additional file 1: Figure S3A
and B). The specificity of this 35 kDa protein was confirmed by successful knock down by introduction of an
siRNA targeted to the C-terminal of ACOX2 (Additional
file 1: Figure S3C).
shRNA constructs targeting the N- and C-terminal
regions of ACOX2 were introduced to HepG2 cells to
confirm that the lower molecular weight band was indeed
an endogenous ACOX2 isoform (Fig. 2d). Cells expressing
shRNA targeting the N-terminal end of ACOX2 showed
reduced expression of the 75 kDa band. As expected,
targeting the C-terminal end of ACOX2 both reduced
the expression of the 75 kDa band, and eliminated the
expression of the lower molecular weight bands. This
shows that the low molecular weight band does indeed
contain the C-terminal part of the ACOX2 transcript,
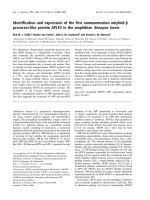
Fig. 2 Expression of ACOX2 in breast cancer cell lines. ACOX2 and ACOX2-i9 mRNA levels were assessed by qRT-PCR in HepG2 cells and breast
cancer cell lines (a), quantification is shown relative to HepG2 expression. Protein extracts from HepG2 and breast cancer cell lines were probed
with a C-terminal antibody against ACOX2 (b). Highly sensitive chemiluminescent substrate (c) was included for illustration purposes to show
even low levels of protein expression. HepG2 cells were transfected with shRNA targeting the N-terminal and C-terminal regions of ACOX2 (d)
Bjørklund et al. BMC Cancer (2015) 15:524
and targeting this region significantly reduces the expression of the variant.
Estrogen regulation of ACOX2-i9 in the T47D cell line
Data from chromatin immunoprecipitation sequencing
(ChIP-seq) experiments of T47D cells showed an Estrogen
Receptor binding peak in exon 10 of ACOX2 in the presence of Estradiol [17], and several consensus binding-sites
for ESR1 were found in the sequence preceding exon 10
and within exon 10 itself (Additional file 1: Figure S4A).
To determine whether ACOX2-i9 protein expression is
regulated by estrogens in-vitro, T47D cells were grown in
estrogen depleted media (see Methods) for 72 h and protein extracts were probed with the ACOX2 C-terminal
antibody. We found that expression of ACOX2-i9 was significantly down regulated (virtually abolished) in the absence of estrogen (Fig. 3a), The effect of treatment with
several selective estrogen receptor modulators (SERMS)
was then investigated. Treatment with the ER agonist/antagonist 4-OHT (tamoxifen) inhibited the expression of
ACOX2-i9, an effect also observed when treating the cells
with the selective estrogen receptor antagonist fulvestrant
Page 7 of 13
at 100nM, which is known to degrade ER protein expression. To determine if signaling by estrogen receptor alpha
(ESR1) was the predominant mechanism, we stimulated
T47D cells with the selective ESR1 agonist PPT. As shown
in Fig. 3b, treatment with PPT increased ACOX2-i9 expression in T47D cells in a dose-dependent fashion. Similar
effects on ACOX2-i9 expression were seen after estrogen
depletion and tamoxifen treatments in the Mcf-7 cell line,
but here the effect of fulvestrant was not prominent (Supplementary Figure S4B). PPT treatment also led to increased ACOX2-i9 expression.
To further demonstrate if the effect of these agents were
indeed mediated through ESR1, the ESR1-negative MDAMB-436 cells which express ACOX2-i9, were similarly
treated. Here tamoxifen, fulvesterant, estrogen depletion,
and PPT treatment led to no change in ACOX2-i9 expression, suggesting that in this cell line ACOX2-i9 is regulated in an estrogen-independent fashion (Fig. 3c and d).
Interestingly, in HepG2 cells, which express ESR1 [18]
we could also observe decreased ACOX2-i9 expression
upon treatment with tamoxifen (Fig. 3e), but these cells
did not show reduced ACOX2-i9 expression in response
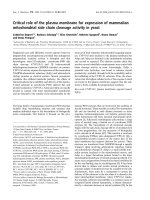
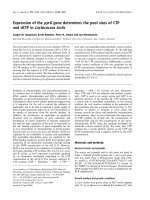
Fig. 3 Estrogen regulation of ACOX2-i9 in cell lines. Western blot analysis was performed on whole cell lysates from T47D cells either depleted of
estradiol for 72 h, treated with 4-OHT for 48 h, or treated with fulvestrant for 48 h (a), or treated with increasing doses of PPT for 48 h (b). MDA-MB 436
cells were either depleted of estradiol for 72 h, treated with 4-OHT for 48 h, or treated with fulvestrant for 48 h (c), or treated with PPT for 48 h
(d), HepG2 cells were treated with 4-OHT for 48 h (e) (see Methods for details). Blots were probed with the C-terminal ACOX2 and Tubulin antibodies
Bjørklund et al. BMC Cancer (2015) 15:524
to estrogen depletion (data not shown). Together these
data indicate that the expression of ACOX2-i9 is effected
by ESR1 stimulation and inhibition in breast cancer cell
lines.
Effect of ACOX2-i9 knock down on colony formation
ACOX2-i9 was found to be present in human breast
cancer, but at low to zero levels in normal breast tissue
samples. In order to investigate whether the presence of
ACOX2-i9 gives a growth advantage to cells expressing
the protein, short hairpin RNAs were stably introduced
Page 8 of 13
into T47D and MDA-MB 436 cell lines. Four different
shRNA constructs were used, two complementary to the
N-terminal region, (N and N’), targeting the full-length
transcript of ACOX2, and two against the C-terminal,
targeting both the full length and the short ACOX2-i9
transcripts (C and C’). A colony formation assay was
carried out to assess whether knocking down ACOX2-i9
would affect the growth of T47D cells. Knockdown targeting the far C-terminal had a great effect on colony
formation, reducing growth by 70 % and 50 % for C and
C’ respectively (Fig. 4a, b, c, and d). The N-terminal
Fig. 4 ACOX2-i9 knockdown reduces growth of T47D and MDA-MB 436 cells. Colony formation assay of T47D cells stably expressing shRNA targeting full
length ACOX2 (shRNA N and N’), full length and ACOX2-i9 transcripts (shRNA C and C’), or empty vector (control) (a and b). Colony formation assay of
MDA-MB 436 cells (g) using the N’, C’, and control constructs. Cells were methanol fixed and stained with Chrystal Violet. Colonies were counted
manually (c, d, and h). Bars are average of three experiments performed in triplicates (+/− SE), *p < 0.05 as assed by two-sided t-test. Knockdown was
assessed by Western blotting (e, f, and i)
Bjørklund et al. BMC Cancer (2015) 15:524
shRNA construct (N) caused a slight but not significant
reduction in colony formation while a second N-terminal
construct reduced growth by approximately 35 % (N’). In
MDA-MB 436 cells knockdown of both ACOX2 isoforms
(C’) had a dramatic effect on colony formation, reducing
growth by ~90 % (Fig. 4g and h). Knockdown of canonical
ACOX2 (N’) did not cause a significant reduction in colonies. Knockdown was assessed by Western Blotting
(Fig. 4e, f, and i). Although knockdown of canonical
ACOX2 was not detectable at the protein level, both cell
lines express mRNA transcripts detectable by qRT-PCR,
and the slight effect on growth could be due to knockdown of ACOX2. The results suggest in ER+ and ER- cell
lines that express ACOX2-i9, it is expressed as a functional protein involved in growth/proliferation of these
cells in vitro.
ACOX2-i9 expression is associated with better outcome in
ER+ breast cancer
The clinical/biological relevance of this variant transcript
of ACOX2 was further studied in an independent set of
113 breast tumor samples from patients from the well
characterized MicMa cohort [14] for which long-term
clinical follow up data were available. The variant transcript was first characterized by Sanger sequencing of a
subset of the patient samples (n = 26), confirming that it
includes a ~70 bp intronic sequence from intron 9 (data
not shown). Following this, conventional RT-PCR was performed on RNA isolated from all 113 patient samples.
Kaplan-Meier survival analysis for relapse free survival
was performed on the patient cohort and ACOX2-i9
was a statistically significant predictor of outcome in this
dataset, where presence of the variant transcript was associated with better outcome (p = 0.04) (Fig. 5a). Interestingly, this difference was strongly confined to the ER
positive tumors, representing the subgroups that typically have a better prognosis than patients with ER negative tumors (p = 0.02) (Fig. 5b). Survival analysis of the
ER negative patients showed that ACOX2-i9 had no effect on outcome (Fig. 5c). Further analysis showed that
ACOX2-i9 expression associates with lower grade and
p53 WT tumors, also within the ER+ patient group
(Fisher exact test) (Tables 1 and 2). This is consistent
with ACOX2-i9 expression in ER+ cancers being associated with luminal A breast cancer subtype.
Discussion
In this study we have shown that a variant (shorter)
transcript of ACOX2, identified by RNA sequencing,
translates into a protein detectable in several breast cancer cell lines, as well as the HCC cell line, HepG2. When
the ACOX2-i9 transcript was expressed in HeLa cells
the protein lysate probed with the C-terminal ACOX2
antibody gave rise to two bands at ~35 kDa. In Vitro
Page 9 of 13
translation of the same construct in a cell free system
also resulted in two bands of this size, indicating that
the transcript might harbor more than one transcription
start site. The size of the bands at ~35 kDa including a
4 kDa molecular tag is slightly higher than that of the
endogenous ~25 kDa bands observed in the cell lines.
The translational start site could be located downstream
of the 5’ transcript sequence observed by RNA sequencing,
or the endogenous protein could be subject to posttranslational modifications. Nonetheless, the 25 kDa protein present in the cell lines was detected by an ACOX2
antibody that recognizes the far C-terminal part of the
protein, and is very likely to include the Acyl-CoA oxidase
domain and the Peroxisomal Targeting Signal. Previously
we, and others [19] have shown that this variant is virtually absent in normal breast tissue samples. In 2010 Hodo
et al. showed the presence of an intronic start variant of
ACOX2 in HCC [12] which is likely to be the same as
ACOX2-i9. They reported that the expression of the intronic variant is associated with moderately differentiated
tumors, and could be involved in HCC tumor progression.
We identified ACOX2-i9 as a transcript expressed at
higher levels in ER+ than in ER- breast carcinoma patients. The sequence preceding the intronic start site
contains several ESR1 canonical binding sites, and an
ESR1 peak was observed in exon 10 of ACOX2 in a
ChIP-seq analysis in T47D cells as reported by Joseph et
al. [17]. We observed reduced expression of ACOX2-i9
both upon depleting the cells of estrogen, and by treating the cells with the known ER agonist/antagonist tamoxifen and the selective estrogen receptor antagonist
fulvestrant, as well as induction of ACOX2-i9 protein
when treated with ESR1 agonist PPT. These interventions
did not affect ACOX2-i9 levels in an ER- breast cancer cell
line that did express ACOX2-i9, confirming that the effects of these agents in ER+ cells is likely mediated
through ESR1.
Although ACOX2-i9 showed overall higher expression
in ER+ patients it is clearly expressed in a subset of ERpatients, and in ER- cell lines as shown above. Regulation of ACOX2-i9 appears to be estrogen-independent
in ER- cell lines. Transcription factors such as Jun, Fos,
and SP-1 have been shown to bind in the region preceding exon 10 of ACOX2 (ENCODE), and are possible regulators of expression in the ER- cell line, but the exact
mechanism is not clear at this point. Interestingly the
HCC cell line HepG2, which also express ESR1, also
responded to tamoxifen by down-regulating ACOX2-i9
expression. Even though ACOX2-i9 expression in these
cells is regulated by tamoxifen, canonical ACOX2 is not,
a clear example of separate transcripts from the same
gene locus being under individual control.
ACOX2-i9 consists of ~300 amino acids in the Cterminal region of the canonical ACOX2. This isoform
Bjørklund et al. BMC Cancer (2015) 15:524
Page 10 of 13
Fig. 5 ACOX2-i9 expression is associated with good prognosis in a cohort of breast cancer patients. Kaplan-Meier survival curves of patients from the
MicMa cohort testing positive (n = 44) or negative (n = 62) for ACOX2-i9 by PCR assay (a). b and c show survival curves for ER positive (ACOX2-i9pos
n = 33, ACOX2-i9neg n = 42) and ER negative patients (ACOX2-i9pos n = 11, ACOX2-i9neg n = 20) respectively
contains the Acyl-CoA oxidase domain, but lacks the FAD
binding domain. To determine whether the ACOX2-i9
isoform is functional we knocked down its expression
using shRNA constructs in T47D and MDA-MB 436 cells.
Knocking down the canonical ACOX2 had a modest effect
on both T47D and MDA-MB 436 cells. Knockdown targeting the C-terminal region dramatically reduced colony
formation in both cell lines, indicating that ACOX2-i9,
when expressed, is involved in growth/proliferation in
both ER+ and ER- cells in-vitro.
Table 1 ACOX2-i9 association to clinical parameters in a cohort of 113 breast cancer patients
A
Tumor grade
ER
PR
TP53
N
1
2
3
Pos
Neg
Pos
Neg
WT
Mut
ACOX2-i9 pos
43
60 %
51 %
25 %
43 %
35 %
46 %
30 %
49 %
27.5 %
ACOX2-i9 neg
62
40 %
49 %
75 %
57 %
65 %
54 %
70 %
51 %
72.5 %
p value
0.015
0.52
0.14
0.04
ACOX2-i9 was detected (pos) or not detected (neg) by PCR assay and correlated with tumor grade, estrogen receptor (ER), progesterone receptor (PR), or TP53
mutational status. A Fisher exact test was used to determine P values for the likelihood of association
Bjørklund et al. BMC Cancer (2015) 15:524
Page 11 of 13
Table 2 ACOX2-i9 association to clinical parameters within the
ER+ patient group
B
ER positive
Tumor grade
PR
TP53
N
1
2
3
Pos
Neg
WT
Mut
ACOX2-i9 pos
33
60 %
51 %
20 %
47 %
11 %
51 %
21 %
ACOX2-i9 neg
43
40 %
49 %
80 %
53 %
89 %
49 %
79 %
p value
0.015
0.07
0.03
We verified the expression of ACOX2-i9 in the TCGA
breast cancer cohort and in an independent group of
breast cancer patients with long term follow up. Interestingly, in the patients positive for ACOX2-i9, the expression of the variant was highly confined to the tumor, and
low or not present in the adjacent normal sample. The
full length ACOX2 transcript was expressed at higher
levels in the majority of the normal samples. Expression
levels of each exon in the ACOX2 locus showed that the
last 5 exons (ACOX2-i9) were higher in ER+/Her2compared to ER-/Her2- patients in the TCGA cohort,
and in the ER-/Her2+ patient group compared to ER-/
Her2- patients. In the patients with long term follow up
ACOX2-i9 expression was assayed by conventional PCR,
and the ratio to the full-length transcript could not be
determined.
Detection of the variant by this method was associated
with good prognosis in the patient cohort as a whole.
The prognostic association with ACOX2-i9 expression
was limited to ER+ cancers, with no such association
seen in ER- cancers. As most ER+ cancers in this cohort
were treated with hormonal therapy, it is possible that
ACOX2-i9 expression may be associated with sensitivity
to this treatment. Alternatively, ACOX2-i9 expression
may mark a set of better prognosis ER+ cancers (ie luminal A breast cancers) regardless of hormonal therapy.
ACOX2-i9 knockdown resulted in less growth/proliferation of cell lines as shown here by colony formation
assays, suggesting the ACOX2-i9 expression is required
for optimal growth. These findings raise the possibility
that ACOX2-i9 may both be a prognostic marker and a
potential therapeutic target. Although it may seem contradictory at first that a gene positively involved in tumor
growth can be associated with improved outcome, there
are several examples of this in the literature and clinic. In
a heterogenous set of cancers, such as breast cancer, with
many subclasses, a gene may both be a potent growth
driver and mark a class of tumors that do relatively better.
A relevant example is high ESR1 expression, which is associated with good prognosis in breast cancer (and marks
the Luminal A subclass), but is required for growth and is
an excellent therapeutic target [20–24]. Within ER+ breast
cancer higher expression of ESR1 is also associated with
good prognosis [25, 26]. As ACOX2-i9 is estrogen regulated in ER+ cancer cells, it is not surprising that high
levels may be associated with estrogen-responsiveness and
good prognosis in the ER+ patient group. However as
even “good prognosis” subset of ER+ cancers have a significant recurrence rate with standard hormonal therapy,
there is a clear need to find other novel potential therapeutic targets in these cancers.
The secondary bile acid Chenodeoxycholic acid (CDCA),
the end product of the bile acid pathway in which ACOX2
functions, has been shown to stimulate proliferation in
ER+ cells [27], and may contribute to the effects seen
of ACOX2 on proliferation. The cholesterol metabolite,
27-hydroxycholesterol, was recently shown to increase
ER-dependent growth in breast cancer cell lines and
mouse models [28]. High expression of the enzyme that
catalyzes the conversion of cholesterol to 27HC, CYP27A1,
is associated with higher tumor grade in breast cancers,
and high expression of CYP7B1, the enzyme downstream
of CYP27A1 is associated with better outcome in ER+
breast cancer patients. ACOX2-i9, which we show is associated with better outcome in ER+ patients, could be
involved in the downstream catabolism of 27HC. The
interplay between these two pathways can possibly shed
light on the opposing roles of ACOX2 in tumorigenesis.
Of note, tamoxifen treatment specifically reduced expression of the ACOX2-i9 variant in HepG2 hepatic cells,
while having no effect on the full length ACOX2. As tamoxifen is known to induce fatty liver [29], this observation
raises the possibility that tamoxifen induced regulation of
the ACOX2 variant may affect fatty acid metabolism in
the liver. Estrogen-regulation of fatty acid metabolism has
been observed in several clinical settings [30–32], and it is
possible that estrogen regulation of ACOX2 variant transcripts could contribute to this process.
Future investigation is necessary to determine whether
the substrate specificity of ACOX2-i9 is different from
that of canonical ACOX2. As this variant transcript is
represented in all the clinical breast cancer subgroups,
and mainly confined to the tumor, ACOX2-i9 could be a
possible independent target for therapy.
Conclusions
In this study we show that the alternate start transcript
translates into a 25 kDa protein and is present in several
breast cancer cell lines, as well as the HCC cell line
HepG2. The expression of this ACOX2 isoform is positively regulated by PPT, and down regulated by the ER
agonist/antagonist tamoxifen and fulvestrant. Knockdown
of ACOX2-i9 leads to impaired cell growth of both T47D
and MDA-MB 436 cells. These data suggest that ACOX2i9 is required for optimal growth of ER+ breast cancer and
may be a novel therapeutic target.
Bjørklund et al. BMC Cancer (2015) 15:524
Additional file
Additional file 1: Figures S1-S3 are supplied in Additional_File_1.pdf
and includes figures showing Visualization of RNA sequencing reads
in the ACOX2 locus (S1), additional figures supplementing Figure 1,
showing expression of ACOX2-i9 in tumor/normal pairs in the
TCGA data (S2). S3 supplements Figure 3, showing additional cloning,
expression and knockdown of the ACOX2-i9 protein in cell lines. Additional
agonist/antagonist treatment results from the Mcf-7 cell line are shown
in S4.
Abbreviations
ACOX2: Acyl-CoA oxidase 2; RNA-seq: Ribonucleic acid-sequencing;
ER: Estrogen Receptor; TCGA: The Cancer Genome Atlas; BRCA: Breast cancer
dataset (from TCGA); qRT-PCR: Quantitative reverse transcriptase-polymerase
chain reaction; shRNA: short hairpin-RNA; FAO: Fatty acid oxidation;
HCC: Hepatocellular carcinoma; E2: 17-β-Estradiol; 4-OHT: 4-Hydroxytamoxifen;
RPKM: Reads per kilobase of transcript per million reads mapped; FAD: Flavin
adenine dinucleotide; ChIP-seq: Chromatin immunoprecipitation sequencing;
VLCFA: Very long chain fatty acids; BCFA: Branched chain fatty acids; PPT: Propyl
pyrazoletriol; CDCA: Chenodeoxycholic acid; SERM: Selective estrogen receptor
modulator.
Page 12 of 13
2.
3.
4.
5.
6.
7.
8.
9.
Competing interests
The authors declare that they have no competing interests.
Authors’ contributions
SSB carried out most of the laboratory experiments, performed statistical
analysis, participated in the design of the study and drafted the manuscript.
VNK helped draft the manuscript. MS contributed to statistical analysis and
constructed certain figures. SK performed RNA-seq analysis. GIGA and YM
conducted laboratory experiments. JK contributed the protein model. BN
was in charge of collecting the patient samples for the MicMa cohort, and
was crucial to analysis and interpretation of the clinical data. GB performed
analysis on the TCGA data. RS contributed to data analysis and study design.
SG, GB, ALBD, and VNK conceived of the study and contributed to the
writing of the manuscript. SG coordinated and participated in the design of
the study. All authors read and approved the final manuscript.
Acknowledgements
This work was supported by grants from The Norwegian Cancer Society to
ALBD and VNK (grant numbers 4196283563 and 4196163832), South-Eastern
Norway Regional Health Authority (grant numbers 2011042, 2789119, and
2012043. SG receives support from the NCI, the DOD and the Century for
the Cure. SB is a fellow of South-Eastern Norway Regional Health Authority
under grant number 2012043. VNK was a visiting fellow from Radiumhospitalets
legater.
Author details
1
Department of Genetics, Institute for Cancer Research, Oslo University
Hospital Radiumospitalet, Montebello, 0310 Oslo, Norway. 2Rutgers Cancer
Institute of New Jersey, 195 Little Albany Street, New Brunswick, NJ, 08903,
USA. 3Department of Molecular Biology & Biochemistry, Rutgers University,
Piscataway, NJ, 08854, USA. 4Department of Oncological Sciences, Mount
Sinai School of Medicine, New York, NY, 10029, USA. 5The K.G. Jebsen Center
for Breast Cancer Research, Institute for Clinical Medicine, Faculty of
Medicine, University of Oslo, Oslo, Norway. 6Department of Clinical Molecular
Biology and Laboratory Science (EpiGen), Akershus University hospital,
Division of Medicine, 1476, Lørenskog, Norway. 7Center for Advanced
Genomic Technology, Boston University, Boston, MA 02215, USA. 8Department
of Oncology, Oslo University Hospital, Radiumhospitalet, Oslo, Norway.
10.
11.
12.
13.
14.
15.
16.
17.
18.
19.
20.
21.
Received: 26 March 2015 Accepted: 19 June 2015
22.
References
1. Perou CM, Sorlie T, Eisen MB, van de Rijn M, Jeffrey SS, Rees CA, et al.
Molecular portraits of human breast tumours. Nature. 2000;406(6797):747–52.
doi:10.1038/35021093.
23.
24.
Sorlie T, Perou CM, Tibshirani R, Aas T, Geisler S, Johnsen H, et al. Gene
expression patterns of breast carcinomas distinguish tumor subclasses with
clinical implications. Proc Natl Acad Sci U S A. 2001;98(19):10869–74.
doi:10.1073/pnas.191367098.
Alexe G, Dalgin GS, Scanfeld D, Tamayo P, Mesirov JP, DeLisi C, et al. High
expression of lymphocyte-associated genes in node-negative HER2+ breast
cancers correlates with lower recurrence rates. Cancer Res. 2007;67(22):10669–76.
doi:10.1158/0008-5472.CAN-07-0539.
Curtis C, Shah SP, Chin SF, Turashvili G, Rueda OM, Dunning MJ, et al. The
genomic and transcriptomic architecture of 2,000 breast tumours reveals
novel subgroups. Nature. 2012;486(7403):346–52. doi:10.1038/
nature10983.
Wang ET, Sandberg R, Luo S, Khrebtukova I, Zhang L, Mayr C, et al.
Alternative isoform regulation in human tissue transcriptomes. Nature.
2008;456(7221):470–6. doi:10.1038/nature07509.
David CJ, Manley JL. Alternative pre-mRNA splicing regulation in cancer:
pathways and programs unhinged. Genes Dev. 2010;24(21):2343–64.
doi:10.1101/gad.1973010.
Bui T, Thompson CB. Cancer’s sweet tooth. Cancer Cell. 2006;9(6):419–20.
doi:10.1016/j.ccr.2006.05.012.
Hatzivassiliou G, Zhao F, Bauer DE, Andreadis C, Shaw AN, Dhanak D, et al.
ATP citrate lyase inhibition can suppress tumor cell growth. Cancer Cell.
2005;8(4):311–21. doi:10.1016/j.ccr.2005.09.008.
Schafer ZT, Grassian AR, Song L, Jiang Z, Gerhart-Hines Z, Irie HY, et al.
Antioxidant and oncogene rescue of metabolic defects caused by loss of
matrix attachment. Nature. 2009;461(7260):109–13. doi:10.1038/nature08268.
Carracedo A, Weiss D, Leliaert AK, Bhasin M, de Boer VC, Laurent G, et al. A
metabolic prosurvival role for PML in breast cancer. J Clin Invest.
2012;122(9):3088–100. doi:10.1172/JCI62129.
Baumgart E, Vanhooren JC, Fransen M, Van Veldhoven PP, Mannaerts GP.
Mammalian peroxisomal acyl-CoA oxidases. II. Molecular characterization of
rat trihydroxycoprostanoyl-CoA oxidase. Ann N Y Acad Sci. 1996;804:676–7.
Hodo Y, Hashimoto S, Honda M, Yamashita T, Suzuki Y, Sugano S, et al.
Comprehensive gene expression analysis of 5’-end of mRNA identified
novel intronic transcripts associated with hepatocellular carcinoma.
Genomics. 2010;95(4):217–23. doi:10.1016/j.ygeno.2010.01.004.
Pfaffl MW. A new mathematical model for relative quantification in real-time
RT-PCR. Nucleic Acids Res. 2001;29(9), e45.
Naume B, Zhao X, Synnestvedt M, Borgen E, Russnes HG, Lingjaerde OC, et
al. Presence of bone marrow micrometastasis is associated with different
recurrence risk within molecular subtypes of breast cancer. Mol Oncol.
2007;1(2):160–71. doi:10.1016/j.molonc.2007.03.004.
Tokuoka K, Nakajima Y, Hirotsu K, Miyahara I, Nishina Y, Shiga K, et al. Threedimensional structure of rat-liver acyl-CoA oxidase in complex with a fatty
acid: insights into substrate-recognition and reactivity toward molecular
oxygen. J Biochem. 2006;139(4):789–95. doi:10.1093/jb/mvj088.
Network CGA. Comprehensive molecular portraits of human breast
tumours. Nature. 2012;490(7418):61–70. doi:10.1038/nature11412.
Joseph R, Orlov YL, Huss M, Sun W, Kong SL, Ukil L, et al. Integrative model
of genomic factors for determining binding site selection by estrogen
receptor-α. Mol Syst Biol. 2010;6:456. doi:10.1038/msb.2010.109.
Liu WH, Yeh SH, Lu CC, Yu SL, Chen HY, Lin CY, et al. MicroRNA-18a prevents
estrogen receptor-alpha expression, promoting proliferation of hepatocellular
carcinoma cells. Gastroenterology. 2009;136(2):683–93. doi:10.1053/
j.gastro.2008.10.029.
André F, Michiels S, Dessen P, Scott V, Suciu V, Uzan C, et al. Exonic
expression profiling of breast cancer and benign lesions: a retrospective
analysis. Lancet Oncol. 2009;10(4):381–90. doi:10.1016/S1470-2045(09)70024-5.
Parl FF, Schmidt BP, Dupont WD, Wagner RK. Prognostic significance of
estrogen receptor status in breast cancer in relation to tumor stage, axillary
node metastasis, and histopathologic grading. Cancer. 1984;54(10):2237–42.
Crowe JP, Gordon NH, Hubay CA, Shenk RR, Zollinger RM, Brumberg DJ, et
al. Estrogen receptor determination and long term survival of patients with
carcinoma of the breast. Surg Gynecol Obstet. 1991;173(4):273–8.
Aaltomaa S, Lipponen P, Eskelinen M, Kosma VM, Marin S, Alhava E, et al.
Hormone receptors as prognostic factors in female breast cancer. Ann Med.
1991;23(6):643–8.
Jordan VC, Koerner S. Tamoxifen (ICI 46,474) and the human carcinoma 8S
oestrogen receptor. Eur J Cancer. 1975;11(3):205–6.
Effects of adjuvant tamoxifen and of cytotoxic therapy on mortality in early
breast cancer. An overview of 61 randomized trials among 28,896 women.
Bjørklund et al. BMC Cancer (2015) 15:524
25.
26.
27.
28.
29.
30.
31.
32.
Page 13 of 13
Early Breast Cancer Trialists’ Collaborative Group. N Engl J Med.
1988;319(26):1681–92. doi:10.1056/NEJM198812293192601.
Paik S, Shak S, Tang G, Kim C, Baker J, Cronin M, et al. A multigene assay to
predict recurrence of tamoxifen-treated, node-negative breast cancer.
N Engl J Med. 2004;351(27):2817–26. doi:10.1056/NEJMoa041588.
Dowsett M, Allred C, Knox J, Quinn E, Salter J, Wale C, et al. Relationship
between quantitative estrogen and progesterone receptor expression and
human epidermal growth factor receptor 2 (HER-2) status with recurrence
in the Arimidex, Tamoxifen, Alone or in Combination trial. J Clin Oncol.
2008;26(7):1059–65. doi:10.1200/JCO.2007.12.9437.
Journe F, Durbecq V, Chaboteaux C, Rouas G, Laurent G, Nonclercq D, et al.
Association between farnesoid X receptor expression and cell proliferation
in estrogen receptor-positive luminal-like breast cancer from postmenopausal
patients. Breast Cancer Res Treat. 2009;115(3):523–35. doi:10.1007/s10549-0080094-2.
Nelson ER, Wardell SE, Jasper JS, Park S, Suchindran S, Howe MK, et al.
27-Hydroxycholesterol links hypercholesterolemia and breast cancer
pathophysiology. Science. 2013;342(6162):1094–8. doi:10.1126/science.1241908.
Liu CL, Huang JK, Cheng SP, Chang YC, Lee JJ, Liu TP. Fatty liver and
transaminase changes with adjuvant tamoxifen therapy. Anticancer Drugs.
2006;17(6):709–13. doi:10.1097/01.cad.0000215056.47695.92.
Mauvais-Jarvis F. Estrogen and androgen receptors: regulators of fuel
homeostasis and emerging targets for diabetes and obesity. Trends
Endocrinol Metab. 2011;22(1):24–33. doi:10.1016/j.tem.2010.10.002.
D’Eon TM, Souza SC, Aronovitz M, Obin MS, Fried SK, Greenberg AS.
Estrogen regulation of adiposity and fuel partitioning. Evidence of genomic
and non-genomic regulation of lipogenic and oxidative pathways. J Biol
Chem. 2005;280(43):35983–91. doi:10.1074/jbc.M507339200.
Zhu L, Brown WC, Cai Q, Krust A, Chambon P, McGuinness OP, et al.
Estrogen treatment after ovariectomy protects against fatty liver and may
improve pathway-selective insulin resistance. Diabetes. 2013;62(2):424–34.
doi:10.2337/db11-1718.
Submit your next manuscript to BioMed Central
and take full advantage of:
• Convenient online submission
• Thorough peer review
• No space constraints or color figure charges
• Immediate publication on acceptance
• Inclusion in PubMed, CAS, Scopus and Google Scholar
• Research which is freely available for redistribution
Submit your manuscript at
www.biomedcentral.com/submit