Texture analysis on MR images helps predicting non-response to NAC in breast cancer
Bạn đang xem bản rút gọn của tài liệu. Xem và tải ngay bản đầy đủ của tài liệu tại đây (2.47 MB, 13 trang )
Michoux et al. BMC Cancer (2015) 15:574
DOI 10.1186/s12885-015-1563-8
RESEARCH ARTICLE
Open Access
Texture analysis on MR images helps
predicting non-response to NAC in breast cancer
N. Michoux1*, S. Van den Broeck2, L. Lacoste2, L. Fellah2, C. Galant3, M. Berlière4 and I. Leconte2
Abstract
Background: To assess the performance of a predictive model of non-response to neoadjuvant chemotherapy
(NAC) in patients with breast cancer based on texture, kinetic, and BI-RADS parameters measured from
dynamic MRI.
Methods: Sixty-nine patients with invasive ductal carcinoma of the breast who underwent pre-treatment MRI
were studied. Morphological parameters and biological markers were measured. Pathological complete
response was defined as the absence of invasive and in situ cancer in breast and nodes. Pathological non-responders,
partial and complete responders were identified. Dynamic imaging was performed at 1.5 T with a 3D axial T1W GRE
fat-suppressed sequence. Visual texture, kinetic and BI-RADS parameters were measured in each lesion. ROC analysis
and leave-one-out cross-validation were used to assess the performance of individual parameters, then the
performance of multi-parametric models in predicting non-response to NAC.
Results: A model based on four pre-NAC parameters (inverse difference moment, GLN, LRHGE, wash-in) and k-means
clustering as statistical classifier identified non-responders with 84 % sensitivity. BI-RADS mass/non-mass enhancement,
biological markers and histological grade did not contribute significantly to the prediction.
Conclusion: Pre-NAC texture and kinetic parameters help predicting non-benefit to NAC. Further testing including
larger groups of patients with different tumor subtypes is needed to improve the generalization properties and validate
the performance of the predictive model.
Keywords: Breast cancer, Neoadjuvant chemotherapy, MRI, Texture analysis
Background
Neoadjuvant chemotherapy (NAC) has a major role in
the treatment of breast cancer [1, 2]. Several trials comparing adjuvant chemotherapy and NAC demonstrated
that long-term relapse-free and overall survival outcomes were the same [3]. However, NAC has advantages
compared with adjuvant chemotherapy. NAC can safely
downstage tumor so that conservative surgery can be
performed instead of mastectomy [4, 5]. Importantly,
NAC is the only way to study the effect of systemic
chemotherapy in vivo and to identify prognostic factors.
However, the rate of response to NAC is limited and
dependent on the subtypes of cancer [6–12]. It has been
recently reported that pathological complete response
* Correspondence:
1
Radiology Department, IREC (Institute of Experimental and Clinical Research) IMAG, Université Catholique de Louvain, Cliniques Universitaires Saint-Luc,
Avenue Hippocrate 10, Brussels B1200, Belgium
Full list of author information is available at the end of the article
(pCR) obtained after NAC is a suitable surrogate endpoint
for disease-free survival in patients with luminal B/Human
Epidermal growth factor Receptor 2 (HER2) -negative,
HER2-positive (non-luminal) and triple negative tumors
but not for those with luminal B/HER2-positive or luminal
A tumors. However, the rate of pCR in these different
breast cancer subtypes varies from 6 to 33 % [13]. Therefore, the identification of non-responding patients is important, especially as it may allow considering alternative
therapeutic options.
The predictive value of Magnetic Resonance Imaging
(MRI) and in particular of diffusion-weighted MRI [14–16],
MR spectroscopy [17–19] or Dynamic Contrast-Enhanced
MRI (DCE-MRI) [20–23] has been investigated. However,
most of these studies were performed after the first courses
of NAC. Some studies reported that certain pre-NAC
semi-quantitative DCE parameters were significantly different in chemosensitive and chemoresistant breast lesions
© 2015 Michoux et al. This is an Open Access article distributed under the terms of the Creative Commons Attribution License
( which permits unrestricted use, distribution, and reproduction in any medium,
provided the original work is properly credited. The Creative Commons Public Domain Dedication waiver (http://
creativecommons.org/publicdomain/zero/1.0/) applies to the data made available in this article, unless otherwise stated.
Michoux et al. BMC Cancer (2015) 15:574
and may contribute to the prediction of disease-free survival and overall survival [24–26].
Alternative quantitative approaches such as visual
texture analysis have been considered [27, 28]. Texture
analysis allows for the description of the MR appearance
of the tissues and of their changes in terms of fineness,
coarseness, smoothness, granularity, homogeneity or
periodicity [29]. These attributes are related to the local
spatial distribution of the grey levels in the image matrix
and can be captured by using metrics, called texture parameters. In texture analysis of MR images, it is assumed
that the distribution of the grey levels results from the
underlying ultrastructural properties of tissues affected
by the disease processes-an assumption that has been
validated by finding correlation between MRI texture
patterns and tissue changes on histological analysis [30].
Numerically, texture can be described by using nth-order
statistics, spatial frequency or structural primitives, the
first two approaches being the most commonly used. A
practical description of the concepts and methodologies
for texture analysis of MR images has been proposed
by Hajek et al. [31]. First studies in breast MRI, while
remaining to be validated, showed that certain pretreatment texture parameters (based on high order statistics) may help evaluate breast tumor response to
NAC [32–34].
The aim of the study is to assess the value of preNAC imaging parameters to predict non-responders to
NAC. To this purpose, texture, kinetic and BI-RADS
(Breast Imaging-Reporting and Data System) parameters were studied from baseline MRI. Thence, a three-step
assessment was undertaken. First, texture parameters
were compared in healthy breast tissues and in tumor
lesions. Secondly, the performance of individual parameters in predicting pathological non-response to NAC
was assessed. Thirdly, parameters were combined into
multi-parametric models. The predictive performance of
these multi-parametric models was then assessed after
cross-validation.
Page 2 of 13
invasive cancers received NAC. The percentage of in situ
(DCIS and LCIS) was comprised between 17 to 21 %.
A baseline MRI as well as a pre-operative MRI to
evaluate response to NAC was performed in all patients.
After multidisciplinary breast cancer tumor board decision, all patients underwent NAC, consisting of 4 cycles
of cyclophosphamide/anthracyclines followed by 4 cycles
of taxanes [2, 3] and trastuzumab in case of HER2+
tumor. Cycles were administrated every 3 weeks. All
patients had surgery three to four weeks after completing
NAC. As a result, the delay between diagnosis and surgery
was approximately 6 months.
Patients with incomplete pathological and radiological
data (n = 6) and severe artifacts on MRI images (e.g.
respiratory motion and body movement) (n = 3) were
excluded. Overall, this retrospective study included 69
patients with IDC (median age 54 years, range 22–72
years). Estrogen receptor (ER), progesterone receptor
(PgR) and, HER2 status as well as the mitotic factor
Ki67 were available on percutaneous biopsies. Patients’
characteristics are listed in Table 1.
Pathological and biological analysis
Breast tissues sampled for histopathological analysis
were sectioned at the macroscopic level transversally in
Table 1 Patients characteristics (n = 69). Number and
proportions within the whole population are given
Characteristics
Median age (range)
Values
54 (22–72)
BI-RADS feature
Mass
39 (57 %)
non mass
30 (43 %)
Histological grade
IDC 1
0
IDC 2
25 (36 %)
IDC 3
44 (64 %)
Subtypes
Methods
Luminal A
13 (19 %)
Patients
Luminal B/HER2-
25 (36 %)
This two-years retrospective study was approved by
our institutional ethical committee (Comité d’Ethique
hospitalo-facultaire, Cliniques Universitaires Saint-Luc,
Written informed consent from the patients was not required. All
patients had an invasive breast carcinoma diagnosed on
core-biopsy specimen. To obtain a homogeneous histological sample for texture analysis, only invasive ductal
carcinomas (IDC) with and without ductal carcinoma in
situ (DCIS) were included in this pilot study. The mean
number of cancers-newly diagnosed in our institution
was 296 per year. Seventeen percent of patients with
Luminal B/HER2+
15 (22 %)
Non luminal/HER2+
10 (14 %)
Triple-negative
6 (9 %)
Receptor status
ER positivity
52 (75 %)
PgR positivity
42 (61 %)
Ki67 > 14 %
52 (75 %)
HER2 positivity
26 (38 %)
Triple-negative cancer rate
6 (9 %)
IDC invasive ductal carcinoma, ER estrogen receptor, PgR progesterone
receptor, HER2 epidermal growth factor receptor 2
Michoux et al. BMC Cancer (2015) 15:574
Page 3 of 13
order to produce 10 mm slices. A dedicated breast pathologist analyzed each lesion at the microscopic level, describing first the size of every residual cancerous foci
and then classifying these into three categories according
to the NSABP 18 criteria [35]: pathological complete
(CR), partial (PR) and non-response (NR). In case of a
single mass lesion with a concentric response, the size of
the residual tumor was measured. In case of a single
masse lesion with a fragmented response, i) the overall
dimension of the foci is given when foci are adjacent, ii)
each foci is measured when foci are distant and the overall
sum is given. In case of a non-mass lesion with fragmented
response, the overall size is given.
The density of tumor cells, compared to the previous
biopsy, was also analyzed, allowing the classification of
the tumor following the grading system of Miller-Payne
(5 grades). The tumor grade was evaluated with the
Nottingham score.
A pathological complete response was defined as the
absence of invasive and in situ cancer in breast and
nodes. A partial response was defined as a decrease of
invasive cancer exceeding 30 %. A non-response was defined as a decrease of invasive cancer lower than 30 %.
At histological analysis, 14 patients were thus classified
as CR, 36 as PR and 19 as NR.
All biological markers were evaluated on percutaneous
biopsies. As regards immunohistochemical assessments,
IDCs were classified according to their receptor status. ER
and PgR were considered as negative when <10 % nuclei
stained positive [36]. For all lesions, the results for HER 2
expression by immunohistochemical analysis were scored
as 0, 1+, 2+ and 3+. Only 3+ specimens were immediately
considered as HER2-positive. A hybridization technique
was performed when analysis score was 2+. Both negative
and 1+ were considered as negative. The mitotic activity
marker Ki67 was considered as positive when expressed
by more than 14 % of tumor cells [13]. Correlation between sensitivity of breast cancer to NAC and receptor
status is given in Table 2.
MRI sequence
MRI examinations were performed using a 1.5 T whole
body imaging system (Gyroscan Intera, Philips Medical
System, The Netherlands) and a breast coil. Patients
were imaged in the prone position with T2-weighted and
diffusion-weighted imaging (DWI) (b0, b600) sequences,
and a 3D gradient echo axial T1-weighted sequence with fat
suppression (SPAIR). Scan parameters were TR/TE = 4.8/
2.4 ms, flip angle = 10°, FOV = 355 × 355 mm, matrix 320 ×
320, slice thickness 2.5 mm, voxel size 0.65 × 0.65 × 1.25 mm
Table 2 Association between pathologic responsiveness of breast cancer to NAC and receptor status
Pathologic response
NR
CR
PR
PR + CR
p-valuea
BI-RADS
Mass
12 (31 %)
27 (69 %)
0.51
non Mass
7 (23 %)
23 (77 %)
0.51
Biological markers
ER positivity
15 (29 %)
9 (17 %)
28 (54 %)
37 (71 %)
0.70
PgR positivity
14 (33 %)
4 (10 %)
24 (57 %)
28 (67 %)
0.19
Ki67 > 14 %
11 (21 %)
11 (21 %)
30 (58 %)
41 (79 %)
0.05
HER2 positivity
4 (15 %)
8 (31 %)
14 (54 %)
22 (85 %)
0.09
Luminal A
8 (62 %)
0
5 (38 %)
5 (38 %)
0.005
Luminal B/ HER2 –
4 (16 %)
5 (20 %)
16 (64 %)
21 (84 %)
0.11
Luminal B/HER2 +
3 (20 %)
4 (27 %)
8 (53 %)
12 (80 %)
0.49
Non-luminal/HER2 +
1 (10 %)
4 (40 %)
5 (50 %)
9 (90 %)
0.20
Triple-negative cancer rate
3 (50 %)
1 (17 %)
2 (33 %)
3 (50 %)
0.25
IDC 2
5 (20 %)
3 (12 %)
17 (68 %)
20 (80 %)
0.31
IDC 3
14 (32 %)
11 (25 %)
19 (43 %)
30 (68 %)
0.31
Subtypes
Histological grade
The number and proportions of NR, CR, PR and PR + CR patients with a given feature within all patients having this feature are given. The statistical significance of
the relationship between response (NR or PR + CR) and features is then assessed (p-valuea). If a p-value < 0.05 is observed for a given feature, then we can
conclude that patients’ response is associated to that feature. If a p-value > 0.05 is observed, then the null hypothesis that there is no association, cannot be
rejected. Subtype Luminal A is the only feature showing a significant association with response
BI-RADS breast imaging-reporting and data system, NR non response, CR complete response, PR partial response, ER estrogen receptor, PgR progesterone receptor,
Ki67 cellular marker for proliferation based on monoclonal antibody Ki-67, HER2 human epidermal growth factor receptor 2, HR hormone receptor, IDC invasive
ductal carcinoma
a
Significance of the association between response (NR or PR + CR) and features (Fisher’s exact test)
Michoux et al. BMC Cancer (2015) 15:574
after reconstruction. The anatomic study was followed by
a dynamic study. Patients received 0.1 mmol/kg of
gadobenate dimeglumine (Multihance, Bracco Imaging,
Germany) followed by 30 mL saline flush injected at a rate
of 2 mL/s with an automated injector. One pre- and five
post-injection images were acquired with a temporal resolution of approximately 60 s. The total acquisition time
for the protocol was about 6 min. Analyses were performed on subtracted images, i.e. the residual difference
image obtained after the second post-contrast image has
been subtracted from the pre-contrast image.
Image analysis
Magnetic resonance images in 69 patients were reviewed
consensually by a trainee and two experienced radiologists (10 and 15 years of breast MRI experience respectively) without knowledge of the pathological findings or
mammographic and sonographic data, by using the
Page 4 of 13
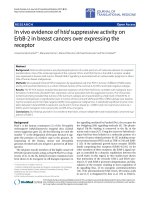
American College of Radiology BI-RADS MR lexicon
[37]. Lesions were categorized into mass enhancement
and non-mass enhancement (Fig. 1 and Table 2). The
uni- or multifocal character of the lesion was reported.
In case of multifocal lesion, only the findings of the largest lesion were recorded. The slice exhibiting the largest dimension of the lesion on the second post-contrast
image (enhancement peak) was chosen for analysis. This
criterion was applied in case of mass enhancement or
non-mass enhancement.
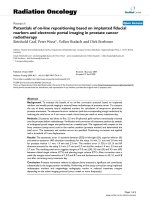
For kinetic analysis, a small region of interest (ROI)
corresponding to the most enhancing area of the lesion
was drawn (Fig. 2). The size of the ROI always included
more than nine pixels [38]. According to the BI-RADS
guidelines, characteristics of the signal intensity vs time
curve (i.e. the maximal amplitude, the wash-in and the
delayed phase pattern via the wash-out parameter) were
assessed.
Fig. 1 Axial subtracted images. According to the BI-RADS MR lexicon, the tumor is described as, a ovalar mass with spiculated margins and a
homogenous enhancement in the upper external quadrant, or b retro-areolar non mass lesion, showing a cobblestone-like pattern with nipple
invasion and skin thickening
Michoux et al. BMC Cancer (2015) 15:574
For texture analysis, a first ROI delimiting healthy tissues was drawn. Healthy tissues were delimited in a remote area of the lesion in the same breast, or in the
contralateral breast in case of very large lesions. Based on
texture differences observed between fat and healthy tissues (data not shown), healthy tissues were defined as
fibroglandular tissues excluding fatty tissues. This distinction was always feasible as none of the patients studied
had exclusively fat breast. A second ROI delimiting the lesion was drawn. The lesion was defined as the largest area
with a high enhancement, excluding macro vessels. As this
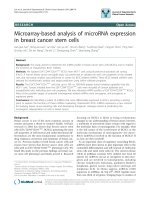
definition may be operator dependent, an automated
segmentation was also implemented (Fig. 3). In brief, a
rectangular ROI was defined in order to cover the whole
breast. For each pixel within this ROI, parameters amplitude and wash-in were calculated. A k-means clustering
algorithm was used to partition the pixels into 2 clusters
(lesion and non-lesion) [39]. Then, a morphological opening was applied to remove isolated groups of pixels. The
result of the segmentation was the largest region of contiguous pixels with the same behavior in amplitude and
Page 5 of 13
wash-in. This result was validated by comparison with the
ROI drawn manually.
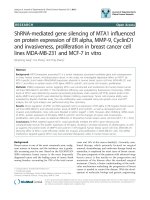
The visual texture of breast tissues was assessed from
the grey level co-occurrence matrix (GLCM) and the run
length matrix (RLM) [29, 40]. From the GLCM, nine textural features describing the grey levels interdependence in
the image were estimated (Fig. 4). Computation parameters
were: distance of one pixel between two neighbouring
pixels, average of the angular relationships on the four
main directions, five bits of grey levels. From the RLM,
eleven textural features describing the distribution of runs
of grey levels in the image were estimated with the same
computation parameters. The mean value (over all pixels
in the ROI studied) of the textural features was estimated.
The list of studied parameters is given in Table 3.
Statistical analysis
Numerical variables are expressed as median and range
(95 % CI on the median). The three-step comparative
approach was conducted as follows. First, texture
parameters were compared in healthy breast tissues vs
Fig. 2 Top, axial fat-suppressed T1 weighted imaging (time corresponding to the second post-contrast image). Two large ROIs, one encompassing
the lesion (in red) and one encompassing normal breast tissues (in green), were defined for visual texture analysis. A small ROI (in yellow) in the brightest
part of the lesion was also defined to study the kinetics of the contrast agent. Bottom, the signal intensity vs time curve (temporal sampling 60 s)
corresponding to the small ROI (from which kinetic parameters are derived) is displayed. Amplitude was calculated from the maximum enhancement
peak, the wash-in parameter from the up-slope measurement (between the maximum enhancement peak and the preceding time point) and the
wash-out parameter from linear regression performed on the last three time points of the signal intensity versus time curve
Michoux et al. BMC Cancer (2015) 15:574
Page 6 of 13
Fig. 3 Automated segmentation of the tumor lesion. A rectangular area covering the breast is placed (a). Pixel-level calculation of parameters
wash-in (b) and amplitude (c) is performed. Pixels are partitioned into k = 2 clusters (d). Morphological opening is applied to preserve the largest
region of contiguous pixels with the same behavior in amplitude and wash-in only (e). Comparison with the manual delineation of the lesion
shows an overall good agreement (f)
tissues showing characteristics of a malignant lesion. A
Wilcoxon rank-sum test was performed. This nonparametric test was chosen as the normality of the data
distribution was not verified (on the basis of the
D’Agostino-Pearson test).
Secondly, texture, kinetic, BI-RADS and biological parameters were compared in NR vs PR + CR individually.
A mid-P approach of Fisher’s exact test was performed
for assessing the relationship between response (NR or
PR + CR) and features [41]. The performance of each
parameter in predicting non-response to NAC was
assessed by using receiver operating characteristic
(ROC) curves and by comparing Area Under the ROC
Curves (AUC) [42].
Thirdly, texture, kinetic, BI-RADS and biological parameters were combined. Two multi-parametric classifiers, each belonging to one of the two classes of
algorithms in machine learning (supervised and unsupervised), were tested: a logistic regression model
[43] and a k-means clustering algorithm based on a
nearest-cluster approach [39]. The k-means algorithm
was parameterized with a number of final clusters equal
to 2, 2 random observations to choose the initial cluster
centroid positions, 30 replicates and with the L1 distance
to calculate the distance between centroid clusters. As one
cannot know a priori how many and which parameters
are important to the classification, all possible combinations of 2 to 26 parameters among 26 parameters (20 texture parameters, 3 kinetic parameters, the mass/non-mass
enhancement, Ki67 > 14 %, HR/HER2) were submitted to
the classifiers successively.
To estimate how accurately the predictive models
would perform in practice, a leave-one-out cross validation was applied [44]. The cross validation works by
leaving one observation (i.e. one patient data) out each
time the classifier is trained. Thus, the observation can
be used to test the classifier accuracy. The operation is
then carried out for all observations. Hence, the percentage of NR patients classified correctly (i.e. the classifier
sensitivity, Se) and the percentage of PR + CR patients
classified correctly (i.e. the classifier specificity, Sp) were
estimated. Se and Sp were finally used to identify the set
of features that yielded best predictive models.
All calculations (texture computation and statistics) were
done with Matlab (Matlab R2011b, MathWorks, Natick,
MA, USA). Open source codes “KeyRes-Technologies”
Michoux et al. BMC Cancer (2015) 15:574
Page 7 of 13
Fig. 4 Pixel-level analysis of breast MRI texture in a CR patient with a mass enhancement. Are respectively displayed, a the axial subtracted image
and the maps based on b contrast, c correlation, d difference variance, e energy, f entropy, g inverse differential moment (which is correlated
with the homogeneity parameter), h sum average and i sum variance from the GLCM, with mean value estimated on a 3x3 neighbourhood
around the pixel of interest then normalized on the 0–255 range. Individual texture parameters reveal different local and regional statistical
properties of the grey level intensity between (and respectively within) breast lesions and normal parenchyma. Combination of all or parts of the
texture parameters helps classifying patients according to their response to NAC
and “grayrlmatrix” under Matlab were used for computing
texture parameters. The software Image J ( was used for the segmentation of the ROIs. A
p-value < 0.05 was considered as statistically significant for
all tests cited above, as the universal null hypothesis was of
no interest in this study [45].
Results
Biological and imaging parameters
Morphological, biological and histological findings are
reported in Table 2. Neither the mass enhancement nor
the non-mass enhancement were statistically different
between NR and PR + CR. NR were significantly more
represented in Luminal-A subtype compared to PR + CR.
NR were significantly less represented in Ki67 > 14 % and
HR-/HER2+ compared to PR + CR (non-significant trend).
No statistical difference on histological grade between NR
and PR + CR was observed.
Texture and kinetic parameters are reported in Table 4.
Significant differences between healthy tissues and malignant tissues were observed for all texture parameters
(all p-value < 0.05).
Mono-parametric prediction
AUC values, sensitivity and specificity of selected cut-offs
are given for all parameters in Table 5. Parameters energy,
entropy, homogeneity inverse difference moment, RP,
HGRE and wash-in were found to have an AUC significantly different from 0.5 (penergy = 0.002, pentropy = 0.003,
phomogeneity = 0.001, pinv. diff. mom. = 0.001, pdiff. var. = 0.023,
pRP = 0.045, pHGRE = 0.038, pwash-in = 0.008). The performance associated with these parameters ranged from fair
(0.5 < AUC ≤ 0.7) to good (0.7 < AUC ≤ 0.9). The pairwise
comparison of AUCs did not allow ranking strictly
these parameters according to their individual performance (p > 0.05 whatever the comparison).
Michoux et al. BMC Cancer (2015) 15:574
Page 8 of 13
Table 3 List of parameters used for breast lesion characterization
Parameter type
Parameter description
Kinetic
1
Wash-in rate
Rate of contrast material uptake
2
Maximal amplitude
Maximal contrast enhancement
3
Wash-out rate
Rate of contrast enhancement washout
Geometric (according to BI-RADS lexicon)
4
Mass
3D space-occupying lesion that comprises one process,
usually round, oval, lobular or irregular in shape
5
non Mass
Enhancement of an area that is not a mass
6a
Energy
Measure of local uniformity of grey levels
7a
Entropy
Measure of randomness of grey levels
Texture
a
8
Contrast
Measure of the amount of grey levels variations
9a
Homogeneity
Measure of local homogeneity. It increases with less contrast
10a
Correlation
Measure of linear dependency of grey levels of neighbouring pixels
11a
Inverse difference moment
Measure of local homogeneity of the grey levels
a
12
Sum average
Measure of overall image brightness
13a
Sum variance
Measure of how spread out the sum of the grey levels of voxel pair is
14a
Difference in variance
Measure of variation in the difference in gray levels between voxel pairs
15b
SRE
Short Run Emphasis (first property of run-length distribution)
b
16
LRE
Long Run Emphasis
17b
GLN
Gray-Level Nonuniformity
18b
RLN
Run-Length Nonuniformity
19b
RP
Run percentage
b
20
LGRE
Low Gray-Level Run Emphasis
21b
HGRE
High Gray-Level Run Emphasis
22b
SRLGE
Short Run Low Gray-Level Emphasis
23b
SRHGE
Short Run High Gray-Level Emphasis
24b
LRLGE
Long Run Low Gray-Level Emphasis
25b
LRHGE
Long Run High Gray-Level Emphasis
a
Parameters derived from the co-occurrence matrix [29]
Parameters derived from the run length matrix [40]
3D three-dimensional, BI-RADS breast imaging reports and data system
b
Multi-parametric prediction
Using k-means clustering as classifier, a predictive model
relying on four parameters (inverse difference moment,
GLN, LRHGE, wash-in) was found to perform with a
predictive accuracy of 68 %: Se = 84 % (16/19 NR) and
Sp = 62 % (31/50 PR + CR). Using log-transformed parameters (energy, homogeneity, wash-in, LRHGE), it was
possible to increase the percentage of NR classified correctly up to 95 % (18/19), but with a lower specificity of
32 % (16/50 PR + CR) and a lower predictive accuracy of
64 %. Using logistic regression as classifier, a more parsimonious predictive model was found. It was based on
two texture parameters only (homogeneity, LGRE) and
exhibited a predictive accuracy of 74 %: Se = 74 % (14/19
NR) and Sp = 74 % (37/50 PR + CR). Models using other
combinations and/or a larger number of parameters
did not improve the predictive accuracy (regardless of
the type of classifier).
Discussion
The first observation of this study is that texture analysis discriminates healthy breast tissues from tumor
lesion. Texture is more heterogeneous and coarse in
the enhancing part of the lesion compared to healthy
tissue. This observation agrees with previously published
results on the ability of visual texture parameters to
Michoux et al. BMC Cancer (2015) 15:574
Page 9 of 13
Table 4 Median values (95 % CI) of the texture and kinetic parameters
Normal tissue
CR + PR
NR
p-valuea
Energy
58 [44; 74]
36 [33; 41]
45 [42; 55]
7.9 10−5
Entropy
157 [141; 172]
187 [181; 193]
175 [165; 180]
6.4 10−5
Contrast
8 [6; 10]
14 [11; 16]
13 [10; 16]
8.6 10−5
165 [150; 176]
140 [134; 146]
149 [144; 156]
5.1 10−5
22 [18; 29]
47 [42; 52]
47 [44; 50]
1.8 10−14
174 [161; 185]
148 [141; 153]
158 [153; 165]
4.2 10−5
Sum average
69 [65; 76]
119 [114; 124]
120 [109; 127]
3.6 10−19
Sum variance
70 [60; 76]
92 [88; 99]
97 [86; 110]
2.2 10−15
Difference variance
74 [67; 81]
87 [82; 93]
80 [78; 83]
4.6 10−3
SRE
0.009 [0.008; 0.009]
0.004 [0.0039; 0.0044]
0.0038 [0.0035; 0.0047]
6.2 10−19
LRE
126 [114; 144]
266 [246; 279]
284 [229; 309]
7.6 10−20
GLN
158 [137; 229]
432 [338; 589]
416 [298; 817]
1.2 10−10
RLN
71 [58; 86]
111 [74; 120]
105 [89; 205]
6.2 10−4
RP
0.68 [0.62; 0.72]
0.72 [0.71; 0.75]
0.70 [0.66; 0.73]
9.3 10−4
LGRE
0.75 [0.71; 0.78]
0.79 [0.78; 0.81]
0.77 [0.74; 0.80]
9.8 10−4
HGRE
3.11 [2.54; 3.99]
2.55 [2.33; 2.76]
2.83 [2.49; 3.34]
8.8 10−3
SRLGE
0.0060 [0.0056; 0.0067]
0.0033 [0.0031; 0.0034]
0.0030 [0.0028; 0.0036]
2.6 10−17
SRHGE
0.028 [0.024; 0.034]
0.011 [0.010; 0.012]
0.011 [0.009; 0.014]
6.4 10−18
LRLGE
93 [84; 101]
204 [189; 215]
214 [177; 251]
6.0 10−20
LRHGE
412 [343; 509]
679 [615; 745]
799 [592; 925]
1.9 10−9
Amplitude
_
75 [70; 80]
68 [59; 79]
_
Wash-out
_
0.04 [0.03; 0.06]
0.04 [0.008; 0.070]
_
Wash-in
_
0.72 [0.64; 0.83]
0.63 [0.42; 0.70]
_
Homogeneity
Correlation
Inv. Diff. Moment
Amplitude is given in arbitrary unit (AU), wash-in and wash-out in AU.s−1
NR Non response, CR Complete response, PR Partial response
a
Statistical difference (Wilcoxon) between normal tissues and tumoral lesion
differentiate normal from malignant tissue with breast
DCE-MRI [27].
The second observation is that the predictive performance of individual texture and kinetic parameters did not
exceed the level fair, except for parameters homogeneity
and inverse difference moment whose performance level
is evaluated as good.
The third observation is that a multi-parametric model
based on texture and kinetic parameters was able to predict non-response to NAC with a good performance
level. This observation needs to be discussed according
to the study design.
The usefulness of pre-NAC DCE parameters in predicting response to NAC was proven in several studies,
however on the basis of different assumptions. While
Uematsu et al. [24] suggest that a washout enhancement
pattern is related to a more effective cycle of NAC,
Pickles et al. [25] conclude that high values of perfusion
and capillary permeability indicate a high level of angiogenesis and, are therefore indicative of treatment failure.
In our study, a faster contrast agent uptake by the tumor
as well as a (non-significant) trend towards a higher
washout value were observed in PR + CR. The increased
pre-NAC vascularity and permeability characteristics
may be interpretable in terms of better delivery of chemotherapeutic agents to the tumor and better treatment
efficacy. However, we think that the assumption of vascular characteristics associated with NAC efficacy must
be considered with caution. First, drug resistance is a
multifactorial phenomenon where cellular mechanisms
have a predominant role [46]. Secondly, standard protocol
in dynamic breast MRI based on a high spatial resolution
such as the one we used in this study does not meet all requirements for an accurate analysis of transport mechanisms in lesions [47]. Such analysis requires a sampling
rate less than the mean transit time of the contrast agent,
the measurement of an individual arterial input function,
the knowledge of the relationship between signal intensity
and contrast agent concentration in the tissues and a pertinent mass transport model [48–50].
The usefulness of pre-NAC texture parameters in predicting response to NAC was confirmed in this study, but
based on a partially different set of parameters compared
to previously published studies. In [33], an increased
Michoux et al. BMC Cancer (2015) 15:574
Page 10 of 13
Table 5 Performance of the individual parameters measured
from ROC curves (based on the Youden index for determining
cut-offs)
Se (%)
Sp (%)
AUC
Energy
64
79
0.702
41
Entropya
64
79
0.696
182
a
Cut-offs
Contrast
30
95
0.576
17
Homogeneitya
58
84
0.701
144
Correlation
62
16
0.512
42
Inv. Diff. Momenta
60
84
0.711
152
Sum average
28
90
0.527
103
Sum variance
78
42
0.583
104
Difference variancea
60
79
0.649
86
SRE
80
42
0.569
0.004
LRE
86
37
0.569
301
GLN
74
42
0.555
621
RLN
38
90
0.579
75
RPa
42
90
0.640
0.740
LGRE
42
90
0.630
0.800
HGREa
42
90
0.644
2.40
SRLGE
70
53
0.582
0.003
SRHGE
16
100
0.510
0.007
LRLGE
80
37
0.536
233
LRHGE
72
58
0.620
781
Amplitude
67
58
0.567
69.1
Wash-out
27
95
0.594
0.09
Wash-in
86
47
0.685
0.50
Massb
63
46
0.546
_
non Mass
63
46
0.546
_
Ki67 > 14 %b
42
82
0.621
_
HER2 +
79
44
0.615
_
HR-/HER2 +b
100
20
0.600
_
a
b
b
An overall better performance of GLCM compared to RLM parameters, as well
as a better performance of texture and kinetic parameters compared to BI-RADS
and biological parameters was observed
a
Parameters performing significantly better than a random classifier
(p(AUC > 0.5) < 0.05)
b
Categorial variables without cut-offs
heterogeneity of the texture indicated by the higher values
of two parameters (contrast, difference variance) was observed in NR. However, texture was evaluated from the
whole lesion including central necrosis, thus increasing
the heterogeneity measurements. In the present study, a
reduced heterogeneity of the texture (as indicated by the
four significant GLCM parameters) in the enhancing part
of the lesion was found in NR compared to PR + CR. One
of these parameters (inverse difference moment) was
found to be predictive of a reduced chemotherapeutic response, but jointly with two RLM parameters (GLN,
LRHGE) whose high values indicate a more heterogeneous
distribution of some grey level run lengths in NR. There is
no obvious explanation at the histological level for these
differences of behavior. Further investigations on how and
which texture parameters are associated with tumor biology may help defining on the relationship between texture
heterogeneity and response to NAC.
Methodological differences in the assessment of texture limit the comparisons between studies. The most
common texture analysis techniques are derived either
from grey level histogram [51], gradient matrix [52],
GLCM [29], RLM [40], local binary patterns [52], autoregressive model [53], Riesz transform [54], multiple
frequency scales [55], S-transform [56] or from wavelet
[57]. None of these approaches is superior to the others
since their effectiveness basically relies on the visual
properties of images to which they are applied. Combining various texture methods may improve the
characterization of breast lesions as demonstrated by
our data. However, increasing the number of texture
parameters has some drawbacks. Dimensionality reduction techniques prior to classification, sophisticated
machine learning classifiers as well as larger training
datasets become necessary. Our four-parameter predictive model may thus present a practical advantage
over those proposed in [33, 34] for further testing.
The usefulness of BI-RADS mass/non-mass enhancement could not be validated possibly due to a high
prevalence of non-mass lesions in our cohort [8, 24].
Rates of complete responders are known to be different
within tumor subtypes [7]. We assumed that the low
statistical power induced by the small number of patients within each subtype prevents from observing such
difference. Ki67 > 14 % and HR-/HER2+ were the only
markers more often seen in responders. These parameters, having a fair performance, were not retrieved in the
best predictive model.
The performance of our predictive model, albeit good,
appeared lower compared to the one reported in previous studies. In [26, 32, 34], predictive accuracy was 85,
83 and 88 % respectively. However, comparison is flawed
as cross-validation was not performed in either of these
studies, while it is necessary to get an unbiased estimate
of the predictive accuracy [58]. The use of techniques
such as cross-validation, bootstrapping or Bayesian confidence interval should be generalized to get a reliable
assessment of classifier performance, useful to estimate
the relevance of the working hypothesis and mandatory
for clinical acceptance.
Clinical response definition and chemotherapy regimen
may influence the predictive accuracy. In [32], the difference between ‘good’ and ‘bad’ responders was arbitrarily
fixed at 50 % decrease in tumor volume between baseline
MRI and after 2 cycles of chemotherapy. We on the other
Michoux et al. BMC Cancer (2015) 15:574
hand used the pathological response, which is the gold
standard in the assessment of response to NAC. In [34],
the predictive accuracy of the model depended on the type
of chemotherapy regimen undergone by the patients. A
similar report was made by Richard et al. studying the
predictive value of pre-treatment apparent diffusion coefficients [59]. This raises the question of whether a
generalized predictive model of response to NAC independent of chemotherapy regimen can be established.
There are several limitations to the study. First, this is
a retrospective study based on a limited number of patients. While our first dataset served for model learning,
a second and larger dataset is necessary to validate the
performance of the predictive model. This approach,
replicating the most interesting results of the pilot study,
will address significance problem that may arise when
dealing with a large set of parameters. Besides, various
types of machine learning classifier can be envisaged, influencing the performance as well [60]. Further tests
may be needed to compare the efficacy and practicality
of these classifiers. In this pilot study, a single subtracted
MR image was evaluated at a specific time-point corresponding to the enhancement peak on intensity time
curves. Subtracted images were chosen because of the
attenuation of the normal parenchymal background enhancement. Tests on late time points (i.e. on the fifth
and sixth dynamics corresponding to imaging of tumor
permeability) did not allow for the identification of a
good predictive model. Due to its complexity, multi-slice
evaluation based on 3D segmentation of the lesion and
3D texture analysis was not envisaged in first instance.
However, 3D is one of the strategies to be considered for
improving the prediction of response to NAC. Only patients with invasive ductal carcinoma were included. The
choice of a single subtype of cancer, far from constituting a selection bias, is legitimate within a dichotomous
approach of the problem of predicting response to NAC.
Our outcome score depended on histopathological findings and we wanted therefore to obtain a histologically
homogeneous group to test texture analysis. Furthermore,
it has been demonstrated that invasive lobular carcinoma
is less sensitive to NAC [61]. Other studies emphasized
that in ILC, immediate treatment with endocrine therapy
might be more beneficial [62]. Finally, though combining
texture and kinetic parameters with BI-RADS and biological markers did not presently improve the predictive
accuracy, these latter parameters should not be discarded
in another framework where different (or several) subtypes
of breast cancer would be studied.
Conclusion
Pre-NAC texture and kinetic parameters measured from
dynamic breast MRI help predict non-response of invasive ductal carcinoma to neoadjuvant chemotherapy.
Page 11 of 13
Due to the numerous steps necessary to the processing
of DCE-MR images, further investigations are needed. It
is especially important to test other texture features and
statistical classifiers to improve the overall performance
of the model, and to include larger groups of tumor subtypes in order to improve the generalization properties of
the predictive model. The rationale behind these investigations is the development of a computer-assisted prediction
solution dedicated to breast MRI. Such a solution would
be cost-effective in comparison to genetic/molecular assessments and may contribute to an appropriate treatment
outcome for patients with breast cancer initially eligible
for NAC.
Competing interest
The authors declare that they have no competing interests.
Authors’ contributions
NM conceived the study, carried out the image processing and the statistical
analysis, and drafted the manuscript. SVdB and LL performed the acquisition
of breast MR images and drew the regions of interest. LF carried out the
patient data management and supervised with IL the radiological
interpretation of MR images. CG performed the histological analysis. MB
provided the expertise in oncology. IL participated in the design of the study
and helped to draft the manuscript. All authors read and approved the final
manuscript.
Acknowledgements
We thank Professor François Duhoux (IREC – Université Catholique de
Louvain, Belgium) for his expertise in oncology, and Alain Guillet (SMCS –
Université Catholique de Louvain, Belgium) for his expertise in data mining.
Author details
1
Radiology Department, IREC (Institute of Experimental and Clinical Research) IMAG, Université Catholique de Louvain, Cliniques Universitaires Saint-Luc,
Avenue Hippocrate 10, Brussels B1200, Belgium. 2Radiology Department,
Cliniques Universitaires Saint-Luc, Avenue Hippocrate 10, Brussels B1200,
Belgium. 3Surgery Department, Cliniques Universitaires Saint-Luc, Avenue
Hippocrate 10, Brussels B1200, Belgium. 4Pathology Department, Cliniques
Universitaires Saint-Luc, Avenue Hippocrate 10, Brussels B1200, Belgium.
Received: 7 March 2014 Accepted: 16 July 2015
References
1. Kaufmann M, von Minckwitz G, Smith R, Valero V, Gianni L, Eiermann W,
et al. International expert panel on the use of primary (preoperative)
systemic treatment of operable breast cancer: review and
recommendations. J Clin Oncol. 2003;21:2600–8.
2. Heys SD, Hutcheon AW, Sarkar TK, Ogston KN, Miller ID, Payne S, et al.
Neoadjuvant docetaxel in breast cancer: 3-year survival results from the
Aberdeen trial. Clin Breast Cancer. 2002;3:S69–74.
3. Van der Hage JA, van de Velde CJ, Julien JP, Tubiana-Hulin M,
VanderveldenC DL. Preoperative chemotherapyin primary operable breast
cancer: results from the European Organization for Research and Treatment
of Cancer trial 10902. J Clin Oncol. 2001;19:4224–32.
4. Mieog JS, van der Hage JA, van de Velde CJ. Preoperative chemotherapy for
women with operable breast cancer. Cochrane Database Syst Rev.
2007;18:CD005002.
5. Fisher B, Bryant J, Wolmark N, Mamounas E, Brown A, Fisher ER, et al. Effect
of preoperative chemotherapy on the outcome of women with operable
breast cancer. J Clin Oncol. 1998;16:2672–85.
6. Barbi GP, Marroni P, Bruzzi P, Nicolò G, Paganuzzi M, Ferrara GB. Correlation
between steroid hormone receptors and prognostic factors in human
breast cancer. Oncology. 1987;44:265–9.
7. von Minckwitz G, Sinn HP, Raab G. Clinical response after two cycles
compared to HER2, Ki-67, p53, and bcl-2 in independently predicting a
Michoux et al. BMC Cancer (2015) 15:574
8.
9.
10.
11.
12.
13.
14.
15.
16.
17.
18.
19.
20.
21.
22.
23.
24.
pathological complete response after preoperative chemotherapy in
patients with operable carcinoma of the breast. Breast Cancer Res.
2008;10:R30.
Esserman LJ, Kaplan E, Partridge S, Tripathy D, Rugo H, Park J, et al.
MRI phenotype is associated with response to doxorubicin and
cyclophosphamide neoadjuvant chemotherapy in Stage III breast
cancer. Ann Surg Oncol. 2001;8:549–59.
Nishimura R, Osako T, Okumura Y, Hayashi M, Arima N. Clinical
significanceof Ki-67 in neoadjuvant chemotherapy for primary breast cancer
as a predictor for chemosensitivity and for prognosis. Breast Cancer.
2010;17:269–75.
Fangberget A, Nilsen LB, Hole KH, Holmen MM, Engebraaten O, Naume B,
et al. Neoadjuvant chemotherapy in breast cancer-response evaluation and
prediction of response to treatment using dynamic contrast-enhanced and
diffusion-weighted MR imaging. Eur Radiol. 2011;21:1188–99.
Press MF, Sauter G, Buyse M, Bernstein L, Guzman R, Santiago A, et al.
Alteration of topoisomerase II-alpha gene in human breast cancer:
association with responsiveness to anthracycline-based chemotherapy.
J Clin Oncol. 2011;29:859–67.
Chang JC, Wooten EC, Tsimelzon A, Hilsenbeck SG, Gutierrez MC, Elledge R,
et al. Gene expression profiling for the prediction of therapeutic response
to docetaxel in patients with breast cancer. Lancet. 2003;362:362–9.
von Minckwitz G, Untch M, Blohmer JU, Costa SD, Eidtmann H, Fasching PA,
et al. Definition and impact of pathologic complete response on prognosis
after neoadjuvant chemotherapy in various intrinsic breast cancer subtypes.
J Clin Oncol. 2012;30:1796–804.
Woodhams R, Matsunaga K, Iwabuchi K, Kan S, Hata H, Kuranami M, et al.
Diffusion-weighted imaging of malignant breast tumors: the usefulness of
apparent diffusion coefficient (ADC) value and ADC map for the detection
of malignant breast tumors and evaluation of cancer extension. J Comput
Assist Tomogr. 2005;29:644–9.
Woodhams R, Kakita S, Hata H, Iwabuchi K, Kuranami M, Gautam S, et al.
Identification of residual breast carcinoma following neoadjuvant
chemotherapy: diffusion-weighted imaging–comparison with
contrast-enhanced MR imaging and pathologic findings. Radiology.
2010;254:357–66.
Wu L-M, Hu J-N, Gu H-Y, Hua J, Chen J, Xu J-R. Can diffusion-weighted MR
imaging and contrast-enhanced MR imaging precisely evaluate and predict
pathological response to neoadjuvant chemotherapy in patients with breast
cancer? Breast Cancer Res Treat. 2012;135:17–28.
Tozaki M, Sakamoto M, Oyama Y, Maruyama K, Fukuma E. Predicting
pathological response to neoadjuvant chemotherapy in breast cancer with
quantitative 1H MR spectroscopy using the external standard method.
J Magn Reson Imaging. 2010;31:895–902.
Murata Y, Hamada N, Kubota K, Miyatake K, Tadokoro M, Kataoka Y, et al.
Choline by magnetic spectroscopy and dynamic contrast enhancement
curve by magnetic resonance imaging in neoadjuvant chemotherapy for
invasive breast cancer. Mol Med Rep. 2009;2:39–43.
Ah-See ML, Makris A, Taylor NJ, Harrison M, Richman PI, Burcombe RJ, et al.
Early changes in functional dynamic magnetic resonance imaging predict
for pathologic response to neoadjuvant chemotherapy in primary breast
cancer. Clin Cancer Res. 2008;14:6580–9.
Martincich L, Montemurro F, De Rosa G, Marra V, Ponzone R, Cirillo S, et al.
Monitoring response to primary chemotherapy in breast cancer using
dynamic contrast-enhanced magnetic resonance imaging. Breast Cancer
Res Treat. 2004;83:67–76.
Li SP, Makris A, Beresford MJ, Taylor NJ, Ah-See ML, Stirling JJ, et al. Use of
dynamic contrast enhanced MR imaging to predict survival in patients with
primary breast cancer undergoing neoadjuvant chemotherapy. Radiology.
2011;260:68–78.
Loo CE, Teertstra HJ, Rodenhuis S, van de Vijver MJ, Hannemann J, Muller
SH, et al. Dynamic contrast-enhanced MRI for prediction of breast cancer
response to neoadjuvant chemotherapy: initial results. AJR Am J
Roentgenol. 2008;191:1331–8.
de Bazelaire C, Calmon R, Thomassin I, Brunon C, Hamy AS, Fournier L, et al.
Accuracy of perfusion MRI with high spatial but low temporal resolution to
assess invasive breast cancer response to neoadjuvant chemotherapy:
a retrospective study. BMC Cancer. 2011;11:361.
Uematsu T, Kasami M, Yuen S. Neoadjuvant chemotherapy for breast
cancer: correlation between the baseline MR imaging findings and
responses to therapy. Eur Radiol. 2010;20:2315–22.
Page 12 of 13
25. Pickles MD, Manton DJ, Lowry M, Turnbull LW. Prognostic value of
pre-treatment DCE-MRI parameters in predicting disease free and
overall survival for breast cancer patients undergoing neoadjuvant
chemotherapy. Eur J Radiol. 2009;71:498–505.
26. Craciunescu OI, Blackwell KL, Jones EL, Macfall JR, Yu D, Vujaskovic Z, et al.
DCE-MRI parameters have potential to predict response of locally advanced
breast cancer patients to neoadjuvant chemotherapy and hyperthermia:
a pilot study. Int J Hyperthermia. 2009;25:405–15.
27. Bhooshan N, Giger ML, Jansen SA, Li H, Lan L, Newstead GM. Cancerous
breast lesions on dynamic contrast-enhanced MR images: computerized
characterization for image-based prognostic markers. Radiology.
2010;254:680–90.
28. Holli K, Lääperi AL, Harrison L, Luukkaala T, Toivonen T, Ryymin P, et al.
Characterization of breast cancer types by texture analysis of magnetic
resonance images. Acad Radiol. 2010;17:135–41.
29. Haralick RM, Dinstein I, Shanmugan K. Textural features for image
classification. IEEE Trans Syst Man Cybern. 1973;SMC-3:610–21.
30. Zhang Y, Moore GR, Laule C, Bjarnason TA, Kozlowski P, Traboulsee A, et al.
Pathological correlates of magnetic resonance imaging texture
heterogeneity in multiple sclerosis. Ann Neurol. 2013;74:91–9.
31. Hajek M, Dezortova M, Materka A, Lerski R. Texture analysis for magnetic
resonance imaging. Czech Republic: Med4 publishing; 2006.
ISBN: 978-80-903660-0-8.
32. Gibbs P, Turnbull LW. Textural analysis of contrast-enhanced MR images of
the breast. Magn Reson Med. 2003;50:92–8.
33. Ahmed A, Gibbs P, Pickles M, Turnbull L. Texture analysis in assessment and
prediction of chemotherapy response in breast cancer. J Magn Reson
Imaging. 2013;38:89–101.
34. Nie K, Chen J-H, Yu HJ, Chu Y, Mehta RS, Nalcioglu O, Su M-Y. Quantitative
analysis of MRI tumor characteristics for neoadjuvant chemotherapy
response prediction in breast cancer to the first-line doxorubicincyclophosphamide regimen and the AC followed by Taxane Regimen. In
Proceedings of the 15th International Society for Magnetic Resonance in
Medicine, abstract 558. Berlin: Publisher International Society for Magnetic
Resonance in Medicine (ISMRM); 2007.
35. Sahoo S, Lester SC. Pathology of breast carcinomas after neoadjuvant
chemotherapy: an overview with recommendations on specimen
processing and reporting. Arch Pathol Lab Med. 2009;133:633–42.
36. Mudduwa L. Pathological parameters predicting HER-2/neu status of breast
carcinoma. J Diagn Pathol. 2006;5:13–8.
37. American College of Radiology. Breast imaging reporting and data system
(BI-RADS). 4th ed. Reston: American College of Radiology; 2003.
38. Liney G, Gibbs P, Hayes C, Leach MO, Turnbull LW. Dynamic contrastenhanced MRI in the differentiation of breast tumours: user defined
versus semi-automated region-of-interest analysis. J Magn Reson Imaging.
1999;10:945–9.
39. Likas A, Vlassis N, Verbeek JJ. The global k-means clustering algorithm.
Pattern Recogn. 2003;36:451–61.
40. Tang X. Texture information in run-length matrices. IEEE Trans Image
Process. 1998;7:1602–9.
41. Armitage P, Berry G, Matthews JNS. Statistical methods in medical research.
4th ed. Oxford: Blackwell Science; 2002.
42. DeLong ER, DeLong DM, Clarke-Pearson DL. Comparing the areas under
two or more correlated receiver operating characteristic curves: a non
parametric approach. Biometrics. 1988;44:837–45.
43. Pampel FC. Logistic regression: A primer. Thousand Oaks, California: Sage
University Papers Series on Quantitative Applications in the Social Sciences;
2000. p. 7–132.
44. Baumann K. Cross-validation as the objective function for variable-selection
techniques. Trends Anal Chem. 2003;22:395–406.
45. Rothman KJ. No adjustments are needed for multiple comparisons.
Epidemiology. 1990;1:43–6.
46. Place AE, Jin Huh S, Polyak K. The microenvironment in breast cancer
progression: biology and implications for treatment. Breast Cancer Res.
2011;13:227–38.
47. Kuhl C. The current status of breast MR imaging. Part I. Choice of technique,
image interpretation, diagnostic accuracy, and transfer to clinical practice.
Radiology. 2007;244:356–78.
48. Kershaw LE, Cheng H-L M. Temporal resolution and SNR requirements for
accurate DCE-MRI data analysis using the AATH model. Magn Reson Med.
2010;64:1772–80.
Michoux et al. BMC Cancer (2015) 15:574
Page 13 of 13
49. Yang C, Karczmar GS, Medved M, Oto A, Zamora M, Stadler WM.
Reproducibility assessment of a multiple reference tissue method for
quantitative dynamic contrast enhanced–MRI analysis. Magn Reson Med.
2009;61:851–9.
50. Li X, Welch EB, Chakravarthy AB, Xu L, Arlinghaus LR, Farley J, et al. Statistical
comparison of dynamic contrast-enhanced MRI pharmacokinetic models in
human breast cancer. Magn Reson Med. 2012;68:261–71.
51. Castellano G, Bonilha L, Li LM, Cendes F. Texture analysis of medical images.
Clin Radiol. 2004;59:1061–9.
52. Ojala T, Pietikäinen M, Mäenpää T. Multiresolution gray–scale and rotation
invariant texture classification with local binary patterns. IEEE Trans Pattern
Anal Mach Intell. 2002;24:971–87.
53. Joshi MS, Bartakke PP, Sutaone MS. Texture representation using
autoregressive models Advances in Computational Tools for Engineering
Applications. In Proceedings Advances in Computational Tools for
Engineering Applications, International Conference ACTEA: Beirut. 2009.
380–385: doi: 10.1109/ACTEA.2009.5227958.
54. Depeursinge A, Foncubierta-Rodríguez A, Van De Ville D, Müller H.
Multiscale lung texture signature learning using the Riesz transform. In:
Proceedings of the 15th Medical Image Computing and Computer-Assisted
Intervention (MICCAI), vol. 7512. Nice: Lecture Notes in Computer Science;
2012. p. 517–24.
55. Loizou CP, Murray V, Pattichis MS, Seimenis I, Pantziaris M, Pattichis CS.
Multiscale amplitude-Modulation frequency-modulation (AM–FM) texture
analysis of multiple sclerosis in brain MRI images. IEEE Trans Info Tech
Biomed. 2011;15:119–28.
56. Drabycz S, Mitchell JR. Texture quantification of medical images using a
novel complex space-frequency transform. Int J CARS. 2008;3:465–75.
57. Mallat SG. A theory for multiresolution signal decomposition: the wavelet
representation. IEEE Trans Pattern Anal Mach Intell. 1989;11:674–93.
58. Arlot S, Celisse A. A survey of cross-validation procedures for model
selection. Stat Surveys. 2010;4:40–79.
59. Richard R, Thomassin I, Chapellier M, Scemama A, de Cremoux P, Varna M,
et al. Diffusion-weighted MRI in pretreatment prediction of response to
neoadjuvant chemotherapy in patients with breast cancer. Eur Radiol.
2013;23:2420–31.
60. Juntu J, Sijbers J, Van Dyck D. Classification of soft tissue tumors in MRI
images using kernel PCA and regularized least square classifier. In:
Proceedings of the 4th conference IASTED international conference.
Innsbruck: Signal Processing, Pattern Recognition, and Applications; 2007.
ISBN 978-0-88986-646-1.
61. Cocquyt VF, Blondeel PN, Depypere HT, Praet MM, Schelfhout VR, Silva OE,
et al. Different responses to preoperative chemotherapy for invasive lobular
and invasive ductal breast carcinoma. Eur J Surg Oncol. 2003;29:361–7.
62. Tubiana-Hulin M, Stevens D, Lasry S, Guinebretière JM, Bouita L, Cohen-Solal
C, et al. Response to neoadjuvant chemotherapy in lobular and ductal
breast carcinomas: a retrospective study on 860 patients from one
institution. Ann Oncol. 2006;17:1228–33.
Submit your next manuscript to BioMed Central
and take full advantage of:
• Convenient online submission
• Thorough peer review
• No space constraints or color figure charges
• Immediate publication on acceptance
• Inclusion in PubMed, CAS, Scopus and Google Scholar
• Research which is freely available for redistribution
Submit your manuscript at
www.biomedcentral.com/submit