Báo cáo hóa học: " In vivo evidence of htid suppressive activity on ErbB-2 in breast cancers over expressing the receptor" potx
Bạn đang xem bản rút gọn của tài liệu. Xem và tải ngay bản đầy đủ của tài liệu tại đây (3.35 MB, 13 trang )
Kurzik-Dumke et al. Journal of Translational Medicine 2010, 8:58
/>Open Access
RESEARCH
© 2010 Kurzik-Dumke et al; licensee BioMed Central Ltd. This is an Open Access article distributed under the terms of the Creative Com-
mons Attribution License ( which permits unrestricted use, distribution, and reproduc-
tion in any medium, provided the original work is properly cited.
Research
In vivo evidence of h
tid
suppressive activity on
ErbB-2 in breast cancers over expressing the
receptor
Ursula Kurzik-Dumke*
†1
, Manuela Hörner
1
, Maria R Nicotra
2
, Michael Koslowski
3
and Pier G Natali
†4
Abstract
Background: Htid encoded proteins are physiological partners of a wide spectrum of molecules relevant to neoplastic
transformation. One of the molecular ligands of the cytosolic hTid-L and hTid-I forms is the ErbB-2 receptor variably
over expressed in diverse solid tumors. Altered ErbB-2 signalling is associated with an unfavourable prognosis in about
30% of human breast malignancies.
Methods:
We evaluated htid and HER-2 expression by quantitative real time PCR in tumors of different TNMG status
and by immunohistochemistry in a cohort of breast tumors of the Luminal A, B, HER-2 and triple negative subtype.
Results:
The RT-PCR analysis revealed that aberrant expression of all three htid forms correlates with malignant trans-
formation. Furthermore, elevated hTid-L expression can be associated with less aggressive tumors. The immunohis-
tochemical testing revealed that tumors of the luminal A subtype are characterized by a high level of htid (81%). In
contrast htid expression is significantly lower in tumors of the Luminal B (20%) and HER-2 (18%) subtype over express-
ing the receptor and in the triple negative (40%) more aggressive malignancies. A statistically significant inverse corre-
lation between htid and ErbB-2 expression was found in human breast (p < 0,0001) and non-mammary tumors (p <
0,007), and in transgenic mice carrying the rat HER-2/neu oncogene.
Conclusions:
Our findings provide in vivo evidence that htid is a tissue independent and evolutionarily conserved sup-
pressor of ErbB-2.
Background
Htid-1 is the human counterpart [1] of the Drosophila
melanogaster lethal(2)tumorous imaginal discs (l(2)tid)
tumor suppressor gene [2]. (In the following we omit the
number "1" in the designation of the gene because it sug-
gests the presence of a further copy in the genome. As
sequencing of the human, mouse and Drosophila
genomes revealed only one tid gene is present in all these
species.)
The tid genes encode members of the highly conserved
DNAJA3 protein family acting as Hsp70/Hsc70 co-chap-
erones [3-5]. In the fly, defined recessive mutations have
been shown to be oncogenic in cell lineages responsive to
the signalling mediated by Patched (Ptc), the receptor for
the Hedgehog (Hh) signalling molecule [6]. The physio-
logical Tid-Ptc binding is conserved in the fly, in the
mouse and in man [6,7]. Using the yeast two-hybrid tech-
nique htid has been isolated as a molecular partner of a
variety of tumor related proteins [6-15] including recep-
tor tyrosine kinases (RTK) such as TRK-A [14] and ErbB-
2 [15] of the epidermal growth factor receptor (EGFR)
family comprising four receptors (ErbB1-4) [16]. As for
other members of these receptors, the ErbB-2 signal out-
put is controlled by a dynamic equilibrium between the
on/off states. In this regard, in vitro studies have shown
that interaction of the cytosolic hTid-L and hTid-I pro-
teins [1,7] with ErbB-2 promotes ubiquitination and deg-
radation of the receptor resulting in down regulation of
its signalling thus, of its oncogenic potential/activities
[15]. (The aforementioned hTid-I form, 453 amino acids
in size [1,7] is designated by Kim et al. [15] as hTid-S.).
* Correspondence:
1
Institute of Medical Microbiology and Hygiene, Comparative Tumor Biology
Group, University Medical Center, Johannes Gutenberg University, Obere
Zahlbacher Str. 63, 55131 Mainz, Germany
†
Contributed equally
Full list of author information is available at the end of the article
Kurzik-Dumke et al. Journal of Translational Medicine 2010, 8:58
/>Page 2 of 13
This is of interest since over expression of ErbB-2, often
caused by gene amplification, characterizes 20-30% of
human breast cancers being casually linked to an aggres-
sive clinical course of these tumors [17] and a variable
percentage of extra-mammary tumors [18]. These data
are consistent with the biology of the EGFR family mem-
bers mediating control of cellular responses such as pro-
liferation, differentiation, survival and apoptosis,
essential for the maintenance of the transformed and
metastatic phenotype. Thus, in the context of the func-
tional link between the htid encoded proteins and ErbB-2
in the present study we addressed the question whether
in human sporadic breast tumors the in vivo expression
profiles of the two tumor genes provide support for htid
function as a negative regulator of ErbB-2 activity. Since
htid encodes three splice forms [1,7] we compared their
expression levels with that of the HER-2 transcript using
quantitative real-time PCR (RT-PCR) and the compara-
tive Ct method for relative quantification [19] in a panel
of human breast tumors of diverse differentiation grades
[20,21]. Furthermore, we performed an extensive pheno-
typic comparative analysis of the expression of the two
target genes in a panel of human breast cancers classified
according to Sotiriou and Pusztai [22] as the subtypes
luminal A, luminal B, HER-2 and triple negative, and by
non breast tumors over expressing ErbB-2. Furthermore,
since the identification of an experimental in vivo model
mimicking human breast tumors is of great interest to
dissect the oncosuppressive activity of the tid gene at the
molecular level, we investigated mammary malignancies
in transgenic mice carrying the rat counterpart of HER-2/
neu. The data gained by RT-PCR showed that the single
htid splice forms [1,7] are differentially expressed in nor-
mal mammary epithelium. Whereas the htid-I form
shows the highest expression level (2
-ΔCt
= 0,50), the htid-
L form expression level is about 7 times lower (2
-ΔCt
=
0,07). The htid-S form is present only residually (2
-ΔCt
=
3,18 × 10
-5
). Generally, the expression level of each of the
single htid splice forms is lower as that determined for
HER-2 (2
-ΔCt
= 4,99). In breast tumors the expression lev-
els of all three htid transcripts are altered. As a result the
amount-ratio among the diverse htid forms and the HER-
2 transcript changes drastically.
The phenotypic analysis of tumor specimens demon-
strated that hTid and ErbB-2 expression are inversely cor-
related in breast cancer either primary (p < 0.0001) or
metastatic (p < 0.023), in primary non-breast tumors (p <
0,007) and in breast tumors generated in HER-2/neu
transgenic mice. Overall these results identify htid as a
novel negative modulator of HER-2, suggesting that strat-
egies capable of increasing or stabilizing its cellular level
may result into a decrease of the oncogenic signalling
mediated by the receptor.
Materials and methods
Patients and tissues
The specimens of breast and non breast tumors
employed in this study originate from patients free from
therapy undergoing treatment at various institutions.
Normal breast tissue was obtained from cosmetic mam-
moplast. Samples used for RT-PCR originate from
archive of tumor samples kindly provided by Dr. Ö. Türe-
ci of the Experimental and Translational Oncology III,
University Medical Center, Johannes Gutenberg Univer-
sity, Mainz. Specimens assayed by immunohistochemis-
try were obtained at the "Regina Elena" Cancer Institute,
Rome, Italy. The patients consented to the experimental
use of the specimens as requested by the Institutional
Ethical Committee (IRE resolution of n° 7 of July 2
nd
,
2003 adjourned on January,1
st
, 2006). All tumor samples
used in this study were characterized with respect to their
TNMG status according to WHO specifications follow-
ing the criteria of the International Union Against Cancer
UICC [20] and the Elston and Ellis method [21]. Freshly
collected tissue samples were divided into two parts. One
part was processed for routine histopathological exami-
nation, the other was immediately shock frozen. The col-
lected samples were stained with 1% toluidine blue to
monitor morphology and the ratio of glandular epithe-
lium and interstitium. Exclusively samples characterized
by high amount of glandular epithelium, over 80%, were
used for RT-PCR and immunohistochemistry. Non-con-
secutive 4 μm thick cryostat sections were prepared, fixed
for 10 min in absolute acetone, and either submitted to
indirect immunoperoxidase (IPP) staining or stored at -
20°C over a period of a month with no loss of immune
reactivity. The immunohistochemical analysis was per-
formed on 75 randomly selected cases of infiltrating duc-
tal carcinomas and 30 metastatic (25 lymphathic and 5
extra-lymphatic lesions) carcinomas building the first
cohort. The second cohort of specimens consisted of 58
primary infiltrating breast tumors classified according to
Sotiriou and Pusztaim [22] into the four distinct sub-
types: luminal A, luminal B, HER-2 and triple negative on
the basis of the results of immunohistochemical evalua-
tion of expression of the estrogen and progesterone hor-
mone receptors and the ErbB-2 receptor kinase,
cytokeratins and the proliferation marker Ki67. This
cohort encompassed a total of 24 tumors over expressing
ErbB-2 (7 cases classified as luminal B and 17 cases of the
HER-2 subtype), and a total of 34 ErbB-2 negative tumors
(8 luminal B, 16 luminal A cases and 10 triple negative
tumors). Non breast tumors were represented by a
selected panel of 18 malignancies including thyroid,
colon, ovarian and renal carcinomas. Experimental breast
tumors developed during a period of 22 and 30 weeks in
transgenic Balb/c mice carrying the rat HER-2/neu onco-
Kurzik-Dumke et al. Journal of Translational Medicine 2010, 8:58
/>Page 3 of 13
gene [23] were kindly provided by Prof. Guido Forni
(Dept. of Clinical and Biological Sciences, Univ. of Turin,
Italy) and processed like the human specimens.
Antisera
Rabbit anti-hTid antiserum recognizing both the human
and the mouse Tid proteins was generated, purified and
characterized as previously described [6,7,13]. The rabbit
polyclonal antiserum (AO 485) to human ErbB-2 cross
reacting with the rat receptor was obtained from DAKO
Cytomation (Denmark). The polyclonal antibody raised
in chickens (GTX14027) recognizing the rat receptor was
obtained from Gene Tex, Inc. (S. Antonio, TX. USA).
Alexa fluor 594-labelled goat anti-rabbit IgG antiserum
was purchased from Molecular Probes (Eugene, OR.
USA). Fluorescein (FITC)-labelled rabbit anti chicken
IgG was purchased from Sigma (St. Louis MA, USA).
Immunohistochemical staining
Indirect immunoperoxidase staining of frozen tissue sec-
tions was performed according to standard procedures
using the Vectastain ABC kit (Vector Labor, Burlingame,
CA). Anti-hTid [6,7,13] was used at a concentration of 10
μg/ml while the anti ErbB-2 antibody (AO485) was
employed as suggested by the manufacturer. Sections
were counterstained using Mayer's hematoxylin. Positive
controls were represented by archival specimens of
known expression of both antigens, while negative con-
trols were represented by sections incubated with normal
rabbit immunoglobulins or isotype matched mouse
imnunoglobulins. The evaluation of the staining was per-
formed as follows: htid was scored negative when cyto-
plasmic staining was absent or very weak and positive
when a homogeneous granular cytoplasmic staining,
ranging from moderate (+) to strong (2+/3+), was
detected. ErbB-2 expression was established on the basis
of a strong 3+ cell membrane staining or a 2+ staining
intensity with a positive FISH assay [24]. Scoring of the
expression of the antigens investigated was performed
independently by two pathologists. Double immunofluo-
rescence staining of breast tumors developed in HER-2/
neu transgenic mice was performed by incubating the
tumor sections at first with the rabbit anti-hTid antise-
rum and Texas Red labelled anti rabbit IgG. After block-
ing with decomplemented normal rabbit serum at a
dilution of 1:100, 30 min, the sections were stained with
chicken anti rat HER-2 antibody and the FITC-labelled
rabbit anti chicken IgG. Sections were evaluated employ-
ing a Leica DMIRE2 microscope equipped with a Leica
DFC 350FX camera and elaborated by a Leica FW4000
deconvolution software (Leica, Solms, Germany).
RNA isolation, RT-PCR, and quantitative real-time RT-PCR
To generate cDNAs corresponding to the transcripts
encoded by the target genes investigated extraction of
total cellular RNA was performed using the Oligotex
RNeasy Mini Kit (Qiagen, Hilden, Germany) and reverse-
transcription with Superscript II (Invitrogen, Heidelberg,
Germany). The integrity of the cDNAs generated was
investigated by amplification of p53 transcripts, using the
primers 5'-CGT GAG CGC TTC GAG ATG TCC G-3'
(sense) and 5'-CCT AAC CAG CTG CCC AAC TGT
AG-3' (antisense) as described previously [13]. For end
point RT-PCR analysis of individual transcripts 0.5 μl
first-strand cDNA were amplified using the QuantiTect
SYBR Green PCR Kit (Qiagen), transcript-specific oligo-
nucleotides (300 nM each) and 1U HotStarTaq DNA
polymerase (Qiagen) in a 30 μl reaction, 40 cycles, in
accordance with the manufacturer's instructions. Each
PCR reaction was performed in triplicates using the fol-
lowing reaction conditions: initial denaturation/activa-
tion for 15 minutes at 95°C, 30 seconds at 94°C, 30
seconds of annealing, and 30 seconds at 72°C. A tem-
plate-free negative control was included in each experi-
ment. To amplify fragments corresponding to a defined
htid splice-form (1,13), the following primer combina-
tions were used: htid-L, 5'-GTT GAC ATT CAA TCA
AGC TGC-3'(sense) and 5'-CTG GGA TAT CAT GAG
GTA AAC-3'(antisense), htid-I, 5'-GTT GAC ATT CAA
TCA AGC TGC-3'(sense) and 3'-CCA GTG GAT CTT
TTT CCA GAG -3'(antisense) and htid-S, 5'-CAG CCT
CAG GAA GAA ACC ATC-3'(sense) und 5'-GGG ATC
GTC ACG TTG ATC GTC-3' (antisense) according to
reaction conditions as described previously [13]. For the
amplification of an HER-2 [16] specific fragment, encom-
passing nt 1850-2157 of the corresponding cDNA (NCBI
reference sequence NM_001005862.1; http://
www.ncbi.nlm.nih.gov/sites/entrez) the primers 5'-CTC
TGC TTC GTG CAC ACG GTG-3' (sense) and 5'-CAG
GTC ACT GAG CCA TTC TGG-3' (antisense) (Eurofins
MWG Operon, Ebersberg, Deutschland) were used at an
annealing temperature of 60°C. The relative expression
level (ΔCt) of a specific transcript was calculated with
respect to the internal standard hypoxanthine guanine
phosphoribosyl transferase (HGPRT) used in each reac-
tion run to normalize variances in the quality of RNA,
sample loading and the amount of input cDNA. Amplifi-
cation of HGPRT was performed using the primers 5'-
TGA CAC TGG CAA AAC AAT GCA-3' (sense) and 5'-
GGT CCT TTT CAC CAG CAA GCT-3' (antisense) at
an annealing temperature of 62°C. Quantitative real-time
RT-PCR analysis was performed using the ABI PRISM
7300 Sequence Detection System instrument and soft-
ware (Applied Biosystems). The analysis of relative target
expression was performed using the 2
-ΔΔCt
method [19].
To monitor DNA synthesis the fluorescent dye SYBR-
Green was used. The cycle number at which the amplifi-
cation of the transcript of interest was first detected is
referred to as the cycle threshold, the Ct value. The
Kurzik-Dumke et al. Journal of Translational Medicine 2010, 8:58
/>Page 4 of 13
increase in the fluorescence signal depends on the
amount of the DNA in the starting PCR sample. The
higher the DNA concentration, the faster a significant
increase in fluorescence resulting in a low Ct value. The
Ct value is proportional to the logarithm of the initial
amount of the target DNA in the sample. The relative
concentration of one target with respect to another is
reflected in the difference of the cycle number, the ΔCt
value. In this study the differences in the Ct values
between the target gene/splice form investigated (X) and
the reference (R, here HGPRT) are referred to as ΔCt val-
ues and were calculated as follows: ΔCt(X) = Ct(X) -
Ct(R). A ΔCt = 0 indicates a ratio of 1 between the target
and the reference (1 = 2
0
= 2
-(ΔCt)
). The factor 2 in the for-
mula describes doubling of the fluorescence, the Ct value,
at each cycle during the exponential phase of the PCR
with 100% efficiency (E). Since E is determined by the RT-
PCR conditions, the E values were optimized for each tar-
get gene investigated prior to the sample analysis. For the
ΔCt calculation to be valid, the efficiency of amplification
of both the target and the reference must be approxi-
mately equal. The E values determined were as follows:
E
HGPRT
= 0,955; E
htid-L
= 0,923; E
htid-I
= 0,943; E
htid-S
=
0,926; E
erbB-2/her-2
= 0,906. The E values were calculated
using the equation: E = 10
(-1/slope)
. The Ct values versus
cDNA concentration input were plotted to calculate the
slope (mean ± SD). Regressions were calculated using the
graphad prism software as described previously [13]. The
expression levels of the transcripts investigated in tumor
samples were normalized to the respective normal tissues
using ΔΔCt calculation as described previously [13]. The
reported RNA expression levels represent the mean val-
ues (n = 3) ± standard deviation (SD). After standardiza-
tion of both tumor and normal samples with respect to
HGPRT, the change, ΔΔCt, in the expression levels of the
target transcripts in the tumor sample as compared to
normal was calculated as follows: ΔΔCt = ΔCt
tumor sample
-
ΔCt
normal sample
.
Statistical examination
Statistical evaluation of the RT-PCR data was performed
using the one-sided Student's t-test.
For the statistical analysis of the correlation of the
expression of the two target antigens determined by
immunohistochemistry the Fischer's exact test was
employed.
Results
The expression of htid and HER-2 RNA is altered in human
breast tumors
The htid tumor suppressor gene encodes three splice
forms - htid-L, htid-I and htid-S - generated by alterna-
tive splicing [1,7,13]. To determine the splice variant spe-
cific expression of the distinct htid transcripts in normal
breast epithelium and in breast cancers, we performed
quantitative RT-PCR analysis (Table 1 and 2). In the con-
text of the suppressive activity of hTid proteins on ErbB-2
[15] the samples were further investigated for the expres-
Table 1: Quantification of the relative amounts of the three htid splice forms L, I and S, and the HER-2 transcript in human
normal breast epithelium
Target gene/splice form htid-L htid-I htid-S erbB-2
Samples/ΔCt-value 4,11 1,54 15,82 -2,75
3,17 0,59 15,38 -1,96
3,53 0,57 13,69 -2,26
3,78 0,84 14,95
4,12 1,51 14,87
average ΔCt (=100%) 3,74 1,01 14,94 -2,32
± 0,3 (8,00%) ± 0,4 (39,61%) ± 0,5 (3,35%) ± 0,29 (12,50%)
Amount of target:
2
-ΔCt
0,07 0,50 3.18 x 10
-5
4,99
The ΔCt value is determined by substracting the HGPRT (endogenous reference) Ct-value from the Ct value of the target investigated: ΔCt =
Ct (target) - Ct (HGPRT); Standard deviation (SD): , n = 3, was calculated for the average ΔCt (100%); The relative concentration
of the target (amount of target), 2
-ΔCt
, is calculated for the average ΔCt values.
()
1
n
cc
−
∑
()
1
n
cc
−
∑
Kurzik-Dumke et al. Journal of Translational Medicine 2010, 8:58
/>Page 5 of 13
Table 2: Relative expression of the htid splice forms L, I, S and the HER-2 transcript in human breast cancer
Sample12345678
T/N/M/G status 2/1/1/3 1/0/0/3 4/1/x/2 3/1/1/3 2/1/1/3 2/1/1/3 1/2/0/2 2/1/0/3
Target
gene
htid-L
ΔCt 4,68 3,32 2,77 5,81 4,38 4.08 2,08 2,57
ΔΔCt 0,94 -0,43 -0,98 2,07 0,64 0,34 -1,66 -1,18
2
-ΔΔ
Ct
0,52 1,35 1,97 0,24 0,64 0,79 3,16 2,27
Rel. expression (%) 52 135 197 24 64 79 316 227
htid-I
ΔCt 1,55 2,99 2,21 2,89 0,77 0,82 1,88 0,35
ΔΔCt 0,54 1,28 1,20 1,88 -0,24 -0,19 0,87 -0,66
2
-ΔΔ
Ct
0,69 0,41 0,44 0,27 1,18 1,14 0,55 1,58
Rel. expression (%) 69 41 44 27 118 114 55 158
htid-S
ΔCt 14,55 15,61 15,34 15,84 13,39 13,43 14,75 14,22
ΔΔCt -0,4 0,67 0,4 0,90 -1,55 -1,51 -0,19 -0,72
2
ΔΔ
Ct
1,32 0,63 0,76 0,54 2,93 2,85 1,14 1,65
Rel. expression (%) 132 63 76 54 293 285 114 165
HER-2 ΔCt 1,63 0,44 0,29 -0,11 0,60 -0,69 -1,11 -2,37
ΔΔCt 3,95 2,76 2,61 2,21 1,72 1,63 1,21 -0,05
2
-ΔΔ
Ct
0,06 0,15 0,16 0,22 0,30 0,32 0,43 1,04
Rel. expression (%) 6 15 16 22 30 32 43 104
Sample9 101112131415
T/N/M/G status 2/0/0/2 1/x/x/2 1/2/0/3 3/1/x/3 4/2/0/3 4/2/0/3 3/4/0/3
Target
gene
htid-L
ΔCt 3,47 3,43 4,08 0,68 3,44 3,89 2,08
ΔΔCt -0,28 -0,31 0,34 -3,06 -0,31 0,15 -1,66
2
-ΔΔ
Ct
1,21 1,24 0,79 8,34 1,24 0,90 3,16
Rel. expression (%) 121 124 79 834 124 90 316
htid-I
ΔCt 2,40 0,06 1,77 0,37 -0,08 0,90 1,28
Kurzik-Dumke et al. Journal of Translational Medicine 2010, 8:58
/>Page 6 of 13
sion of the corresponding transcript. The evaluation of
the amount of the targets investigated was performed
using the comparative Ct/ΔΔCt method (cf. Materials
and Methods). As shown in Table 1 in normal breast epi-
thelium the three htid splice forms are expressed at dis-
tinct levels. The 2
-ΔCt
values (Table 1) indicate highest
expression for the htid-I form (2
-ΔCt
= 0,50) and the low-
est (2
-ΔCt
= 3,18 × 10
-5
) for the htid-S form. Generally, this
expression profile corresponds to that we described pre-
viously for normal colon epithelium [13]. The expression
level of the HER-2 transcript (2
-ΔCt
= 4,99) in the breast
epithelium samples which were defined as normal is
higher (tenfold) as compared to the htid-I RNA (Table 1).
As shown in Table 2, all breast tumors investigated
express aberrant RNA levels of all htid splice forms as
compared to normal tissue, independently from the level
of the HER-2 transcript detected. With regard to the rela-
tive change of expression of the latter in the tumor sam-
ples as compared to normal the tumors can be divided
into three groups. Whereas the first group is character-
ized by HER-2 levels ranging between 6-43% (samples 1-
7) as compared to normal (100%), the third class, consist-
ing of samples 14 and 15, shows drastic elevation (1048%
and 1593%). The second group (samples 9-13) show slight
to moderate increase of HER-2 expression ranging from
124% to 211%. One case, 8, shows similar HER-2 level as
that detected in normal sample (Table 1 ). Comparing the
TNMG status of the samples and the htid expression pro-
files implicates that aspects of tumor progression such as
tumor extension (T), lymph node affection (N) and loss
of differentiation (G) are accompanied by elevation of
htid-L level (Table 2, cases: 3,7,8,12,13,15) ranging from
124 to 834%. In contrast, poorly differentiated and undif-
ferentiated cases are characterized by decrease of htid-L
(Table 2, cases: 1, 4-6 and 11). With regard to the expres-
sion of the htid-I form, the cases can be divided into two
groups, those which show lower expression as compared
to normal (Table 2, cases: 1-4, 7, 9, 11, 14, 15) and those
with levels elevated up to twofold (Table 2, cases: 5, 6, 8,
10, 12 and 13). Similarly, htid-S expression in the tumors
is either down regulated in a range from 76% to 16%,
(Table 2 , cases: 2-4, 9 und 14) or increased in a range
from 114% to 380% (Table 2, cases: 1, 5-8, 10-13 and 15).
With respect to the two latter forms, htid-I and htid-S, no
correlation to the TNMG status is recognizable. Gener-
ally, the deregulation of the expression levels of the single
htid transcripts leads to a collapse of the concentration
ratio among the single htid forms and between the htid
variants and the HER-2 transcript.
ΔΔCt 1,39 -1,06 0,76 -0,64 -1,09 0,11 0,27
2
-ΔΔ
Ct
0,38 2,08 0,59 1,56 2,13 0,93 0,83
Rel. expression (%) 38 208 59 156 213 93 83
htid-S
ΔCt 15,91 13,02 13,90 13,84 13,32 17,55 13,51
ΔΔCt 0,97 -1,92 -1,04 -1,10 -1,62 2,61 -1,43
2
-ΔΔ
Ct
0,51 3,80 2,06 2,14 3,07 0,16 2,70
Rel. expression (%) 51 380 206 214 307 16 270
HER-2 ΔCt -2,63 -2,97 -3,00 -3,23 -3,40 -5,71 -6,31
ΔΔCt -0,31 -0,65 -0,68 0,91 -1,08 -3,39 -3,99
2
-ΔΔ
Ct
1,24 1,57 1,60 1,88 2,11 10,48 15.93
Rel. expression (%) 124 157 160 180 211 1048 1593
The samples are sorted according to the increase of HER-2 expression. The average ΔCt values (n=3) are presented. The calculation of ΔΔCt
involves substraction by the ΔCt calibrator value (normal sample), ΔΔCt = ΔCt (tumor sample) - ΔCt (normal sample). The SD of ΔΔCt is the
same as the SD of the ΔCt. The ΔCt values of both the tumor and normal samples are standardized to HGPRT used as endogenous control.
The values defined as increase of expression represent the relative (rel.) change/increase in expression of the defined target as compared to
normal sample and are calculated as follows: 2
-ΔΔCt
× 100%. T, tumor extension: T1, to submucosa; T2, to muscle layer; T3, to subserosa; T4, to
serosa. N, lymph node affection; M, metastasis; G, grading: G1, well differentiated; G2, moderately differentiated; G3, poorly differentiated; x,
not defined.
Table 2: Relative expression of the htid splice forms L, I, S and the HER-2 transcript in human breast cancer (Continued)
Kurzik-Dumke et al. Journal of Translational Medicine 2010, 8:58
/>Page 7 of 13
Expression of htid in breast tumors as revealed by
immunohistochemistry
To obtain an overall assessment of htid expression in nor-
mal and transformed mammary epithelium we submitted
to immunohistochemical analysis morphologically nor-
mal breast tissue (3 cases), random selected infiltrating
ductal carcinomas (75 cases) and metastatic lesions (30
cases). Staining of these substrates with the affinity puri-
fied hTid antiserum [6,7,13] demonstrated focal expres-
sion of the chaperone molecule only in the epithelial
component of morphologically normal breast (Figure 1A,
insert). In contrast about 43% of primary and 30% of met-
astatic tumors (including lymphonodal and extra-nodal
lesions) were characterized by positive staining ranging
from moderate to intense staining.
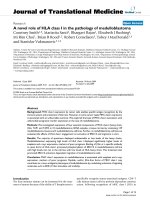
In the context of the potential association of htid
expression with the biology of human breast cancers of
different subtype the immunohistochemical analysis
revealed elevated htid expression in 81% of the luminal A
type tumors (Figure 1A), in 20% of the cases of the lumi-
nal B type over expressing ErbB-2 and in 18% of tumors
diagnosed as the HER-2 subtype (not shown). Tumors of
the triple negative type showed positive staining for anti-
Tid in 40% of the cases investigated (Figure 1B-D).
Correlation between htid and ErbB-2 expression in breast
and non-breast tumors over expressing the ErbB-2 receptor
as revealed by immunohistochemistry
In view of the above findings which are consistent with
the in vitro findings of hTid oncosuppressive activity on
ErbB-2 [15], we focussed our further investigation on the
analysis of the in vivo correlation between htid and HER-
2 expression. Regarding the expression of the two target
genes the following patterns were compared: double posi-
tive (HER-2 +/tid +), double negative (HER-2 -/tid -) and
positive/negative (HER-2 +/tid -; tid +/HER-2 -). Speci-
mens characterized by lack or faint expression of the tar-
Figure 1 Representative expression patterns of htid in normal mammary epithelium and in primary breast tumors of different subtype. In-
direct immunoperoxidase staining using the Vectastain ABC Kit was performed according to manufacturer's suggestions using the polyclonal rabbit
anti-hTid (6,7,13). Nuclei were counterstained with Mayer's hematoxylin. While htid is expressed at low levels in the normal breast epithelium (A: insert)
its expression is significantly elevated in the luminal A (A) and B (B) tumor type. In contrast, htid is barely detectable in tumors of the HER-2 (C) and the
triple negative (D) subtype. (Original magnification: 250x).
Kurzik-Dumke et al. Journal of Translational Medicine 2010, 8:58
/>Page 8 of 13
get antigens were defined as negative. Samples showing
moderate (+) to strong (2+/3+) signals by staining them
with anti hTid antibodies and 3+ or 2+/Fish+ stain using
antibodies against ErbB-2 were defined as positive. In
that context we assayed comparatively the expression lev-
els of the proteins encoded by the two target genes in 24
primary tumors over expressing the receptor (17 of the
HER-2 and 7 of the luminal B subtype) and 34 ErbB-2
negative tumors (16 luminal A, 8 luminal B and 10 of the
triple negative subtype) as well as in metastatic lesions
over expressing the TRK receptor by staining with anti-
Tid [6,7,13] and antibodies against ErbB-2. The results of
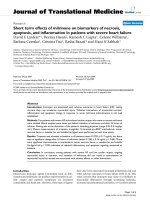
this analysis are summarized in Table A3A and Figure
2A-D. They clearly demonstrate that the expression of
the two targets investigated is inversely correlated in both
primary (p < in 0,0001) and in metastatic (p < 0.023)
mammary tumors (not shown). Since ErbB-2 over
expression may occur also in other epithelial cancers [18],
we performed a comparative staining of HER-2 and htid
in non mammary carcinomas characterized by elevated
levels of ErbB-2 (10 cases) and in cancers displaying low
levels of the receptor (8 cases). This study (Table B3B)
also yielded a highly significant inverse correlation (p <
0,007) with respect to the expression levels of the two
tumor genes investigated (Figure 2E, F).
Correlation between htid and ErbB-2 expression in breast
tumors induced in Her-2/neu transgenic mice
As described above, the inverse correlation of the expres-
sion profiles of the two proteins in human breast tumors
and non mammary malignancies provides an in vivo
proof for the oncosuppressive activity of htid on ErbB-2
described in vitro [15]. Furthermore, since the inverse
relationship is highly significant in diverse tissues, this
functional link is not cell specific, and therefore of gen-
eral biological importance. Next, we asked whether the
inverse correlation is evolutionarily conserved in the
mouse. To answer this question we employed the trans-
genic mice model of Her-2/neu induced breast tumors
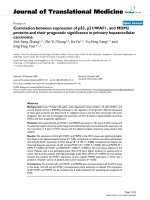
[23]. We stained early (22 weeks) and late (30 weeks)
breast tumors generated in transgenic mice carrying the
rat Her-2/neu oncogene. As shown in Figure 3A, staining
of the early tumors with the hTid [7,13] antiserum
revealed homogenous (1+) cytoplasmic expression. Dif-
ferently, using the anti-ErbB-2 antiserum cross reacting
with the murine receptor resulted in a faint stain of the
cytoplasm and rarely in staining of the membrane of the
tumor cells (Figure 3B). In the more advanced 30 weeks
tumors the staining patterns changed with regard to both
the expression level and distribution. In these lesions, the
hTid expression was heterogeneous with alternating areas
of moderate to intense (2+) cytoplasmic stain (Figure 3C).
The expression of ErbB-2 also appeared heterogenous
with only discrete areas of the tumor displaying an
intense (2+) staining often cell membrane associated
(Figure 3D). This result further suggested that the inverse
correlation of the expression levels of the two molecules
is indeed detectable also in experimental tumors raised in
mice carrying the rat Her-2/neu oncogene. In order to
conclusively prove this issue, we submitted the more
advanced tumors to double staining using anti-hTid
[5,13] and the chicken antibody recognizing the murine
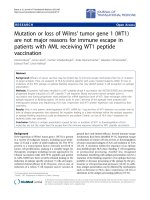
TRK receptor molecule. As shown in Figure 4, tumor
areas characterized by intense membrane ErbB-2 expres-
sion (A) display significantly lower htid level (B, C), thus,
demonstrating the inverse correlation of the expression of
the two tumor relevant molecules and implying their
functional link.
Discussion
The understanding of the mechanism responsible for the
in vivo oncosuppressive action of htid in human tumori-
genesis is of biological relevance in view of the multiple
molecular interactions of the proteins it encodes [7-
15,25,26]. The ability of the hTid proteins to interact with
distinct cancer related molecules, mediating via linked
signal transduction networks diverse cellular processes,
suggests that the deregulation of their expression may
affect simultaneously diverse cellular functions. Further-
more, the identification of the htid encoded proteins as
components of multi-component complexes suggests
that their activity is likely to be associated with mecha-
nisms determining the sequential and temporarily deter-
mined assembling of these complexes in the cell and their
cellular topology. This is consistent with the function of
molecules defined as chaperones and their molecular
assistants known as co-chaperons. The Tid proteins
[1,2,6,7,13] are indeed members of the DNAJA3 family
Table 3: The expression of hTid and ErbB-2 is inversely correlated in primary breast cancer (A) and in non mammary
tumors (B).
A
1
hTid (+) hTid (-) B
2
hTid (+) hTid (-)
ErbB-2 (+) 2* 22* ErbB-2 (+) 2* 8*
ErbB-2 (-) 28* 6* ErbB-2 (-) 8* 0*
*: number of cases;
1
: p< 0,0001;
2
: p< 0,007;
Kurzik-Dumke et al. Journal of Translational Medicine 2010, 8:58
/>Page 9 of 13
encoding Hsp70/Hsc70 co-chaperone molecules [4,5].
The understanding of their role in the spatial and tempo-
ral organization of either active or silent protein com-
plexes is of relevance in the context of both general
developmental processes and, especially, tumor biology
[6-15]. Regarding the latter the knowledge of the biologi-
cal context these molecules are involved in may have an
essential impact for the identification of novel causal can-
cer therapies.
Data are available indicating that the cytosolic hTid-
proteins L and I mediate cellular tumor-related processes
such as proliferation, differentiation and migration by
modulating/stabilizing signalling pathways driving these
processes [6,7,9-14]. Generally, two modes of action of
Figure 2 Comparative analysis of htid and HER-2 expression in breast and non breast tumors. The detection of htid was performed as described
in the legend to Figure 1. The ErbB-2 oncogene was detected using a monoclonal anti ErbB-2 antibody (AO485). Weak htid expression is detectable
in HER-2 over expressing breast tumors of the luminal B (A, B) and HER-2 (C, D) subtype as well as in a renal clear cell carcinoma (E, F). (Original mag-
nification: 250×).
Kurzik-Dumke et al. Journal of Translational Medicine 2010, 8:58
/>Page 10 of 13
the Tid proteins can be discerned to date: i) interaction
with cytosolic molecules, such as the APC tumor sup-
pressor [7,13], a central component of the Wingless/Wnt
pathway and the E-Cadherin mediated signalling or the
Inhibitor of IKB in the NFκB signalling [11], crucial for
driving the expression of regulators of cell cycle control,
or ii) binding to receptors mediating the activation of sig-
nalling pathways, e.g. Ptc [6,7] and ErbB-2 [15]. With
regard to the latter the regulatory functions of the cytoso-
lic htid splice forms hTid-L and hTid-I have been shown
to participate in the degradation of the receptor mediated
by the Hsp70/CHIP ubiquitin ligase complex [15]. Inter-
estingly enough, both hTid forms, L and I, are suggested
to be equally capable to down regulate the over expres-
sion of the ErbB-2 receptor and to decrease its oncogenic
signalling in human breast cancer cell lines in which the
co-chaperone molecule was over expressed [15]. This
observation strongly suggests that the ErbB-2 concentra-
tion level is relevant in activating the suppressive func-
tion of the two hTid proteins [15]. Furthermore, it raises
the question whether the binding of the two hTid forms
with ErbB-2 is functionally equal also under physiological
circumstances. We asked these questions during the
study presented here. Functional equality under physio-
logical conditions suggests, as a result, that these two
proteins may complement each others' function(s) under
peculiar circumstances, e.g. pathological states.
Overall, the in vivo data of the present study further
support the growing evidence that the anticancer activity
of the hTid proteins occurs through the interference with
multiple oncogenic pathways by binding and modifying
functions of key molecules maintaining intracellular sig-
nalling. The ErbB-2 TRK represents one of these mole-
cules.
As revealed by the RT-PCR analysis, the three htid
splice forms are differentially expressed in normal breast
epithelium. Their concentration levels are in this tissue
similar to those we described previously for colon epithe-
lium [13], the I form with the highest expression level and
the S form characterized by very low concentration. This
Figure 3 Comparative analysis of htid and HER-2/neu expression in breast tumors arising in transgenic Balb/c mice carrying the rat HER-2/
neu oncogene revealed inverse correlation between the expression levels of the investigated targets. The detection of mtid was performed
as described in the legend to Figure 1. ErbB-2 was detected using the monoclonal anti ErbB-2 antibody (AO85) (cf. Figure 2) cross reacting with the
rat molecule. While early tumors, 22 week old, display high tid (A) and low HER-2/neu levels (B), those harvested at 30 weeks are characterized by a low
tid expression (C) in contrast to high HER-2/neu (D) levels. (Original magnification: 250×).
Kurzik-Dumke et al. Journal of Translational Medicine 2010, 8:58
/>Page 11 of 13
suggests that under normal physiological conditions the
concentration of the three htid splice forms is precisely
regulated and that this mechanism is essential for the
diverse functions the single molecules are maintaining in
the cell. Previously we showed that the expression profile
changes in epithelial tumors such as basal cell carcinomas
(BCCs) [6] and colon cancers [13]. As shown here, this is
also true for human breast tumors which are character-
ized by alteration of expression of all three htid forms
resulting at least in a collapse of the concentration ratio
between them. Since the hTid proteins are highly promis-
cuous [6-15] this phenomenon must, as a result, drasti-
cally affect the homeostasis of the cellular functions these
complexes are involved in. Thus, the deregulation of htid
leads independently of the causative event to severe cellu-
lar derangements. Additionally to this general conclusion
a further more specific observation, concerning the
aforementioned in vivo functional equality of the two
forms L and I, can be driven from the present study. The
RT-PCR data demonstrate up-regulation of expression of
the hTid-L form in most of the non metastasizing tumors,
whereas poorly differentiated and undifferentiated cases
with lymph node metastases show a decrease of the level
of this form up to 24% of the normal (100%) level. This
pattern which suggests that hTid may exert oncosuppres-
sive activity which breaks down during tumor progres-
sion is consistent with the role postulated for the L and I
forms [15] by in vitro studies employing the ErbB-2 over
expressing cell lines. Furthermore, the RT-PCR data indi-
cate that the hTid-L oncosuppressive action may be of
general importance being not limited to ErbB-2 over
expressing malignancies. In view of this, one can hypoth-
esize at the present the following model for the activation
of this security/emergency mechanism: if the concentra-
tion of a molecule driving the tumorigenic process, e.g.
ErbB-2, riches a threshold level hTid-L expression is
enhanced. This rescuing mechanism however is time lim-
ited as hTid expression declines during tumor progres-
sion. This hypothesis raises questions concerning the
mechanisms regulating the physiological and emergency
expression of htid. The answer to this question is the sub-
ject of our present investigations. So far we can state that
consistent with the molecular promiscuity of the hTid
proteins distinct cell specific and cell status dependent
regulatory mechanisms are involved in these processes.
As previously mentioned, the functional equality of L and
I under physiological circumstances would suggest that
these two forms may complement each others function
under specific circumstances. Under the assumption that
this is true a shift of the concentration ratio of the two
forms could be expected as a consequence of their onco-
suppressive/protective function on the tumorigenic tar-
gets. Though this hypothesis is from the mechanistic
point of view very attractive, the analysis of the correla-
tion of the expression levels of the two forms L and I in
the tumor samples do not support it at present. Decrease
in the level of the L form do not correspond to increase of
the concentration of the I form and vice versa. Thus, to
solve the problem of the functional equality of the two
Figure 4 Photographs of simultaneous staining of 30 week old
breast tumors arising in HER-2/neu transgenic mice illustrating
that over expression of HER-2/neu correlates down regulation of
htid. ErbB-2 was detected using a polyclonal chicken anti rat ErbB-2
and a FITC labelled secondary antibody. Tid was detected using the
rabbit polyclonal anti hTid antibody [6,7,13] and a Texas Red labelled
secondary antibody. The tumor cells over expressing ErbB-2 (A, arrow-
head) are characterized by low tid expression (B, arrowhead; cf. Figure
3). In C an overlay of the photographs shown in A and B is presented.
Kurzik-Dumke et al. Journal of Translational Medicine 2010, 8:58
/>Page 12 of 13
hTid forms L and I further investigations using adequate
in vivo methodology are necessary. With regard to the
htid splice forms I and S, which expression levels are also
changed in nearly all tumor samples investigated, no cor-
relation with the TNMG status and the HER-2 level could
be found.
The immunohistochemical analysis described in this
study provided additional interesting findings. It showed
that the changes in the expression profiles of the targets
investigated during tumor progression of experimental
tumors are not ubiquitous but rather hot-spot like. This is
consistent with the fact that functional complexes includ-
ing the Tid proteins are built in the cells sequentially and
are topologically determined as we discussed previously
[6,7]. Most importantly, the data provide in vivo evidence
that htid is a potential modulator of ErbB-2 signalling in
both breast and non-breast tumors over expressing the
kinase. Furthermore, since the inverse correlation of the
expression levels of the two genes is highly significant in
human breast cancers as well as in experimental breast
tumors the functional relationship between the two tar-
gets is conserved. Furthermore, the transgenic mice ani-
mal model may be suitable to in vivo dissect the
oncosuppressive activity of the hTid proteins on ErbB-2
function. In view of the association of ErbB-2 over
expression with poor prognosis in breast cancers the elu-
cidation of these phenomena is of particular biological
interest also in the context of the pharmacological rele-
vance of ErbB-2 regulation, which, possibly, could be
modulated via tuning of expression of the single htid
splice forms. With regard to the latter reduction of htid
expression can in fact render cancer cells resistant to
apoptosis induced by a wide spectrum of stimuli includ-
ing TNF-α [25] and increase their migratory potential
[26].
The variety of biological processes the EGFR family
members regulate results from the differential signalling
they mediate by building both homo and diverse het-
erodimers between the family members responding to
distinct ligands [16,27-29]. ErbB-2 is the favourite partner
of all other EGFR receptors [29]. The ErbB-2/ErbB-3 het-
erodimer is a high affinity receptor for neuregulins
endowed with potent oncogenic activity [28]. In view of
this the hTid proteins can also be considered as potential
EGFR and/or HER-3 binding partners and therefore play-
ers in the signalling they induce. In this context a prelimi-
nary comparative expression analysis of hTid, EGFR and
ErbB-3 we have conducted in triple negative breast
tumors and in cutaneous melanoma (data not shown)
respectively also suggests an inverse correlation between
the expression levels of hTid and the two receptors, thus,
indicating that htid functional relation may indeed
encompass other members of the EGFR family. Since
these receptors control different developmental pro-
cesses their activation/deactivation requires a fine tuning.
The on status is activated by paracrine and autocrine sig-
nals engaging one or more receptors [30]. The off status is
strengthened by a number of feedback inhibitors [30]. So
far four ErbB-2 inhibitors have been described, namely,
LRIG1 [31], SOCSS4 and 5 [32] and RALT/MIG6 [33,34].
While the first three inhibitors interfere temporary with
EGFR activity by enhancing its ubiquitination, RALT is
endowed with the ability to block the ErbB RTK signal-
ling by its inception [33]. Our in vivo results suggest hTid-
L as a further modulator of ErbB-2 activity in human
tumors of epithelial origin. In accordance with the
reported molecular analysis in vitro [15] it can be postu-
lated that this may occur via mechanisms similar to those
described for the negative feedback inhibitors LRIG1 and
SOCS4 and 5. This hypothesis has to be confirmed using
appropriate experimental approaches.
Conclusions
In summary, the presented data provide in vivo evidence
for htid function as a negative regulator of ErbB-2 activ-
ity. The inverse correlation of the expression levels of the
two genes is highly significant in human breast and non-
mammary cancers, and in experimental tumors raised in
transgenic mice carrying the rat HER-2/neu oncogene.
Thus, the functional relationship between the two targets
is tissue independent and evolutionarily conserved.
Competing interests
The authors declare that they have no competing interests.
Authors' contributions
UKD designed and evaluated the RT-PCR experiments, generated and purified
the anti-hTid antibody and drafted the manuscript. MH determined htid
expression via RT-PCR. MRN performed the immunohistochemistry of human
and murine carcinomas. MK determined HER-2 expression via RT-PCR. PGN
designed and analyzed the immunohistochemical data and drafted the manu-
script. All authors read and approved the final manuscript.
Acknowledgements
This work was supported in part by the German Cancer Society (grant 10-1695-
Ku2 to UK-D) and by Associazione Italiana Ricerca sul Cancro (AIRC) (grant to
PGN).
We would like to thank Prof. Forni, Dept. of Clinical and Biological Sciences, Uni-
versity of Turin, Italy, for providing the breast tumors developed in transgenic
Balb/c mice carrying the rat HER-2/neu oncogene and Dr. Ö Türeci, Experimen-
tal and Translational Oncology III, University Medical Center, Johannes Guten-
berg University, Mainz, Germany, for providing the tissue samples used for RT-
PCR analysis.
Author Details
1
Institute of Medical Microbiology and Hygiene, Comparative Tumor Biology
Group, University Medical Center, Johannes Gutenberg University, Obere
Zahlbacher Str. 63, 55131 Mainz, Germany,
2
Inst. Molecular Biology and
Pathology CNR, Rome, Italy,
3
Experimental and Translational Oncology III,
University Medical Center, Johannes Gutenberg University, Obere Zahlbacher
Str. 63, 55131 Mainz, Germany and
4
Immunology Laboratory, "Regina Elena"
National Cancer Institute, Via delle Messi d'Oro 156, 0158 Rome and CIMBO
Laboratories, "G.d'Annunzio" University, Chieti, Italy
Received: 9 April 2010 Accepted: 17 June 2010
Published: 17 June 2010
This article is available from: 2010 Kurzik-Dumke et al; licensee BioMed Central Ltd. This is an Open Access article distributed under the terms of the Creative Commons Attribution License ( which permits unrestricted use, distribution, and reproduction in any medium, provided the original work is properly cited.Journal of Tr anslational Medi cine 2010, 8:58
Kurzik-Dumke et al. Journal of Translational Medicine 2010, 8:58
/>Page 13 of 13
References
1. Yin X, Rozakis-Adcock M: Genomic organization and expression of the
human tumorous imaginal disc (TID1) gene. Gene 2001, 278:201-210.
2. Kurzik-Dumke U, Gundacker D, Rentrop M, Gateff E: Tumor suppression
in Drosophila is causally related to the function of the lethal(2)tumorous
imaginal discs gene, a dnaJ homolog. Dev Genetics 1995, 16:64-76.
3. Ohtsuka K, Hata M: Molecular chaperone function of mammalian Hsp70
and Hsp40- review. Int J Hyperthermia 2000, 16:231-2452.
4. Qiu X-B, Shao Y-M, Miao S, Wang L: The diversity o the DnaJ/Hsp40
family, the crucial partners for Hsp70 chaperones. Cell Mol Life Sci 2006,
63:2560-2570.
5. Vos MJ, Hageman J, Carra S, Kampinga HH: Structural and functional
diversities between members of the human HSPB, HSPH, HSPA and
DNAJ chaperone families. Biochemistry 2008, 47:7001-7011.
6. Canamasas I, Debes A, Natali PG, Kurzik-Dumke U: Understanding
Human Cancer Using Drosophila: Tid47, a cytosolic product of the
DnaJ-like tumor suppressor gene l(2)tid, is a novel molecular partner of
Patched related to skin cancer. J Biol Chem 2003, 278:30952-30960.
7. Kurzik-Dumke U, Czaja J: Htid-1, the human homolog of the Drosophila
melanogaster l(2)tid tumor suppressor, defines a novel physiological
role of APC. Cellular Signaling 2007, 18:1973-1985.
8. Schilling B, De-Medina T, Syken J, Vidal M, Münger K: A novel human
DnaJ protein, hTid- 1 homolog of the Drosophila tumor suppressor
protein Tid56, can interact with the human papillommavirus type 16
E7 oncoprotein. Virology 1998, 247:74-85.
9. Sarkar S, Pollack BP, Lin K-T, Kotenko SV, Cook JR, Lewis S, Pestka S: HTid-1,
a human DnaJ protein, modulates the interferon signalling pathway. J
Biol Chem 2001, 276:49034-49042.
10. Cheng H, Cenciarelli H, Shao Z, Vidal M, Parks WP, Pagano M, Cheng-Mayer
C: Human T cell leukaemia virus type 1 Tax associates with a molecular
chaperone complex containing hTid-1 and Hsp70. Current Biol 2001,
11:1771-1775.
11. Cheng H, Cenciarelli C, Tao M, Parks WP, Cheng-Mayer C: HTLV-1 Tax-
associated hTid-1, a human DnaJ protein, is a repressor of IκB Kinase β
subunit. J Biol Chem 2002, 277:20605-20610.
12. Bae M-K, Jeong J-W, Kim S-H, Kim S-Y, Kang YJ, Kim D-M, Bae S-K, Yun I,
Trentin GA, Rozakis-Adcock M, Kim K-W: Tid-1 interacts with the von
Hippel-Lindau protein and modulates angiogenesis by destabilization
of HIF-1α. Cancer Res 2005, 65:2520-2525.
13. Kurzik-Dumke U, Hörner M, Czaja J, Nicotra MR, Simiantonaki N, Koslowski
M, Natali PG: Progression of colorectal cancers correlates with
overexpression and loss of polarization of expression of the htid-1
tumor suppressor. Int J Mol Med 2008, 21:19-31.
14. Liu H-Y, MacDonald JIS, Hryciw T, Li Ch, Meakin SO: Human Tid1
associates with TRK receptor tyrosine kinases and regulates neurite
outgrowth in NNR5-TRKA Cells. J Biol Chem 2005, 7:19461-19471.
15. Kim S-W, Chao T-H, Xiang R, Campbell MJ, Fearns C, Lee J-D: Tid1, the
human homoloque of a Drosophila tumor suppressor, reduces the
malignant activity of ErbB-2 in carcinoma cells. Cancer Res 2004,
64:7732-7739.
16. Citri A, Yarden Y: EGF-ERBB signalling: towards the system level. Nature
Rev Molec Cell Biol 2006, 7:7505-7516.
17. Slamon DJ, Clark GM, Wong SG, Levin WJ, Ullrich A, McGuire WL: Human
breast cancer: correlation of relapse and survival with amplification of
the HER-2/neu oncogene. Science 1987, 235:177-182.
18. Agus BD, Bunn PA, Franklin W, Garcia M, Ozols RF: HER-2/neu as a
therapeutic target in non small cell lung cancer, prostate cancer and
ovarian cancer. Semin In Oncol 2000, 27:53-63.
19. Livak KJ, Schmittgen TD: Analysis of relative gene expression data using
real-time quantitative PCR and the 2
-ΔΔCt
method. Methods 2001,
25:402-408.
20. Sobin LH, Wittening CH: TNM Classification of Malignant Tumors J Willey-
Liss, Willey Sons, Inc., New York; 2002.
21. Elston CW, Ellis IO: Pathological prognostic factors in breast cancer. I.
The value of histological grade in breast cancer: experience from a
large study with long-term follow- up. Histopathology 1991, 19:403-410.
22. Sotiriou C, Pusztai L: Gene-expression signature in breast cancer. New
Engl J Med 2009, 360:790-800.
23. Nanni P, Nicoletti G, De Giovanni C, Landuzzi L, Di Carlo E, Cavallo F, Pupa
SM, Rossi I, Colombo MP, Ricci C, Astolfi A, Musiani P, Forni G, Lollini P-L:
Combined allogenic tumor cell vaccination and systemic interleukin
12 prevent mammary carcinogenesis in HER- 2/neu transgenic mice. J
Exp Med 2001, 194:1195-1206.
24. Wolf-Yadiin A, Kumar N, Zhang Y, Hautaniemi S, Zaman M, Kim H-D,
Grantcharova V, Lauffenburger DA, White FM: American Society of
Clinical Oncology/College of American Pathologists guideline
recommendations for human epidermal growth factor receptor 2
testing in breast cancer. J Clin Oncol 2007, 25:118-43.
25. Edwards K, Munger K: Depletion of physiological levels of the human
TID1 protein renders cancer cell lines resistant to apoptosis mediated
by multiple signalling. Oncogene 2004, 23:8419-8431.
26. Kim S-W, Hayashi M, LO J-F, Fearns C, Xiang R, Lazennec G, Xang Y, Lee J-D:
Tid1 negatively regulates the migratory potential of cancer cells by
inhibiting the production of interleukin-8. Cancer Res 2005,
65:8784-8791.
27. Earp HS, Calvo BF, Sartor CI: The EGF receptor family multiple roles in
proliferation, differentiation, and neoplasia with an emphasis on Her-4.
Trans Am Clin and Climatol Assoc 2003, 114:315-334.
28. Alimandi M, Romano A, Curia MC, Muraro R, Fedi P, Aaronson SA, Di Fiore
PP, Kraus MH: Cooperative signalling of ErbB3 and ErbB2 in neoplastic
transformation and human mammary carcinoma. Oncogene 1995,
10:1813-182.
29. Graus-Porta D, Beerli RR, Daly JM, Hynes NE: ErbB-2, the preferred
heterodimerization partner of all ErbB receptors is a mediator of lateral
signaling. EMBO J 1997, 16:1647-1655.
30. Fiorini M, Alimandi M, Fiorentino L, Sala G, Segatto O: Negative regulation
of receptor tyrosine kinase signal. FEBS Lett 2001, 490:132-141.
31. Gur G, Rubin C, Katz M, Amit I, Citri A, Nilsson J, Amariglio N, Henriksson R,
Rechavi G, Hedman H, Wides R, Yarden Y: LRIG1 restricts growth factor
signalling by enhancing receptor ubiquitynation and degradation.
EMBO J 2004, 23:3270-3281.
32. Kario E, Marmor MD, Adamsky K, Amit I, Amariglio N, Rechavi G, Yarden Y:
Suppressors of cytokine signalling 4 and 5 regulate epidermal growth
factor receptor signaling. J Biol Chem 2005, 280:7038-7048.
33. Fiorentino L, Pertica C, Fiorini M, Talora C, Crescenzi M, Castellani L, Alema
S, Benedetti P, Segatto O: Inhibition of ErbB-2 mitogenic and
transforming activity by RALT, a mitogen- induced signal transducer
which binds to the ErbB-2 kinase domain. Mol Cell Biol 2000,
20:7735-7750.
34. Anastasi S, Baietti MF, Frosi Y, Alemà S, Segatto O: The evolutionary
conserved EBR module of RALT/MIG6, mediates suppression of the
EGFR catalytic activity. Oncogene 2007, 26:78337849.
doi: 10.1186/1479-5876-8-58
Cite this article as: Kurzik-Dumke et al., In vivo evidence of htid suppressive
activity on ErbB-2 in breast cancers over expressing the receptor Journal of
Translational Medicine 2010, 8:58