Low expression levels of hepsin and TMPRSS3 are associated with poor breast cancer survival
Bạn đang xem bản rút gọn của tài liệu. Xem và tải ngay bản đầy đủ của tài liệu tại đây (1.09 MB, 15 trang )
Pelkonen et al. BMC Cancer (2015) 15:431
DOI 10.1186/s12885-015-1440-5
RESEARCH ARTICLE
Open Access
Low expression levels of hepsin and TMPRSS3 are
associated with poor breast cancer survival
Mikko Pelkonen1,2,3, Kaisa Luostari1,2,3, Maria Tengström4,5, Hermanni Ahonen1,2,3, Bozena Berdel1,2,3, Vesa Kataja4,5,
Ylermi Soini1,2,3, Veli-Matti Kosma1,2,3† and Arto Mannermaa1,2,3*†
Abstract
Background: Hepsin, (also called TMPRSS1) and TMPRSS3 are type II transmembrane serine proteases (TTSPs) that
are involved in cancer progression. TTSPs can remodel extracellular matrix (ECM) and, when dysregulated, promote
tumor progression and metastasis by inducing defects in basement membrane and ECM molecules. This study
investigated whether the gene and protein expression levels of these TTSPs were associated with breast cancer
characteristics or survival.
Methods: Immunohistochemical staining was used to evaluate hepsin levels in 372 breast cancer samples and
TMPRSS3 levels in 373 samples. TMPRSS1 mRNA expression was determined in 125 invasive and 16 benign breast
tumor samples, and TMPRSS3 mRNA expression was determined in 167 invasive and 23 benign breast tumor
samples. The gene and protein expression levels were analyzed for associations with breast cancer-specific survival
and clinicopathological parameters.
Results: Low TMPRSS1 and TMPRSS3 mRNA expression levels were independent prognostic factors for poor breast
cancer survival during the 20-year follow-up (TMPRSS1, P = 0.023; HR, 2.065; 95 % CI, 1.106–3.856; TMPRSS3, P = 0.013;
HR, 2.106; 95 % CI, 1.167–3.800). Low expression of the two genes at the mRNA and protein levels associated with
poorer survival compared to high levels (log rank P-values 0.015–0.042). Low TMPRSS1 mRNA expression was also
an independent marker of poor breast cancer prognosis in patients treated with radiotherapy (P = 0.034; HR, 2.344;
95 % CI, 1.065–5.160). Grade III tumors, large tumor size, and metastasis were associated with low mRNA and protein
expression levels.
Conclusions: The results suggest that the TTSPs hepsin and TMPRSS3 may have similar biological functions in the
molecular pathology of breast cancer. Low mRNA and protein expression levels of the studied TTSPs were
prognostic markers of poor survival in breast cancer.
Keywords: Biomarkers, Breast cancer, Extracellular matrix, Gene expression profiling, Hepsin, Membrane-associated
proteins, Prognosis, TMPRSS1, Type II transmembrane serine proteases, TMPRSS3
Background
Globally, breast cancer is the most commonly diagnosed
cancer in women, while metastatic disease is the leading
cause of cancer-related deaths in this group [1]. Epithelial
integrity and intact extracellular matrix (ECM), which
includes basement membrane and interstitial connectivity
* Correspondence:
†
Equal contributors
1
Institute of Clinical Medicine, Pathology and Forensic Medicine, University of
Eastern Finland, P.O. Box 1627, FI-70211 Kuopio, Finland
2
Biocenter Kuopio and Cancer Center of Eastern Finland, University of
Eastern Finland, P.O. Box 1627, FI-70211 Kuopio, Finland
Full list of author information is available at the end of the article
tissue, are essential for normal cell behavior and tissue
homeostasis [2]. Remodeling and degradation of the ECM,
along with defects in structural cell-adhesion molecules,
play a significant role in breast cancer progression [3].
Type II transmembrane serine proteases (TTSPs) are a
relatively new subfamily of S1 class serine proteases in
humans comprised of 17 proteolytic enzymes [4, 5]. In
addition to their roles in normal tissue development and
homeostasis, TTSPs are also involved in several human
diseases, including cancer, and many show potential as
biomarkers of tumor progression and represent prospective therapeutic targets [6, 7]. TTSPs localize to the cell
© 2015 Pelkonen et al.; licensee BioMed Central. This is an Open Access article distributed under the terms of the Creative
Commons Attribution License ( which permits unrestricted use, distribution, and
reproduction in any medium, provided the original work is properly credited. The Creative Commons Public Domain
Dedication waiver ( applies to the data made available in this article,
unless otherwise stated.
Pelkonen et al. BMC Cancer (2015) 15:431
membrane and are able to degrade the ECM and remodel
intercellular and cell-ECM junctions. Accordingly, dysregulation of TTSPs is thought to be involved in the early
stages of tumorigenesis, tumor growth, and cancer cell
invasiveness that lead to metastasis [8, 9]. In this study, we
looked at the expression of two members of the TTSP
family, hepsin (also called TMPRSS1), which is encoded
by the TMPRSS1 gene, and TMPRSS3, encoded by the
TMPRSS3 gene.
Hepsin upregulation in malignant tumors has been
demonstrated in prostate and ovarian cancers as well as
in renal cell carcinoma [10–13]. A recent study used immunohistochemistry to show that hepsin protein levels
were upregulated in human breast cancer tumor samples
[14]. TMPRSS1 mRNA overexpression is associated with
ER(α)-positive human breast tumors [15], while TMPRSS3
overexpression has been implicated in pancreatic and epithelial ovarian cancers [16, 17]. Missense mutations in the
TMPRSS3 gene that lead to structural TMPRSS3 defects
are associated with hereditary deafness [18]. Both hepsin
and TMPRSS3 belong to the hepsin/TMPRSS subfamily
of TTSPs and share structural features [5, 6]. TTSPs are
anchored to the cell membrane via an N-terminal transmembrane domain. At the C-terminus, TTSPs have an
extracellular serine protease domain that is required for
their catalytic activity [4, 7]. Notably, several soluble forms
of TTSPs that retain catalytic activity have also been detected [4, 9]. Hepsin and TMPRSS3 appear to be capable
of autocatalytic activation, suggesting that they play roles
as initiators of proteolytic cascades that lead to ECM
remodeling [19, 20]. Overexpressed hepsin activates proteolytic pathways and also directly interferes with cell-cell
and cell-ECM adhesion molecules. Hepsin can activate
hepatocyte growth factor (HGF) and urokinase-type plasminogen activator- (uPA) mediated proteolytic pathways,
which results in ECM degradation [21–23]. Hepsin plays a
physiological role as it directly and specifically cleaves
laminin-332 (ln-332, previously termed laminin-5), an important ECM protein involved in maintaining the structural integrity of the basement membrane [24]. It was
shown recently that hepsin becomes mislocalized when
liver kinase B1 (lkb1) expression is lost and that overexpressed hepsin induces basement membrane degradation
in breast cancer [25].
This is the first study to examine TMPRSS3 gene
expression in a set of clinical breast cancer samples and
to investigate whether altered TMPRSS1 and TMPRSS3
gene expression has an impact on the clinical outcome
of breast cancer patients. Here, we analyzed the associations of mRNA and protein expression of these genes
with clinicopathological parameters and breast cancerspecific survival. Recently, we reported that TMPRSS3
SNP rs3814903 associated with both breast cancer risk
and survival and SNP rs11203200 associated with breast
Page 2 of 15
cancer survival [26]. Furthermore, TMPRSS1 SNPs
rs12151195 and rs12461158 remained independent
prognostic factors of breast cancer survival [26]. Our
previous study showed that another member of the
TTSP family, matriptase (encoded by the ST14 gene),
is associated with breast cancer survival [27]. We also
showed that several TMPRSS6 (encoding matriptase-2)
variants are related to breast cancer prognosis and
matriptase-2 expression levels decrease with tumor
progression [28]. These previous findings prompted
us to investigate whether altered expression of hepsin
and TMPRSS3 might also have a role in the molecular
pathology of breast cancer. Although the physiological
substrates for TMPRSS3 remain unclear, it is possible that
the biological mechanisms that lead to ECM degradation
are similar to those of hepsin. When overexpressed in
breast cancer, hepsin and TMPRSS3 could promote cancer cell invasiveness via dysregulated proteolytic activity.
This results in defects in the basement membrane and in
uncontrolled ECM degradation. However, the expression
levels seem to decrease as tumor malignancy increases,
and low expression levels of these proteins are associated
with poor breast cancer survival as well as with the adjuvant treatments the patients received.
Methods
Patients
The patient samples used in this study were obtained from
the Kuopio Breast Cancer Project (KBCP) sample set,
which includes 497 potential breast cancer cases from the
Northern Savo region of Eastern Finland. The patients
were diagnosed at Kuopio University Hospital between
April 1990 and December 1995 [27, 29]. All the patients
are of Caucasian race. The KBCP, including this study,
was approved by the official Research Ethics Committee
of Hospital District of Northern Savo. Informed written
consents were obtained from all of the patients and this
study was carried out in compliance with the Declaration
of Helsinki. Patient follow-up status was last revised in
February 2011. Table 1 shows the clinicopathological characteristics of the breast tumor cases in this study as well
as data on the adjuvant treatments the patients received.
RNA extraction and cDNA synthesis
Human breast tumor tissue sample retrieval during surgery, RNA extraction from the tumor samples and cDNA
synthesis were performed as described in Kauppinen et al.
[27]. The mirVana™ miRNA Isolation Kit (Life Technologies, Carlsbad, CA) was used to extract total RNA from
frozen tissue samples, and the High Capacity cDNA
Reverse Transcription Kit (Life Technologies) for cDNA
synthesis. RNA extraction and cDNA synthesis were performed according to the manufacturer’s instructions.
Pelkonen et al. BMC Cancer (2015) 15:431
Page 3 of 15
Table 1 Clinicopathological charasteristics of the patients
Cases in TMPRSS1
Cases in TMPRSS3
Cases in TMPRSS1*
Cases in TMPRSS3
mRNA expression
mRNA expression
protein expression
protein expression
n
%
n
%
n
%
n
%
Malignant
125
88.7
167
87.9
372
100
373
100
Benign
16
11.3
23
12.1
Ductal
89
63.2
118
62.1
236
63.5
237
63.5
Lobular
20
14.2
31
16.3
73
19.6
72
19.3
63
16.9
64
17.2
Clinical variable
Breast tumor samples
Histological type
Other malignant
16
11.3
18
9.5
Benign
16
11.3
23
12.1
< = 39
12
9.6
14
8.4
31
8.3
31
8.3
40–49
22
17.6
29
17.4
91
24.5
91
24.4
50–59
29
23.2
38
22.8
88
23.7
88
23.6
Age at diagnosis
60–69
18
14.4
28
16.7
53
14.2
54
14.5
> = 70
44
35.2
58
34.7
109
29.3
109
29.2
I
24
19.2
28
16.8
87
23.4
88
23.6
II
51
40.8
74
44.3
162
43.6
161
43.2
III
48
38.4
60
35.9
105
28.2
106
28.4
NA
2
1.6
5
3.0
18
4.8
18
4.8
T1
46
36.8
63
37.7
173
46.5
174
46.6
T2
64
51.2
84
50.3
160
43.0
160
42.9
T3
9
7.2
12
7.2
19
5.1
20
5.4
T4
6
4.8
8
4.8
15
4.0
15
4.0
5
1.4
4
1.1
Tumor grade
Tumor size
NA
Nodal status
Negative
71
56.8
87
52.1
197
53.0
198
53.1
Positive
51
40.8
73
43.7
155
41.6
155
41.5
NA
3
2.4
7
4.2
20
5.4
20
5.4
Stage
I
34
27.2
42
25.1
121
32.5
122
32.7
II
74
59.2
97
58.1
184
49.5
184
49.3
III
10
8.0
14
8.4
32
8.6
32
8.6
IV
4
3.2
7
4.2
13
3.5
13
3.5
NA
3
2.4
7
4.2
22
5.9
22
5.9
ER status
Negative
40
32.0
50
29.9
82
22.0
83
22.2
Positive
83
66.4
111
66.5
270
72.6
270
72.4
NA
2
1.6
6
3.6
20
5.4
20
5.4
Pelkonen et al. BMC Cancer (2015) 15:431
Page 4 of 15
Table 1 Clinicopathological charasteristics of the patients (Continued)
PR status
Negative
56
44.8
70
41.9
140
37.6
141
37.8
Positive
67
53.6
91
54.5
212
57.0
211
56.6
NA
2
1.6
6
3.6
20
5.4
21
5.6
99
79.2
130
77.8
299
80.4
299
80.2
HER2 status
Negative
Positive
19
15.2
24
14.4
46
12.3
46
12.3
NA
7
5.6
13
7.8
27
7.3
28
7.5
24
19.2
29
17.4
42
11.3
43
11.5
ER/PR/HER2 status
Triple-negative
Non-triple-negative
94
75.2
122
73.0
289
77.7
288
77.2
NA
7
5.6
16
9.6
41
11.0
42
11.3
Yes
66
52.8
84
50.3
205
55.1
208
55.8
No
59
47.2
83
49.7
167
44.9
165
44.2
Radiotherapy
Chemotherapy
Yes
18
14.4
26
15.6
69
18.5
69
18.5
No
107
85.6
141
84.4
303
81.5
304
81.5
Yes
23
18.4
31
18.6
62
16.7
62
16.6
No
102
81.6
136
81.4
310
83.3
311
83.4
Alive
38
30.4
52
31.2
149
40.1
149
39.9
Died of breast cancer
42
33.6
56
33.5
112
30.1
113
30.3
Died of other reason
45
36.0
59
35.3
111
29.8
111
29.8
Tamoxifen
Latest follow-up status
NA, data not avalaible; *hepsin
Quantitative real-time PCR
Of the KBCP sample set, 125 invasive breast cancer
samples and 16 benign breast tumor samples were available for TMPRSS1 mRNA absolute quantification by
real-time PCR, and 167 invasive and 23 benign samples
were available for TMPRSS3 mRNA quantification. TaqMan Gene Expression Assays (Life Technologies) were
used according to the manufacturer’s instructions (assay
#Hs01056332_m1 for TMPRSS1 and #Hs00225161_m1
for TMPRSS3), and peptidylprolyl isomerase A (PPIA)
was used as an endogenous control [Human Cyc PreDeveloped TaqMan Assay Reagents (20X), Life Technologies] [30]. Brilliant III Ultra-Fast QPCR Master Mix
(Agilent Technologies, Santa Clara, CA) and Mx3000P
real-time PCR system with MxPro-Mx3000P v4.10 software (Agilent Technologies) were used according to the
manufacturer’s instructions. The PCR thermal profile was
1 cycle at 95-°C for 3 min followed by 45-55 cycles at 95-°C
for 20 s plus 30 s at 60-°C. The assays for the studied gene
and the control were in the same reaction. Samples were
analyzed in triplicate in 96-well plates. The amount of
cDNA varied from 2-75 ng in a final volume of 20-μl, and
each plate included standard curves for sample quantification using a serial dilution of cDNA that was synthesized
from 5 randomly-selected KBCP tumor samples. The relative mRNA expression values were calculated by dividing
the raw expression of the studied gene with the raw PPIA
expression in the sample.
Immunohistochemistry
For immunohistochemical staining, 372 invasive breast
cancer tumor samples were available for hepsin analysis
and 373 samples were available for TMPRSS3 analysis.
Immunohistochemical staining was performed on 4-μm
sections cut from the tissue microarray (TMA) blocks.
The TMA blocks were constructed with a custom-built
instrument (Beecher Instruments, Silver Spring, MD).
The sample diameter of the tissue core in the array
block was 1000 μm and three samples from tumor tissue
of each case were studied. After deparaffinization and rehydration, the sections for TMPRSS3 analysis were heated
in a microwave oven for 3 × 5 min in citrate buffer
(pH 6.0). The sections for hepsin analysis were not heated.
The slides were treated for 5 min with 5 % hydrogen
Pelkonen et al. BMC Cancer (2015) 15:431
peroxide to block endogenous peroxidase, then incubated
for 35 min at room temperature in 1.5 % normal serum
diluted in PBS to block non-specific binding. The blocked
sections were incubated overnight at 4-°C with the rabbit
polyclonal primary antibody against hepsin (LS-C24203/
28374; LifeSpan BioSciences, Seattle, WA) at a dilution of 1:250 or with an antibody against TMPRSS3
(NBP1-19582; Novus Biologicals, Littleton, CO) at a dilution of 1:250. The slides were then incubated with a biotinylated secondary antibody for 35 min and with an
avidin-biotin-peroxidase complex for 45 min [Vectastain
Elite ABC Kit (anti-rabbit IgG); Vector Laboratories,
Burlingame, CA]. Slides were rinsed with PBS after each
step of the immunostaining procedure. The color was developed using diaminobenzidine tetrahydrochloride (DAB;
Sigma, St. Louis, MO). The slides were counterstained
with Mayer's hematoxylin, washed, dehydrated, cleared,
and mounted with Depex (BDH, Poole, UK). For the negative controls, the primary antibody was omitted.
Three slides from each TMA block were examined in
triplicate by two researchers (BB, HA) under the supervision of a senior pathologist (YS). The immunoreactivity of
hepsin and TMPRSS3 in the cytoplasm of epithelial tumor
cells was analyzed, and the intensity and the extent of
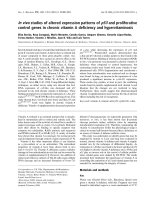
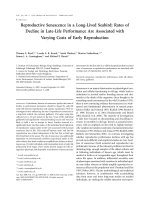
staining were scored (0, negative; 1, weak; 2, moderate; 3,
intense; Fig. 1a-d). The three slides were evaluated separately by researchers and were re-evaluated when values
were inconsistent to achieve a consensus. The tumor samples were divided into low and high expression groups
according to the median value of immunohistochemical
staining scores.
Page 5 of 15
Statistical analysis
Statistical analyses were performed using IBM SPSS Statistics 19 software (IBM Corporation, Armonk, NY). The
non-parametric Mann-Whitney U test and the KruskalWallis test were used to study differences in continuous
mRNA expression values according to different clinicopathological parameters. Fisher’s exact test was used to
study associations between protein expression and clinicopathological parameters. The odds ratios (ORs) and
the 95 % confidence intervals (95 % CIs) were determined using logistic regression analysis to describe the
strength of statistically significant associations between
expression levels and clinicopathological characteristics.
The Kaplan-Meier method was used in univariate survival analyses. Multivariate Cox’s proportional hazards
analysis was carried out in a forward stepwise method to
estimate the hazard factors having an impact on breast
cancer-specific death and relapse. In addition to mRNA
and protein expressions, Cox regression analysis examined the following clinicopathological parameters: tumor
grade, nodal status, tumor size, estrogen receptor (ER) status, progesterone receptor (PR) status, and tumor histologic type. In addition, the adjuvant treatments were used
as variables in the analyses including the treatment data.
All statistical tests were two-sided, and a P value of 0.05
was considered statistically significant.
We used an online Kaplan-Meier survival analysis tool
to validate the value of TMPRSS1 and TMPRSS3 as prognostic biomarkers in breast cancer ( />analysis/index.php?p=service&cancer=breast) [31]. The
Kaplan-Meier plotter uses gene expression data and
A
B
C
D
Fig. 1 Immunohistochemical staining of hepsin and TMPRSS3 in invasive ductal breast cancer. Cytoplasmic immunostaining of epithelial tumor
cells: a, weak staining of hepsin (score of 1 for intensity); b, intense staining of hepsin (score of 3); c, weak staining of TMPRSS3 (score of 1);
d, intense staining of TMPRSS3 (score of 3). All panels, 400x magnification
Pelkonen et al. BMC Cancer (2015) 15:431
Page 6 of 15
relapse-free and overall survival information which
are downloaded from GEO (Affymetrix microarrays
only), EGA and TCGA. The patient samples are divided
into two groups according to the median gene expression
value similar to our analysis method. The groups are then
compared by Kaplan-Meier plot and the hazard ratio with
95 % confidence intervals and log rank P values are calculated [31].
Results
Low mRNA expression and low protein expression are
associated with advanced breast cancer tumor malignancy
The results of quantitative real-time PCR and immunohistochemical staining were analyzed for associations with
the clinicopathological parameters of each patient. Table 2
presents the statistical association results for TMPRSS1
and TMPRSS3 mRNA expression, and Additional file 1:
Table S1 presents the statistical association results for
hepsin and TMPRSS3 protein expression. TMPRSS1
and TMPRSS3 mRNA expression was high in welldifferentiated malignant breast tumors compared to
benign breast tumors (Table 2; Additional file 2: Figure
S1A-B). However, poorly differentiated tumors expressed
low mRNA levels of both genes (TMPRSS1: P = 0.000015
and TMPRSS3: P = 0.0002; Kruskal-Wallis test; Table 2;
Additional file 2: Figure S1A-B). Likewise, logistic regression analysis showed that low hepsin expression
levels were associated with poorly differentiated tumors
(P = 0.00009; OR, 3.289; 95 % CI, 1.811-5.973; Additional
file 1: Table S1), as were low levels of TMPRSS3 protein
expression (P = 0.0000002; OR, 5.006; 95 % CI, 2.7219.209; Additional file 1: Table S1).
The results in Table 2 and Additional file 1: Table S1
show that mRNA and protein expression levels were
high in well-differentiated tumors and low in poorly differentiated tumors. Furthermore, logistic regression analysis
showed that low hepsin and TMPRSS3 protein expression
levels were positively associated with advanced clinical
stages III and IV (hepsin: P = 0.005; OR, 2.757; 95 % CI,
1.354-5.611 and TMPRSS3: P = 0.028; OR, 2.176; 95 % CI,
1.086-4.361) and that low hepsin expression was positively
associated with larger tumor sizes (T3 and T4; P = 0.034;
OR, 2.266; 95 % CI, 1.065-4.82), which indicates more
extensive disease. The Mann-Whitney U test showed
that low TMPRSS1 and TMPRSS3 expression levels were
associated with ER-negative status, PR-negative status,
and HER2-positive status (Table 2). In addition, low
TMPRSS1 mRNA expression was associated with triple-
Table 2 Significant clinical variables associated with TMPRSS1 and TMPRSS3 mRNA expression
TMPRSS1 expressiona
Clinical variable
n (%)
Tumor type
TMPRSS3 expressiona
Median / IQR
P
n (%)
0.002
Benign
16 (11.3)
Malignant
125 (88.7)
Tumor grade
NS
0.27 / 0.57
23 (12.1)
0.96 / 2.10
167 (87.9)
0.000015
0.98 / 0.56
0.92 / 1.74
0.0002
I
24 (19.5)
0.000007b
2.03 / 2.74
28 (17.3)
0.016b
II
51 (41.5)
NSc
1.67 / 2.41
74 (45.7)
NSc
III
48 (39.0)
ER status
0.000004
Median / IQR
P
d
0.55 / 0.88
60 (37.0)
0.000003
1.76 / 2.80
1.29 / 2.03
d
0.0001
0.55 / 0.84
0.0027
Negative
40 (32.5)
0.45 / 0.84
50 (31.1)
0.55 / 0.84
Positive
83 (67.5)
1.67 / 2.44
111 (68.9)
1.24 / 2.34
0.59 / 1.39
70 (43.5)
1.53 / 2.57
91 (56.5)
PR status
0.001
Negative
56 (45.5)
Positive
67 (54.5)
HER2 status
0.0076
0.001
0.67 / 1.21
1.32 / 2.41
0.017
Negative
99 (83.9)
1.12 / 2.25
130 (84.4)
1.08 / 2.46
Positive
19 (16.1)
0.35 / 0.75
24 (15.6)
0.58 / 0.89
ER/PR/HER2 status
0.001
NS
Triple-negative
24 (20.3)
0.49 / 0.98
29 (19.2)
0.69 / 1.86
Non-triple-negative
94 (79.7)
1.12 / 2.33
122 (80.8)
1.09 / 1.81
IQR, Interquartile range; NS, Not significant
a
Mann-Whitney U test was used for subgroups of two variables and Kruskal-Wallis test for subgroups of several variables
b
P value for comparing mRNA expression in benign tumors versus grade I tumors
c
P value for comparing mRNA expression in grade I tumors versus grade II tumors
d
P value for comparing mRNA expression in grade I tumors versus grade III tumors
Pelkonen et al. BMC Cancer (2015) 15:431
Page 7 of 15
negative tumors (Table 2). As shown by the logistic regression analysis, low hepsin protein expression associated
with positive nodal status, while low TMPRSS3 protein
expression with PR-negative status and triple-negative
tumors (Additional file 1: Table S1).
Low mRNA and protein expression levels predict poor
breast cancer survival
Statistical analysis of 20-year follow-up data revealed
that the mRNA and protein expression levels of the
studied genes had prognostic value for the breast cancer
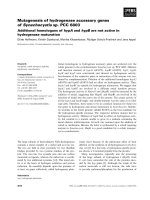
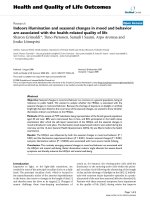
patients in this study. The univariate Kaplan-Meier analysis showed that low mRNA expression of TMPRSS1
(log rank, P = 0.042; Fig. 2a) and TMPRSS3 (log rank,
P = 0.015; Fig. 2b) predicted poorer breast cancerspecific survival compared to high expression, as did low
expression of the TMPRSS3 protein (log rank, P = 0.028;
Fig. 2d) during the 20-year follow-up period. Similarly,
low protein expression of hepsin (log rank, P = 0.035,
TMPRSS1
High expression
(n = 63)
Low expression
(n = 62)
Fig. 2c) predicted poorer breast cancer-specific survival
during the 10-year follow-up period, yet was not significant during the 20-year follow-up period (P = 0.315,
Fig. 2c).
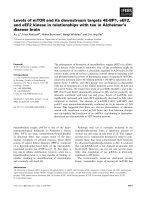
In the multivariate Cox regression survival analysis, low
mRNA expression of TMPRSS1 (P = 0.023; HR, 2.065;
95 % CI, 1.106-3.856; Table 3; Fig. 3a) and TMPRSS3 (P =
0.013; HR, 2.106; 95 % CI, 1.167-3.800; Table 3; Fig. 3b)
remained independent factors for predicting poor breast
cancer survival. The clinicopathological parameters that
remained independent prognostic factors of poor survival
included positive nodal status and large tumor size (T3,
T4) when TMPRSS1 expression was studied in the multivariate survival analysis. In the multivariate survival
analysis of TMPRSS3 expression, ER-negative status and
lobular histology were independent prognostic factors in
addition to positive nodal status and large tumor size.
Positive nodal status and large tumor size were statistically
more significant than low mRNA expression levels in
High expression TMPRSS3
(n = 83)
Low expression
(n = 84)
P (Log rank) = 0.042
P (Log rank) = 0.015
A
High expression
(n = 193)
Hepsin
Low expression
(n = 179)
P (Log rank) = 0.315
P (Log rank) = 0.035 (10-year follow-up)
B
High expression
(n = 173)
TMPRSS3
Low expression
(n = 200)
C
P (Log rank) = 0.028
D
Fig. 2 Kaplan-Meier survival analysis of the breast cancer patients according to mRNA and protein expression levels. Patients were divided into
high and low expression groups relative to the median expression values. Expression of a, TMPRSS1 mRNA (median follow-up time 9.84 years);
b, TMPRSS3 mRNA (median follow-up time 9.54 years); c, hepsin protein (median follow-up time 11.05 years); and d, TMPRSS3 protein (median
follow-up time 10.94 years)
Pelkonen et al. BMC Cancer (2015) 15:431
Page 8 of 15
Table 3 Multivariate Cox regression analyses of clinicopathological variables, mRNA and protein expression levels, and breast cancer
survival
Variable
B (SE)
Wald
RR (95 % CI)
P
2.194 (1.129–4.265)
0.020
Multivariate survival analysis with TMPRSS1 mRNA expression
Nodal status
Negative
Positive
Ref.
0.786 (0.339)
5.369
Tumor size
T1
Ref.
T2
0.678 (0.421)
2.597
1.970 (0.864–4.492)
0.107
T3, T4
1.385 (0.504)
7.563
3.997 (1.489–10.729)
0.006
0.725 (0.318)
5.187
2.065 (1.106–3.856)
0.023
2.976 (1.589–5.575)
0.001
TMPRSS1 mRNA expression*
Low
High
Ref.
Multivariate survival analysis with TMPRSS3 mRNA expression
Nodal status
Negative
Positive
Ref.
1.091 (0.320)
11.596
Tumor size
T1
Ref.
T2
0.317 (0.373)
0.769
1.386 (0.668–2.874)
0.380
T3, T4
1.256 (0.452)
7.720
3.511 (1.448–8.516)
0.005
6.111
2.106 (1.167–3.800)
0.013
0.734
1.603 (0.545–4.715)
0.391
6.497
4.487 (1.415–14.231)
0.011
1.873 (1.021–3.437)
0.043
2.482 (1.312–4.698)
0.005
2.650 (1.309–5.368)
0.007
TMPRSS3 mRNA expression*
Low
0.745 (0.301)
High
Ref.
Histology
Ductal
0.472 (0.551)
Lobular
1.501 (0.589)
Medullary, others
Ref.
ER status
Negative
0.628 (0.310)
Positive
4.109
Ref.
Multivariate survival analysis with combined TMPRSS1-TMPRSS3 mRNA expression
Combined mRNA expression†
Low
0.909 (0.325)
Others
7.803
Ref.
Nodal status
Negative
Positive
Ref.
0.975 (0.360)
7.327
Tumor size
T1
Ref.
T2
0.481 (0.433)
1.233
1.617 (0.692–3.779)
0.267
T3, T4
1.281 (0.505)
6.427
3.600 (1.337–9.691)
0.011
Pelkonen et al. BMC Cancer (2015) 15:431
Page 9 of 15
Table 3 Multivariate Cox regression analyses of clinicopathological variables, mRNA and protein expression levels, and breast cancer
survival (Continued)
Multivariate survival analysis with combined hepsin-TMPRSS3 protein expression
Nodal status
Negative
Positive
Ref.
0.905 (0.227)
15.942
2.473 (1.586–3.857)
0.00007
Tumor size
T1
Ref.
T2
0.176 (0.235)
0.559
1.192 (0.752–1.888)
0.455
T3, T4
0.891 (0.321)
7.696
2.438 (1.299–4.576)
0.006
Histology
Ductal
0.255 (0.322)
0.628
1.291 (0.687–2.426)
0.428
Lobular
0.903 (0.343)
6.909
2.466 (1.258–4.834)
0.009
Medullary, others
Ref.
Tumor grade
I
Ref.
II
0.711 (0.290)
6.025
2.036 (1.154–3.591)
0.014
III
0.532 (0.337)
2.493
1.702 (0.880–3.294)
0.114
4.087
1.541 (1.013–2.342)
0.043
Combined protein expression†
Low
0.432 (0.214)
Others
Ref.
Note: Analyses included tumor grade, histology, tumor size, nodal status, ER and PR status
B (SE), B coefficient with standard error; HR (95 % CI), hazard ratio of breast cancer death with a 95 % confidence interval; Ref., reference category in the
multivariate analysis
*The relative median value of mRNA expression level was used in the analyses
†
The ‘combined low group’ included all cases with low expression levels of both genes
terms of poor breast cancer prognosis. Associations between protein expression and breast cancer prognosis
could not be identified in the multivariate survival analysis
(data not shown).
Associations between relapse-free survival during the
20-year follow-up period and expression levels were
studied using univariate Kaplan-Meier analysis. Patients
with low levels of TMPRSS3 mRNA and low levels of
TMPRSS3 protein had more frequent relapses (TMPRSS3:
log rank, P = 0.009; Additional file 3: Figure S2A and
TMPRSS3: log rank, P = 0.003; Additional file 3: Figure
S2B). In the Cox regression multivariate analysis, both low
TMPRSS3 mRNA expression and low TMPRSS3 protein
expression remained independent factors that had an
effect on relapse occurrence (Additional file 3: Figure
S2C-D). When studied separately, the association of local
recurrence with expression levels was not as strong as the
association of distant recurrence with expression levels
(data not shown). During 20-year follow-up period, distant
metastasis occurred more frequently in patients with low
TMPRSS1 expression levels (Additional file 4: Figure S3A),
low TMPRSS3 expression levels (Additional file 4: Figure
S3B), and low TMPRSS3 protein expression levels
(Additional file 4: Figure S3C).
Low TMPRSS1 mRNA expression is associated with poor
survival in patients treated with radiotherapy
Associations between the studied expression levels and
breast cancer-specific and overall survival according to
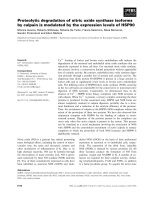
the adjuvant therapies given to the patients were analyzed using univariate Kaplan-Meier analysis and multivariate Cox regression survival analysis. Low TMPRSS1
mRNA expression was associated with both poor breast
cancer-specific survival (log rank, P = 0.030; Cox regression analysis, P = 0.034; HR, 2.344; 95 % CI, 1.065-5.160;
Fig. 4a) and poor overall survival (log rank, P = 0.006;
Cox regression analysis, P = 0.007; HR, 2.392; 95 % CI,
1.276-4.484; Fig. 4b) in patients who were treated with
radiotherapy. There were no significant survival differences according to the TMPRSS1 mRNA level in patients who did not receive radiotherapy. Furthermore,
the Kaplan-Meier estimates of patients who received
chemotherapy showed that low TMPRSS1 mRNA expression was associated with poor breast cancer-specific
survival (log rank, P = 0.028) and poor overall survival (log
rank, P = 0.028).
When the treatment data was included in the survival
analyses, low TMPRSS3 mRNA expression was associated with poor breast cancer-specific survival (log rank,
Pelkonen et al. BMC Cancer (2015) 15:431
Page 10 of 15
TMPRSS1
High expression
(n = 61)
Low expression
(n = 79)
HR, 2.106; 95% CI, 1.167-3-800
Low expression
(n = 61)
HR, 2.065; 95% CI, 1.106-3.856
P = 0.023
B (SE) = 0.725 (0.318)
A
Combined TMPRSS1-TMPRSS3
P = 0.013
B (SE) = 0.745 (0.301)
B
Combined hepsin-TMPRSS3
Others
(n = 244)
Others
(n = 79)
Combined
low expression (n = 100)
HR, 1.541; 95% CI, 1.013-2.342
Combined
low expression
(n = 41) HR, 2.482;
95% CI, 1.312-4.698
P = 0.005
B (SE) = 0.909 (0.325)
TMPRSS3
High expression
(n = 80)
C
P = 0.043
B (SE) = 0.432 (0.214)
D
Fig. 3 Cox regression multivariate analysis of breast cancer survival. Patients were divided into high and low expression groups relative to the
median expression values (a, b). Cox regression analysis of survival according to the expression of (a), TMPRSS1 mRNA (median follow-up time
9.79 years); b, TMPRSS3 mRNA (median follow-up time 9.51 years); c, TMPRSS1 and TMPRSS3 mRNA (median follow-up time 9.79 years); and d, hepsin
and TMPRSS3 protein expression (median follow-up time 11.05 years). In addition to expression levels, tumor grade, nodal status, tumor size, hormone
receptor status, and histologic type were included in the multivariate analyses. Positive nodal status and large tumor size (T3, T4) were other parameters
that were significantly associated with poorer breast cancer survival in the multivariate analyses
P = 0.039) in all the treated patients and remained an
independent factor predicting more frequent relapse
occurrence (log rank, P = 0.023; Cox regression analysis,
P = 0.021; HR, 1.831; 95 % CI, 1.094–3.063). Low TMPRSS3
protein expression also predicted poorer relapse-free
survival (log rank, P = 0.011; Cox regression, P = 0.031;
HR, 1.520; 95 % CI, 1.040–2.221) compared with high
TMPRSS3 expression. No significant results were found
between different treatment groups regarding TMPRSS3
expression.
The combination of low TMPRSS1-TMPRSS3 mRNA and
hepsin-TMPRSS3 protein expression predicts poor breast
cancer survival
The statistical associations between mRNA and protein
expression levels were assessed using Spearman rank
correlation coefficient. TMPRSS1 expression levels correlated with hepsin protein expression levels (r = 0.18;
P = 0.05; n = 112), and TMPRSS3 expression levels correlated with TMPRSS3 protein expression levels (r = 0.24;
P = 0.04; n = 147). Positive correlations were also found
between TMPRSS1 and TMPRSS3 mRNA expression
(r = 0.39; P = 0.000007; n = 123) and between hepsin and
TMPRSS3 protein expression (r = 0.27; P = 0.0000001;
n = 371). Consequently, combined TMPRSS1 and TMPRSS3
mRNA expression and combined hepsin and TMPRSS3
protein expression were tested for statistical association
with clinicopathological parameters and breast cancerspecific survival. The combination variables were formed
so that the breast cancer cases that expressed low mRNA
levels of both of the studied genes formed the ‘low combined mRNA expression group’ and the remaining cases
Pelkonen et al. BMC Cancer (2015) 15:431
Page 11 of 15
TMPRSS1
TMPRSS1
High expression
(n = 31)
High expression
(n = 31)
Low expression
(n = 35)
HR, 2.344; 95% CI, 1.065-5.160
P = 0.034
B (SE) = 0.852 (0.403)
Low expression
(n = 35)
HR, 2.392; 95% CI, 1.276-4.484
A
P = 0.007
B (SE) = 0.872 (0.321)
B
Fig. 4 Low TMPRSS1 mRNA expression is associated with poor survival in patients treated with radiotherapy in Cox regression multivariate analysis.
Cox regression analysis of a, breast cancer-specific survival and b, overall survival according to the TMPRSS1 mRNA expression in patients treated with
radiotherapy. Adjustments were made for age, stage, grade, histologic type, hormone receptor status, hormonal treatment, and chemotherapy
formed the other (reference) group. A similar approach
was used to forming a ‘low protein expression’ group.
Breast cancer cases with low combined expression
were associated with clinicopathological parameters that
indicate advanced tumor malignancy (Additional file 5:
Table S2).
Univariate Kaplan-Meier survival analyses showed that
low levels of both mRNA (log rank, P = 0.013; Additional
file 6: Figure S4A) and protein expression (log rank, P =
0.001; Additional file 6: Figure S4B) indicated poorer
breast cancer prognosis, with low expression levels associated with poor breast cancer survival and distant recurrence during the 20-year follow-up period (Additional
file 6: Figure S4C-D). Both low mRNA (P = 0.005; HR,
2.482; 95 % CI, 1.312–4.698; Table 3; Fig. 3c) and low
protein expression (P = 0.043; HR, 1.541; 95 % CI, 1.0132.342; Table 3; Fig. 3d) remained independent factors for
survival in the multivariate Cox regression analysis, as did
positive nodal status and large tumor size (data not
shown). Taken together, these results indicate that the
protein expression levels of hepsin and TMPRSS3 correlate with the mRNA levels of TMPRSS1 and TMPRSS3,
respectively. Further, low expression levels of TMPRSS1
and TMPRSS3 mRNA and hepsin and TMPRSS3 predict
advanced tumor malignancy and poorer prognosis.
The prognostic value of low TMPRSS1 and TMPRSS3
mRNA expression levels in breast cancer was validated in
a public gene expression dataset
The results obtained from the online Kaplan-Meier plotter
analysis tool presented that both low TMPRSS1 and
TMPRSS3 expression were significantly associated with
poorer relapse-free survival (TMPRSS1: log rank, P = 0;
HR, 0.61; 95 % CI, 0.55–0.69; n = 3554; Additional file 7:
Figure S5A and TMPRSS3: log rank, P = 3.8e-10; HR, 0.66;
95 % CI, 0.58–0.73; n = 3554; Additional file 7: Figure
S5B), overall survival (TMPRSS1: log rank, P = 0.0083; HR,
0.73; 95 % CI, 0.57–0.92; n = 1117; Additional file 7: Figure
S5C and TMPRSS3: log rank, P = 0.00005; HR, 0.58; 95 %
CI, 0.46–0.74; n = 1117; Additional file 7: Figure S5D),
and distant metastasis-free survival in breast cancer
(TMPRSS1: log rank, P = 0.000099; HR, 0.67; 95 % CI,
0.55–0.82; n = 1609; Additional file 7: Figure S5E and
TMPRSS3: log rank, P = 0.0000039; HR, 0.62; 95 % CI,
0.51–0.76; n = 1609; Additional file 7: Figure S5F).
Discussion
This is the first study to link altered TMPRSS3 expression to breast cancer tumor progression and to show
that low TMPRSS1 and TMPRSS3 expression, both at
the mRNA and protein levels, has prognostic value for
poorer survival of breast cancer patients. Importantly,
this is also the first cancer study to show that altered
TMPRSS3 expression has prognostic value for cancerrelated death. In benign breast tumor cells, the expression levels of TMPRSS1 and TMPRSS3 are consistently
low, whereas the expression levels are higher in cancer
cells. In malignant samples, there was clearly a high degree of intertumor variation in the expression levels of
the studied genes. However, our results indicated that
despite overexpression in well-differentiated tumors, the
expression levels decreased as the tumors acquired more
malignant characteristics. Poorly differentiated tumors
expressed lower levels of both TMPRSS1 and TMPRSS3.
Notably, both mRNA and protein expression levels were
associated with the clinical characteristics of breast cancer: Low expression levels predicted poorer survival and
increased risk of distant metastasis compared to high
Pelkonen et al. BMC Cancer (2015) 15:431
expression levels. Low TMPRSS1 and TMPRSS3 expression remained independent factors affecting breast cancerspecific survival in the Cox regression analysis.
These results are consistent with previous studies that
reported TMPRSS1 overexpression in various cancers, especially in prostate cancer [10–14], as well as TMPRSS3
overexpression in pancreatic and ovarian cancers [16, 17].
We found a notable difference in TMPRSS1 and TMPRSS3
mRNA expression between benign samples and grade I
malignant tumors in that grade I breast cancer samples
expressed considerably higher levels of TMPRSS1 and
TMPRSS3 than benign samples. This finding supports the
theory that hepsin is related to prostate cancer and suggests that hepsin and TMPRSS3 may also play important
roles in the early phases of breast carcinogenesis [32, 33].
Our hepsin and TMPRSS3 immunohistochemical staining
results correlated with the mRNA expression results. Specifically, samples with more intense cytoplasmic staining
were associated with lower tumor grade and stage, and
samples with low expression levels were linked to grade III
and stage III and IV tumors. Low mRNA expression levels
were common in tumors that did not express hormone receptors but that were HER2-positive. In addition, hepsin
expression was low in samples with positive nodal status.
In the current study, many of the clinical variables that are
generally related to advanced breast tumor progression
and higher breast cancer mortality rate were linked with
low expression levels of the studied genes [34, 35].
Our survival results indicated that low expression of
both of the studied genes was an independent prognostic
factor in breast cancer. Along with positive nodal status
and large tumor size (T3, T4), low mRNA expression
remained an independent factor for breast cancer survival.
Similarly to our results, Dhanasekaran et al. showed previously that low hepsin protein expression in human prostate cancer samples correlated with poor prostate cancer
prognosis [36]. In their study, absent or low hepsin immunostaining was dominant in benign samples, whereas
hepsin staining was strong in cancer samples. The strongest hepsin staining was in the precursor lesions of prostate cancer (HG-PIN). Yet among cancer samples, absent
or low hepsin expression was associated with prostatespecific antigen (PSA) elevation after radical prostatectomy and large tumor size, indicating poorer survival. In
contrast, regarding tumor malignancy, high TMPRSS1
mRNA expression correlated with advanced tumor stages
in prostate cancer [37]. Roemer et al. showed that in renal
cell carcinoma, decreased TMPRSS1 mRNA expression
was an independent factor that predicted poorer renal cell
carcinoma-specific survival [38]. They suggested that hepsin may be involved in both the early and late development of renal cell carcinoma. However, Betsunoh et al.
have observed that hepsin overexpression is associated
with poorer renal cell carcinoma survival [39]. In human
Page 12 of 15
hepatocellular carcinoma, Chen et al. found that decreased TMPRSS1 mRNA expression predicted shorter
survival time [40]. These studies illustrate variations
among the different studies; even so, many of these studies
are in agreement with our findings.
In this study we have shown that altered TMPRSS1
and TMPRSS3 expressions are associated with the occurrence of relapses and that low TMPRSS3 mRNA and protein expression are independent factors affecting distant
metastasis occurrence. Aberrant expression of TTSPs is associated with tumor invasion and metastasis in various epithelial cancers [6, 41]. Supporting our results, Vasioukhin
hypothesized that hepsin may promote metastasis in prostate cancer [32]. This hypothesis suggested that in the
initial stages of metastasis, hepsin overexpression might
stimulate the invasion of primary tumor cells but, once the
cells metastasized, hepsin expression would no longer be
essential in distant lesions. We found that distant metastases occurred more frequently during follow-up, in patients
with low expression levels of the studied genes in primary
tumors. This finding supports the theory that distant metastases are more likely to occur once a certain stage in
tumor development is reached, and expression of proteolytic serine proteases is needed from primary tumors to
achieve that stage. When local breast cancer relapses and
distant metastasis were studied together, low TMPRSS3
mRNA and protein expression remained independent factors that affected relapse in the Cox regression analyses.
On the other hand, based on prostate cancer cell line studies, Srikantan et al. suggested that hepsin overexpression
could have antitumorigenic effects and hinted that hepsin
might be involved in some sort of positive feedback response [42]. They suggested that decreased hepsin expression could be linked with poor prostate cancer prognosis
as exogenously provided hepsin negatively regulated the
growth of metastatic prostate cancer cells. However, the
first hepsin expression study in MDA-MB-231 and HER18
breast cancer cell lines showed that low hepsin expression
levels reduced cell viability and the colony formation rate
[14]. Wittig-Blaich et al. showed in a prostate cancer cell
line study that the consequences of increased hepsin
expression at the cellular level depend on the cell’s microenvironment, and the authors suggested that hepsin overexpression must be spatially and temporally restricted for
the efficient development of tumors and metastases [43].
Taken together, these findings support the theory that, depending on the phase of tumorigenesis and metastasis,
hepsin expression might either promote or suppress
tumors and metastasis.
Based on their proteolytic activity at the cell surface,
TTSPs could contribute to tumor progression by affecting initiation of the metastatic process in primary breast
cancer tumors. Several substrates for hepsin have been
linked to epithelial carcinogenesis, including HGF and
Pelkonen et al. BMC Cancer (2015) 15:431
uPA. Hepsin and another TTSP, matriptase, efficiently
convert inactive pro-HGF to biologically active HGF
that, in turn, activates the HGF receptor c-Met [21, 22].
This leads to basement membrane disorganization. Abnormal activation of the HGF/c-Met signaling pathway
by aberrant hepsin overexpression is a possible mechanism
for the enhancement of tumor progression. In addition,
hepsin converts potently pro-uPA into active uPA, which
initiates the degradation of ECM by cleaving plasminogen
into plasmin [23]. Hepsin may also directly contribute to
tumor progression and metastasis by causing defects in cell
junctions. Miao et al. showed in human and mouse ovarian
cancer cell line studies that hepsin overexpression contributes to ovarian cancer progression via cell membrane interactions with desmosomes [44]. By immunofluorescence
they showed that, in addition to cytoplasm hepsin colocalizes with desmosomes at the cell junctions; further,
intact desmosomes are required for the membrane localization of hepsin. Supporting these findings, Partanen
et al. recently reported that hepsin partially co-localizes
with the desmosomal junction protein desmoplakin and,
in breast cancer, the two proteins no longer co-localize
when lkb1 expression is lost [25]. Notably, loss of lkb1
causes hepsin to relocalize from desmosomes to cytoplasm. Taken together, these studies indicate that the
mislocalization and overexpression of hepsin could potentially initiate basement membrane degradation and
lead to tumor cell invasion.
The limitations of our study include that TMPRSS3
expression in cancer has not nearly been studied as extensively as the expression of TMPRSS1. More work
needs to be done to study the biological role of
TMPRSS3 in cancer. Nonetheless, our study presents in
a coherent clinical breast cancer sample set that
TMPRSS3 is a credible prognostic biomarker. In contrast to our results, a previous study presented that hepsin overexpression was associated with positive nodal
status and tumor stage in breast cancer [14]. However,
no survival analyses were done in that study and the
analysis methods were different. In addition, to validate
our results and the prognostic value of the studied genes
in a large clinical breast cancer microarray database, we
used an online Kaplan-Meier survival analysis tool [31].
Similar to our study, in these analyses the cohorts were
divided into two groups according to the median expression of TMPRSS1 and TMPRSS3. Based on the survival
curves displayed and the logrank P values both low
TMPRSS1 and TMPRSS3 expression significantly associated with poorer relapse-free survival, overall survival,
and distant metastasis-free survival [31]. To sum up, the
survival trend was exactly alike compared to our results.
When the treatment data was included in the multivariate survival analyses, low TMPRSS1 mRNA expression remained an independent factor of poor prognosis
Page 13 of 15
in patients who were treated with radiotherapy. It must
be highlighted that low TMPRSS1 expression remained
the only significant variable regarding prognosis which
excludes for example poor differentiation level of breast
cancer cells in these analyses. Furthermore, no significant results were found in patients who were not given
any adjuvant therapies. When TMPRSS1 expression level
is higher and epithelial integrity is still rather intact it
might be that radiation induced cellular lethality is much
more aggressive in breast cancer cells. However, when
TMPRSS1 expression is low and epithelial integrity already
damaged it appears that the remaining breast cancer cells
are radioresistant leading to these cells surviving which
has negative impact on the clinical outcome. Our results
indicate that low TMPRSS1 expression may independently
reduce the therapeutic function of radiation yet the specific cellular mechanisms remain unclear. Interestingly,
Nakamura et al. showed in an endometrial cancer cell line
study that hepsin overexpression resulted in significant
cell accumulation at the G2/M phase leading to cell cycle
arrest [45]. Cancer cells in general are thought to be the
most radiotherapy sensitive exactly at the G2/M phase
[46]. These previous studies comply our results even
though our significant results are related to mRNA expression and in breast cancer tumor samples. In a previous study of our group we found several TMPRSS1 and
TMPRSS3 SNP genotypes that associated with survival in
patients treated with radiotherapy [26]. We have planned
to study in the future the potential associations between
our current results with the ones from our SNP study.
The combinations of low expression levels of mRNA
and protein were independent factors that predicted
poor survival. This suggests that TTSPs are prognostic
biomarkers for breast cancer. Matriptase (encoded by
the ST14 gene) is a TTSP that, similar to hepsin, can activate pro-HGF. A recent study showed that hepsin and
matriptase are direct pericellular activators of pro-HGF
and hypothesized that their suggested ability to autoactivate might be the initial step in HGF/c-Met-mediated
basement membrane degradation [47]. Our previous
study of matriptase expression in breast cancer resulted
in conclusions that were similar to those in the present
study in that low matriptase expression was associated
with poorer breast cancer survival [27]. However, others
have reported the opposite and other studies of matriptase expression in breast cancer have not given consistent results [48]. Notably, since matriptase and hepsin
have identical substrates and since both have possible
tumor progression and metastasis-promoting activities,
further studies of TMPRSS3 are needed to better understand its functions and substrates. Structurally, TMPRSS3
is almost identical to hepsin, and here we have shown that
their mRNA and protein expression patterns are very
similar in different phases of breast carcinogenesis and
Pelkonen et al. BMC Cancer (2015) 15:431
Page 14 of 15
correlate with breast cancer prognosis. Co-expression of
these proteolytic serine proteases could enhance their
effects on tumor cell invasion and metastasis.
Conclusions
In closing, this study expands our knowledge of the biological processes behind breast cancer by investigating
hepsin and TMPRSS3 expression in human breast tumors.
Low mRNA and protein expression levels of the studied
TTSPs were prognostic markers of poor survival in breast
cancer. Furthermore, low TMPRSS1 mRNA expression is
an independent marker of poor clinical outcome in patients treated with radiotherapy. We think that our results
give emphasis to the role of altered expression of hepsin
and TMPRSS3 in promoting breast tumor progression
and metastasis as their role in breast cancer is still rather
unexplored. The results showed that both TTSPs have
potential as prognostic biomarkers.
Additional files
Additional file 1: Table S1. Significant clinical variables associated with
hepsin and TMPRSS3 protein expression.
Additional file 2: Figure S1. The studied A, TMPRSS1 and B, TMPRSS3
mRNA expression levels in benign breast tumor samples and in
malignant tumors grouped by tumor grade. In benign tumors, the mRNA
expression levels are lower compared to grade I tumors. Tumor grade is
inversely associated with TMPRSS1 and TMPRSS3 mRNA expression levels.
In grade I tumors, the cancer cells were well differentiated, in grade II
tumors, the cells were moderately differentiated, and in grade III tumors,
the cancer cells were poorly differentiated or undifferentiated. *P < 0.005
mRNA expression in benign tumors versus grade I tumors and grade I
tumors versus grade III tumors.
Additional file 3: Figure S2. Breast cancer relapse-free survival compared
to TMPRSS3 expression levels in Kaplan-Meier survival analysis and in Cox
regression multivariate analysis. Both local and distant recurrences were
taken into account. Patients were divided into high and low expression
groups relative to the median expression values. Low expression levels of A,
TMPRSS3 mRNA (median survival time 7.73 years) and B, TMPRSS3 protein
(median survival time 8.84 years) associated with relapses occurring more
frequently. Low expression levels of C, TMPRSS3 mRNA (median survival
time 9.10 years) and D, TMPRSS3 protein (median survival time 7.66 years)
expression remained independent prognostic factors of more frequent
occurrence of breast cancer relapse. In addition to expression levels, tumor
grade, nodal status, tumor size, ER status, PR status, and histologic type were
included in the multivariate analyses.
Additional file 4: Figure S3. Breast cancer distant metastasis-free
survival in Kaplan-Meier survival analysis. Patients were divided into high
and low expression groups relative to the median expression values. Low
expression levels of A, TMPRSS1 mRNA (median survival time 7.66 years);
B, TMPRSS3 mRNA (median survival time 7.78 years); and C, TMPRSS3
protein (median survival time 9.13 years) associated with distant metastasis
occurring more frequently.
Additional file 5: Table S2. Significant clinical variables associated with
combined TMPRSS1-TMPRSS3 mRNA.
Additional file 6: Figure S4. Breast cancer survival and distant
metastasis-free survival compared to combined mRNA and protein
expression variables in Kaplan-Meier survival analysis. The ‘combined low
expression’ groups of A; C, TMPRSS1 and TMPRSS3 mRNA (A, median
survival time 9.84 years; C, median survival time 7.96 years); and B; D,
hepsin and TMPRSS3 protein (B, median survival time 10.94 years; D,
median survival time 9.13 years) expression associated with poorer breast
cancer specific survival (A, B) and with distant metastasis (C, D) occurring
more frequently.
Additional file 7: Figure S5. The prognostic value of low TMPRSS1 and
TMPRSS3 mRNA expression levels in breast cancer was validated in a
public gene expression dataset. The results obtained from the online
Kaplan-Meier plotter analysis tool presented that both low TMPRSS1 and
TMPRSS3 expression were significantly associated with poorer relapse-free
survival (TMPRSS1, A; TMPRSS3, B), overall survival (TMPRSS1, C; TMPRSS3,
D), and distant metastasis-free survival in breast cancer (TMPRSS1, E;
TMPRSS3, F). Patients were divided into high and low expression groups
relative to the median expression values.
Abbreviations
TTSPs: Type II transmembrane serine proteases; TMPRSS1/3: Transmembrane
protease, serine 1/3; ECM: Extracellular matrix, HGF, hepatocyte growth
factor; uPA: Urokinase-type plasminogen activator; lkb1: Liver kinase B1;
ln-332: Laminin-332; KBCP: Kuopio Breast Cancer Project; PPIA: Peptidylprolyl
isomerase A; TMA: Tissue microarray; DAB: Diaminobenzidine tetrahydrochloride;
OR: Odds ratio; CI: Confidence interval; HR: Hazards ratio; ER: Estrogen receptor;
PR: Progesterone receptor; HER2: Human epidermal growth factor receptor 2;
HG-PIN: High-grade prostatic intraepithelial neoplasia; PSA: Prostate-specific
antigen.
Competing interests
The authors declare that they have no competing interests.
Authors’ contributions
MP, VK, V-MK and AM contributed to the conception and design of the
study. MT, VK, VM-K and AM were involved in the acquisition of data.
MP, KL, MT, HA, BB, YS and AM participated in the analysis and interpretation
of data. MP, MT and BB drafted the manuscript. MP, KL, MT, BB, V-MK and
AM contributed to the revision of the manuscript. HA and YS provided
technical and material support. VK, V-MK and AM provided administrative
support. KL, V-MK and AM contributed to the supervision of the study.
All authors read and approved the final manuscript.
Acknowledgments
We thank Helena Kemiläinen, Eija Myöhänen and Jaana Hoffrén (MHS) for
skillful technical assistance. The Kuopio Breast Cancer Project (KBCP) was
financially supported by the special Government Funding (EVO) of Kuopio
University Hospital Grants, the Cancer Fund of Northern Savo, the Finnish
Cancer Organizations, the Academy of Finland and by the strategic fund of
the University of Eastern Finland. The funding sources had no involvement
in the study design, in the collection, analysis and interpretation of data or in
the writing of the report.
Author details
Institute of Clinical Medicine, Pathology and Forensic Medicine, University of
Eastern Finland, P.O. Box 1627, FI-70211 Kuopio, Finland. 2Biocenter Kuopio
and Cancer Center of Eastern Finland, University of Eastern Finland, P.O. Box
1627, FI-70211 Kuopio, Finland. 3Imaging Center, Clinical Pathology, Kuopio
University Hospital, P.O. Box 1777, FI-70211 Kuopio, Finland. 4Institute of
Clinical Medicine, Oncology, University of Eastern Finland, P.O. Box 1627,
FI-70211 Kuopio, Finland. 5Cancer Center, Kuopio University Hospital, P.O. Box
1777, FI-70211 Kuopio, Finland.
1
Received: 15 November 2014 Accepted: 15 May 2015
References
1. Jemal A, Bray F, Center MM, Ferlay J, Ward E, Forman D. Global cancer
statistics. CA Cancer J Clin. 2011;61:69–90.
2. Lukashev ME, Werb Z. ECM signalling: Orchestrating cell behaviour and
misbehaviour. Trends Cell Biol. 1998;8:437–41.
3. McSherry EA, Donatello S, Hopkins AM, McDonnell S. Molecular basis of
invasion in breast cancer. Cell Mol Life Sci. 2007;64:3201–18.
4. Hooper JD, Clements JA, Quigley JP, Antalis TM. Type II transmembrane
serine proteases. insights into an emerging class of cell surface proteolytic
enzymes. J Biol Chem. 2001;276:857–60.
Pelkonen et al. BMC Cancer (2015) 15:431
5.
6.
7.
8.
9.
10.
11.
12.
13.
14.
15.
16.
17.
18.
19.
20.
21.
22.
23.
24.
25.
26.
27.
Bugge TH, Antalis TM, Wu Q. Type II transmembrane serine proteases. J Biol
Chem. 2009;284:23177–81.
Szabo R, Bugge TH. Type II transmembrane serine proteases in
development and disease. Int J Biochem Cell Biol. 2008;40:1297–316.
Antalis TM, Buzza MS, Hodge KM, Hooper JD, Netzel-Arnett S. The cutting
edge: Membrane-anchored serine protease activities in the pericellular
microenvironment. Biochem J. 2010;428:325–46.
Choi SY, Bertram S, Glowacka I, Park YW, Pohlmann S. Type II
transmembrane serine proteases in cancer and viral infections. Trends Mol
Med. 2009;15:303–12.
Netzel-Arnett S, Hooper JD, Szabo R, Madison EL, Quigley JP, Bugge TH,
et al. Membrane anchored serine proteases: A rapidly expanding group of
cell surface proteolytic enzymes with potential roles in cancer. Cancer
Metastasis Rev. 2003;22:237–58.
Luo J, Duggan DJ, Chen Y, Sauvageot J, Ewing CM, Bittner ML, et al. Human
prostate cancer and benign prostatic hyperplasia: Molecular dissection by
gene expression profiling. Cancer Res. 2001;61:4683–8.
Magee JA, Araki T, Patil S, Ehrig T, True L, Humphrey PA, et al. Expression
profiling reveals hepsin overexpression in prostate cancer. Cancer Res.
2001;61:5692–6.
Tanimoto H, Yan Y, Clarke J, Korourian S, Shigemasa K, Parmley TH, et al.
Hepsin, a cell surface serine protease identified in hepatoma cells, is
overexpressed in ovarian cancer. Cancer Res. 1997;57:2884–7.
Zacharski LR, Ornstein DL, Memoli VA, Rousseau SM, Kisiel W. Expression of
the factor VII activating protease, hepsin, in situ in renal cell carcinoma.
Thromb Haemost. 1998;79:876–7.
Xing P, Li J, Jin F, Zhao T, Liu Q, Dong H, et al. Clinical and biological
significance of hepsin overexpression in breast cancer. J Invest Med.
2011;59:803–10.
Tozlu S, Girault I, Vacher S, Vendrell J, Andrieu C, Spyratos F, et al.
Identification of novel genes that co-cluster with estrogen receptor alpha in
breast tumor biopsy specimens, using a large-scale real-time reverse
transcription-PCR approach. Endocr Relat Cancer. 2006;13:1109–20.
Wallrapp C, Hähnel S, Müller-Pillasch F, Burghardt B, Iwamura T,
Ruthenbürger M, et al. A novel transmembrane serine protease (TMPRSS3)
overexpressed in pancreatic cancer. Cancer Res. 2000;60:2602–6.
Underwood LJ, Shigemasa K, Tanimoto H, Beard JB, Schneider EN, Wang Y,
et al. Ovarian tumor cells express a novel multi-domain cell surface serine
protease. Biochim Biophys Acta. 2000;1502:337–50.
Scott HS, Kudoh J, Wattenhofer M, Shibuya K, Berry A, Chrast R, et al.
Insertion of beta-satellite repeats identifies a transmembrane protease
causing both congenital and childhood onset autosomal recessive deafness.
Nat Genet. 2001;27:59–63.
Qiu D, Owen K, Gray K, Bass R, Ellis V. Roles and regulation of membraneassociated serine proteases. Biochem Soc Trans. 2007;35:583–7.
Guipponi M, Vuagniaux G, Wattenhofer M, Shibuya K, Vazquez M,
Dougherty L, et al. The transmembrane serine protease (TMPRSS3) mutated
in deafness DFNB8/10 activates the epithelial sodium channel (ENaC)
in vitro. Hum Mol Genet. 2002;11:2829–36.
Kirchhofer D, Peek M, Lipari MT, Billeci K, Fan B, Moran P. Hepsin activates
pro-hepatocyte growth factor and is inhibited by hepatocyte growth factor
activator inhibitor-1B (HAI-1B) and HAI-2. Febs Lett. 2005;579:1945–50.
Herter S, Piper DE, Aaron W, Gabriele T, Cutler G, Cao P, et al. Hepatocyte
growth factor is a preferred in vitro substrate for human hepsin, a
membrane-anchored serine protease implicated in prostate and ovarian
cancers. Biochem J. 2005;390:125–36.
Moran P, Li W, Fan B, Vij R, Eigenbrot C, Kirchhofer D. Pro-urokinase-type
plasminogen activator is a substrate for hepsin. J Biol Chem.
2006;281:30439–46.
Tripathi M, Nandana S, Yamashita H, Ganesan R, Kirchhofer D, Quaranta V.
Laminin-332 is a substrate for hepsin, a protease associated with prostate
cancer progression. J Biol Chem. 2008;283:30576–84.
Partanen JI, Tervonen TA, Myllynen M, Lind E, Imai M, Katajisto P, et al.
Tumor suppressor function of liver kinase B1 (Lkb1) is linked to regulation
of epithelial integrity. Pro Natl Acad Sci USA. 2012;109:E388–97.
Luostari K, Hartikainen JM, Tengstrom M, Palvimo JJ, Kataja V, Mannermaa A,
et al. Type II transmembrane serine protease gene variants associate with
breast cancer. PLoS One. 2014;9:e102519.
Kauppinen JM, Kosma V, Soini Y, Sironen R, Nissinen M, Nykopp TK, et al.
ST14 gene variant and decreased matriptase protein expression predict poor
breast cancer survival. Cancer Epidemiol Biomarkers Prev. 2010;19:2133–42.
Page 15 of 15
28. Tuhkanen H, Hartikainen JM, Soini Y, Velasco G, Sironen R, Nykopp TK, et al.
Matriptase-2 gene (TMPRSS6) variants associate with breast cancer survival,
and reduced expression is related to triple-negative breast cancer. Int J Cancer.
2013;133:2334–40.
29. Hartikainen JM, Tuhkanen H, Kataja V, Dunning AM, Antoniou A, Smith P,
et al. An autosome-wide scan for linkage Disequilibrium–Based association
in sporadic breast cancer cases in eastern finland: Three candidate regions
found. Cancer Epidemiol Biomarkers Prev. 2005;14:75–80.
30. Veronesi U, Boyle P, Goldhirsch A, Orecchia R, Viale G. Breast cancer. Lancet.
2005;365:1727–41.
31. Gyorffy B, Lanczky A, Eklund AC, Denkert C, Budczies J, Li Q, et al. An online
survival analysis tool to rapidly assess the effect of 22,277 genes on breast
cancer prognosis using microarray data of 1809 patients. Breast Cancer Res
Treat. 2010;123:725–31.
32. Vasioukhin V. Hepsin paradox reveals unexpected complexity of metastatic
process. Cell Cycle. 2004;3:1394–7.
33. Klezovitch O, Chevillet J, Mirosevich J, Roberts RL, Matusik RJ, Vasioukhin V.
Hepsin promotes prostate cancer progression and metastasis. Cancer Cell.
2004;6:185–9.
34. Soerjomataram I, Louwman MW, Ribot JG, Roukema JA, Coebergh JW.
An overview of prognostic factors for long-term survivors of breast cancer.
Breast Cancer Res Treat. 2008;107:309–30.
35. Cianfrocca M, Goldstein LJ. Prognostic and predictive factors in early-stage
breast cancer. Oncologist. 2004;9:606–1.
36. Dhanasekaran SM, Barrette TR, Ghosh D, Shah R, Varambally S, Kurachi K,
et al. Delineation of prognostic biomarkers in prostate cancer. Nature.
2001;412:822–6.
37. Stephan C, Yousef GM, Scorilas A, Jung K, Jung M, Kristiansen G, et al.
Hepsin is highly over expressed in and a new candidate for a prognostic
indicator in prostate cancer. J Urol. 2004;171:187–91.
38. Roemer A, Schwettmann L, Jung M, Stephan C, Roigas J, Kristiansen G, et al.
The membrane proteases adams and hepsin are differentially expressed in
renal cell carcinoma. Are they potential tumor markers? J Urol.
2004;172:2162–6.
39. Betsunoh H, Mukai S, Akiyama Y, Fukushima T, Minamiguchi N, Hasui Y,
et al. Clinical relevance of hepsin and hepatocyte growth factor activator
inhibitor type 2 expression in renal cell carcinoma. Cancer Sci. 2007;98:491–8.
40. Chen CH, Su KY, Tao MH, Lin SW, Su YH, Tsai YC, et al. Decreased
expressions of hepsin in human hepatocellular carcinomas. Liver Int.
2006;26:774–80.
41. Webb SL, Sanders AJ, Mason MD, Jiang WG. Type II transmembrane serine
protease (TTSP) deregulation in cancer. Front Biosci. 2011;16:539–52.
42. Srikantan V, Valladares M, Rhim JS, Moul JW, Srivastava S. HEPSIN inhibits
cell growth/invasion in prostate cancer cells. Cancer Res. 2002;62:6812–6.
43. Wittig-Blaich SM, Kacprzyk LA, Eismann T, Bewerunge-Hudler M, Kruse P,
Winkler E, et al. Matrix- dependent regulation of AKT in hepsinoverexpressing PC3 prostate cancer cells. Neoplasia. 2011;13:579–8.
44. Miao J, Mu D, Ergel B, Singavarapu R, Duan Z, Powers S, et al. Hepsin
colocalizes with desmosomes and induces progression of ovarian cancer in
a mouse model. Int J Cancer. 2008;123:2041–7.
45. Nakamura K, Takamoto N, Abarzua F, Hongo A, Kodama J, Nasu Y, et al.
Hepsin inhibits the cell growth of endometrial cancer. Int J Mol Med.
2008;22:389–97.
46. Dillon MT, Good JS, Harrington KJ. Selective targeting of the G2/M cell cycle
checkpoint to improve the therapeutic index of radiotherapy. Clin Oncol
(R Coll Radiol). 2014;26:257–65.
47. Owen KA, Qiu D, Alves J, Schumacher AM, Kilpatrick LM, Li J, et al. Pericellular
activation of hepatocyte growth factor by the transmembrane serine proteases
matriptase and hepsin, but not by the membrane-associated protease uPA.
Biochem J. 2010;426:219–28.
48. Welman A, Sproul D, Mullen P, Muir M, Kinnaird AR, Harrison DJ, et al.
Diversity of matriptase expression level and function in breast cancer.
PLoS One. 2012;7:e34182.