Effect of levels of phosphorus and P solubilization by spent wash from rock phosphate on protein, total sugar and total starch contain in grain and straw of wheat in an Inceptisol
Bạn đang xem bản rút gọn của tài liệu. Xem và tải ngay bản đầy đủ của tài liệu tại đây (309.5 KB, 7 trang )
Int.J.Curr.Microbiol.App.Sci (2020) 9(8): 847-853
International Journal of Current Microbiology and Applied Sciences
ISSN: 2319-7706 Volume 9 Number 8 (2020)
Journal homepage:
Original Research Article
/>
Effect of levels of Phosphorus and P Solubilization by Spent Wash from
Rock Phosphate on Protein, Total Sugar and Total Starch Contain in Grain
and Straw of Wheat in an Inceptisol
Balu Ram, Ramawatar Meena* and Rajkumar Meena
Department of Soil Science & Agricultural Chemistry, Institute of Agricultural Sciences,
Banaras Hindu University, Varanasi-221005, India
*Corresponding author
ABSTRACT
Keywords
Rock Phosphate,
Spent Wash,
Protein, Total sugar
and Total starch,
Wheat
Article Info
Accepted:
10 July 2020
Available Online:
10 August 2020
Phosphorus is the most important nutrient element for growth and development of wheat.
In this field experiment, the effects of Solubilization of rock phosphate by spent wash
onprotein, total sugar and total starch content in grain and straw was studied. application of
100% N&K + 75% P through SSP recorded significantly highest protein content in grain
and straw found significantly superior to their lower levels. Results further indicate that
solubilization of rock phosphate remained at par with RP:SW@1:40 but recorded
significantly protein, total sugar and total starch content in grain and straw as compared to
remaining levels of rock phosphate and control. The application of RP:SW@1:40
significantly increased the protein, total sugar and total starch content in grain and straw
and total uptake. These improvement manifested in highest values of crop productivity in
terms of protein, total sugar and total starch content in grain, straw under this treatment.
The RP:SW@1:40 recorded the highest protein, total sugar and total starch content in
wheat crop.
production
is
24.5
million
tonnes,
productivity of 2.7 tonnes/ha and area is 9.2
million ha. The total wheat production of the
world is slightly concentrated and is clear
from the fact that these four producers
contribute to around 60% of the total
production. The consumption of wheat in the
world is 667 million tons but is kept satisfied
with an equally high production figures.
Consumption has been constantly increasing
during the last 15 years with the increase in
population and is prepared to shoot up further
to 780 million tonnes in 2020. It has been
Introduction
Wheat is second most important crop after
rice. It is grown under diverse agro climatic
conditions. The world production of wheat
figures over 670 million tons annually. The
largest producer of wheat in the world is the
European Union followed by China, India and
United States of America. India occupies area
(28.46 million hectares) and production (80.8
million tonnes) of wheat. Uttar Pradesh has
highest production (35.03%) of nation and
also large area. In Uttar Pradesh has wheat
847
Int.J.Curr.Microbiol.App.Sci (2020) 9(8): 847-853
estimated that India will need at least 109
million tonnes of wheat by 2020 as against
present area of 305.97 lac ha and production
of 98.38 million tonnes (Agricultural
Statistics at a Glance, 2015-16). Since very
little scope exists for horizontal growth, the
alternative is to achieve vertical growth
through increasing productivity.
Generally, the maximum and minimum
temperature ranged between 20 - 42°C and 9 28°C, respectively. The total protein was
estimated in this supernatent by folin reagent
by the method Lowry et al., (1951).
Estimation of starch and total sugar content
by anthrone reagent in the plant samples was
measured by following the method as
proposed by Hedge and Hofreiter (1962).
Experiment data was statistical analysis by
following the Split Plot Design (SPD) to draw
the valid differences among the treatments
using SPSS software.
Fertilizer is the single most important input in
modern agriculture to raise the crop
productivity. Phosphorus plays vital role in
enhancing maturity and development of seed.
Application of phosphorus and potassium
fertilizers reduce lodging tendency and
support tillering in wheat, improves
photosynthesis resulting high grains (Zhang et
al., 2010) reported that adequate P application
increase of 20% grain yield. Increased P
applications resulted in Nitrogen uptake.
Chaturvedi (2006) reported that 28.5 kg P ha-1
as optimum dose for growth, plant height,
grains spike-1, tillers, 1000 grain weight, grain
and straw yields. Jiang et al., (2006) observed
108 kg P ha-1 for higher tillers, leaf area
index, ear bearing tillers and dry matter
accumulation. Khalid et al., (2004) reported
that obtained maximum productive tillers,
grain yield and biological yield on application
of 45 kg P ha-1 in wheat.
Results and Discussion
Protein content
Levels of phosphorus
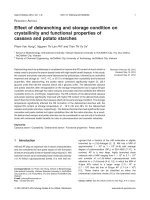
A critical scrutiny of the data (Table 1)
pertaining to protein content in grain and
straw indicate that protein content increased
significantly with increasing level of
phosphorus in A3 (100% RD of N & K +75%
P through SSP) during both the years as well
as in pooled analysis. Application of A3
increased the protein content in grain to the
extent of 7.96 and 2.93, 7.58 and 3.45, 7.67
and 3.23 per cent and in straw, the increase
was 8.18 and 3.56, 11.28 and 4.96, 10.11 and
4.26 per cent over A1 and A2, respectively.
While, the level A4 and A5 found at par with
each other.
Materials and Methods
Field Experiment conducted at Agriculture
Research farm Institute of Agricultural
Sciences,
Banaras
Hindu
University,
Varanasi, followed by laboratory analysis of
the plant and grain samples in the Department
of Soil Science and Agricultural Chemistry,
Institute of Agricultural Sciences, Banaras
Hindu University, Varanasi. Experiment
located between 25018’ North latitude and 800
36’ East longitude. Climate condition was
semi-arid to sub humid climate with moisture
deficit index between 20-40. The annual
rainfall of this region is about 1100 mm.
Solubilization of rock phosphate
It is evident from the data presented in Table
1 that the increasing level of applied rock
phosphate significantly increased the protein
content in grain and straw during both the
years as well as in pooled analysis.
Application of B3 increased the protein
content in grain by 32.49 and 16.26, 34.33
and 13.90, 33.46 and 15.10 per cent over B1
and B2, respectively. The corresponding
848
Int.J.Curr.Microbiol.App.Sci (2020) 9(8): 847-853
increase in case of straw was 30.34 and 3.74,
29.41 and 4.41, 30.08 and 4.07 per cent over
B1 and B2, respectively during both the years
and in pooled analysis. However, it was
statistically remained at par with B4.
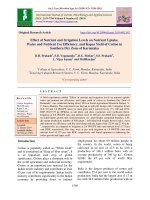
Solubilization of rock phosphate
It is evident from the data presented in Table
2 that the increasing level of applied rock
phosphate significantly increased the total
sugar content in grain and straw during both
the years as well as in pooled analysis.
Application of B3 increased the total sugar
content in grain by 57.83 and 20.19, 58.99
and 20.29, 58.41 and 20.24 per cent over B1
and B2, respectively. The corresponding
increase in case of straw was 98.79 and 29.13,
87.78 and 26.12, 94.19 and 27.48 per cent
over B1 and B2, respectively during both the
years and in pooled analysis. However, it was
statistically remained at par with B4.
Total sugar content
Levels of phosphorus
The critical examination of data (Table 2)
revealed that application of phosphorus the
total sugar content of grain and straw was not
affected significantly due to application of
phosphorus levels under both the years as
well as in pooled analysis.
Table.1 Effect of levels of Phosphorus and P solubilization by Spent Wash from Rock Phosphate
onProtein content of wheat
Treatments
Main plot
A1 Control (Absolute)
A2 100% RD of N &
+50% P through SSP
A3 100% RD of N &
+75% P through SSP
A4 100% RD of N &
+75% P through RP
A5 100% RD of N &
+100% P through RP
SEm+
CD (p=0.05)
CV (%)
Sub plot
B1 No SW
B2 RP:SW @ 1:10
B3 RP:SW @ 1:40
B4 RP:SW@ 1:80
SEm+
CD (p=0.05)
CV (%)
Protein content
2014-15
Grain
2015-16
Pooled
2014-15
Straw
2015-16
Pooled
K
11.72
12.27
12.00
12.48
11.86
12.37
2.69
2.81
2.66
2.82
2.67
2.82
K
12.63
12.91
12.77
2.91
2.96
2.94
K
12.44
12.79
12.62
2.88
2.93
2.90
K
12.54
12.84
12.69
2.90
2.94
2.92
0.07
0.24
2.05
0.08
0.27
2.32
0.06
0.16
2.19
0.03
0.10
3.79
0.04
0.14
5.40
0.03
0.08
4.67
10.31
11.75
13.66
13.56
0.06
0.17
1.87
10.37
12.23
13.93
13.88
0.06
0.18
2.16
10.34
11.99
13.80
13.72
0.05
0.13
2.32
2.34
2.94
3.05
3.01
0.02
0.05
2.31
2.38
2.95
3.08
3.05
0.03
0.07
3.85
2.36
2.95
3.07
3.03
0.02
0.05
3.99
849
Int.J.Curr.Microbiol.App.Sci (2020) 9(8): 847-853
Table.2 Effect of levels of Phosphorus and P solubilization by Spent Wash from Rock Phosphate
on Total Sugar of wheat
Treatments
Main plot
A1 Control (Absolute)
A2 100% RD of N & K +50% P through SSP
A3 100% RD of N & K +75% P through SSP
A4 100% RD of N & K +75% P through RP
A5 100% RD of N & K +100% P through RP
SEm+
CD (p=0.05)
CV (%)
Sub plot
B1 No SW
B2 RP:SW @ 1:10
B3 RP:SW @ 1:40
B4 RP:SW@ 1:80
SEm+
CD (p=0.05)
CV (%)
Total sugar content
2014-15
Grain
2015-16
Pooled
2014-15
Straw
2015-16
Pooled
4.16
4.25
4.31
4.25
4.29
0.09
NS
7.72
4.20
4.33
4.40
4.35
4.39
0.10
NS
8.28
4.18
4.29
4.36
4.30
4.34
0.07
NS
8.01
1.29
1.30
1.40
1.34
1.36
0.03
NS
8.63
1.33
1.38
1.44
1.41
1.42
0.03
NS
7.69
1.31
1.34
1.42
1.37
1.39
0.02
NS
8.16
3.13
4.11
4.94
4.82
0.06
0.17
5.40
3.17
4.19
5.04
4.95
0.06
0.17
5.93
3.15
4.15
4.99
4.89
0.05
0.14
7.02
0.82
1.27
1.64
1.61
0.02
0.05
5.27
0.90
1.34
1.69
1.65
0.02
0.06
6.17
0.86
1.31
1.67
1.63
0.02
0.05
7.13
Table.3 Effect of levels of Phosphorus and P solubilization by Spent Wash from Rock Phosphate
on Total Starch of wheat
Treatments
Main plot
A1 Control (Absolute)
A2 100% RD of N & K +50% P through SSP
A3 100% RD of N & K +75% P through SSP
A4 100% RD of N & K +75% P through RP
A5 100% RD of N & K +100% P through RP
SEm+
CD (p=0.05)
CV (%)
Sub plot
B1 No SW
B2 RP:SW @ 1:10
B3 RP:SW @ 1:40
B4 RP:SW@ 1:80
SEm+
CD (p=0.05)
CV (%)
Total starch content
2014-15
Grain
2015-16
Pooled
68.75
69.27
69.68
69.34
69.64
1.42
NS
7.07
69.09
70.02
70.42
69.95
70.32
1.64
NS
8.13
65.11
68.78
72.30
71.14
1.15
3.31
6.40
65.94
69.34
72.46
72.09
1.04
2.98
6.29
850
2014-15
Straw
2015-16
Pooled
68.92
69.64
70.05
69.64
69.98
1.08
NS
7.62
1.44
1.46
1.54
1.50
1.52
0.03
0.11
7.98
1.51
1.54
1.61
1.55
1.58
0.04
0.11
7.91
1.47
1.50
1.58
1.52
1.55
0.02
0.07
7.94
65.53
69.06
72.38
71.62
0.87
2.43
7.47
0.87
1.41
1.86
1.83
0.02
0.05
4.92
0.95
1.46
1.92
1.90
0.02
0.05
4.95
0.91
1.44
1.89
1.87
0.02
0.05
6.42
Int.J.Curr.Microbiol.App.Sci (2020) 9(8): 847-853
Fig.1 Effect of levels of Phosphorus and P solubilization by Spent Wash from Rock Phosphate
on protein content in grain and straw of wheat (Pooled mean)
Fig.2 Effect of levels of Phosphorus and P solubilization by Spent Wash from Rock Phosphate
on total sugar content in grain and straw of wheat (Pooled mean)
851
Int.J.Curr.Microbiol.App.Sci (2020) 9(8): 847-853
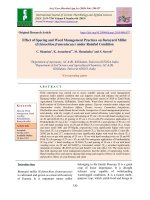
Fig.3 Effect of levels of Phosphorus and P solubilization by Spent Wash from Rock Phosphate
on total starch content in grain and straw of wheat (Pooled mean)
Total starch content
statistically remained at par with B4.
Levels of phosphorus
Acknowledgment
The critical examination of data (Table 3)
revealed that application of phosphorus the
total strach content in grain and straw was not
affected significantly due to application of
phosphorus levels under both the years as
well as in pooled analysis.
The authors are thankful to the head
Department of Soil Science & Agricultural
Chemistry, Institute of Agricultural Sciences,
Banaras Hindu University, Varanasi for
providing necessary facilities to conduct this
research work.
Solubilization of rock phosphate
References
It is evident from the data presented in Table
3 that the increasing level of applied rock
phosphate significantly increased the total
starch content in grain and straw during both
the years as well as in pooled analysis.
Application of B3 increased the total starch
content in grain by 11.04 and 5.12, 9.89 and
4.50, 10.45 and 4.81 per cent over B1 and B2,
respectively. The corresponding increase in
case of straw was 113.79 and 31.91, 102.11
and 31.51, 107.69 and 31.25 per cent over B1
and B2, respectively during both the years and
in pooled analysis. However, it was
Agricultural Statistics at a Glance, 2015-16
Chaturvedi, I. (2006). Effects of phosphorus
levels alone or in combination with
phosphate-solubilizing
bacteria
(Pseudomonas striata) and farmyard
manure on growth, yield and nutrient
uptake of wheat (Triticumaestivum).
Journal of Agriculture and Social
Sciences 2: 96-100.
Hedge, J.E. and Hofreiter, B.T. (1962) In:
Methods in Carbohydrate Chemistry.
Volume 17, (Eds.,) Whistler, R.L. and
BeMiller, J.N. Academic Press, New
852
Int.J.Curr.Microbiol.App.Sci (2020) 9(8): 847-853
York, p. 420.
Jiang ZongQing, Feng ChaoNian, Huang
LianLian, GuoWenShan, Zhu XinKai
and Peng YongXin (2006). Effects of
phosphorus application on dry matter
production and phosphorus uptake in
wheat (Triticumaestivum L). Plant
Nutrition and Fertilizer Science 5:
628-634.
Khalid, S., M. Shafi, S. Anwar, J. Bakht and
A. D. Khan (2004). Effect of nitrogen
and phosphorus application on the
yield and yield components of wheat.
Sarhad Journal of Agriculture 20(3):
347- 53.
Lowry, O.H., Rosebrough, N.J., Farr, A. and
Land Rordall, R.J. (1951) Protein
measurement with the Folin phenol
reagent. Journal of Biological
Chemistry193: 265-275
Zhang, M. J. D. Miao, R. X. K. Liu, Y.Y. Z.
Jun, Z. H. (2010). Effects of different
soil fertility levels and N application
rate on wheat yield and matter
production after rice. [Chinese].
Journal of Triticeae Crops 30(2):
330-336.
How to cite this article:
Balu Ram, Ramawatar Meena and Rajkumar Meena. 2020. Effect of levels of Phosphorus and
P Solubilization by Spent Wash from Rock Phosphate on Protein, Total Sugar and Total Starch
Contain in Grain and Straw of Wheat in an Inceptisol. Int.J.Curr.Microbiol.App.Sci. 9(08):
847-853. doi: />
853