Estimated yield forecasting of rice and wheat for central Uttar Pradesh using statistical modal
Bạn đang xem bản rút gọn của tài liệu. Xem và tải ngay bản đầy đủ của tài liệu tại đây (208.35 KB, 6 trang )
Int.J.Curr.Microbiol.App.Sci (2020) 9(8): 2490-2495
International Journal of Current Microbiology and Applied Sciences
ISSN: 2319-7706 Volume 9 Number 8 (2020)
Journal homepage:
Original Research Article
/>
Estimated Yield Forecasting of Rice and Wheat for Central Uttar Pradesh
using Statistical Modal
Naushad Khan, Ajay Kumar*, Vijay Dubey, C.B. Singh,
Sanjeev Kumar and Shubham Singh
Department of Agronomy, Chandra Shekhar Azad University of Agriculture & Technology,
Kanpur Uttar Pradesh, India
*Corresponding author
ABSTRACT
Keywords
Rice, Yield
forecast, Central
Uttar Pradesh,
Weather data and
SMW
Article Info
Accepted:
22 July 2020
Available Online:
10 August 2020
Twenty three years (1992-2015) weather data of rainfall (mm), Maximum and
Minimum temperature (0C), maximum and minimum relative humidity (%) and
yield data of rice and wheat crop for 12 districts were used for yield prediction
using statistical method under FASAL Project, Department of Agronomy,
Chandra Shekhar Azad University of Agriculture & Technology, Kanpur Uttar
Pradesh. The regression equation was generated for statistical method using SPSS
package. The models were validated using 2 year (2016 and 2017) data. The result
indicated that model explained 45 to 73 percent variation in rice crop yield and 49
to 74 percent variation in wheat crop in different districts. The F value 13.53
(Mathura) to 57.20 (Auraiya) variation for rice crop and 11.42 (Agra) to 54.51
(Mainpuri) variation for wheat crop was observed in different districts. The
percent standard error was between 90.67 (Farrukhabad) to 217.73 (Auraiya) for
rice crop and 153 (Mathura) to 252 (Kanpur Dehat) for wheat crop. This revealed
that the models can be used to some extent for yield prediction in different
districts of Central Uttar Pradesh.
Introduction
Crop acreage estimation and crop yield
forecasting are two components, which are
crucial for proper planning and policy making
in the agriculture sector of the country.
Estimation of crop yield in regional level is
the basis for planning of crop production
prospects at national level. Models based on
weather parameters can provide reliable
forecast of crop yield in advance of harvest
and also forewarning of pests and diseases
attack, so that suitable plant protection
measures could be taken up timely to protect
the crops (Agrawal and Mehta, 2007).
Agrometeorology
and
Land
based
observations (FASAL) is an important project
operational at Ministry of Agriculture,
Government of India in collaboration with
Space Application Centre (SAC), Institute of
2490
Int.J.Curr.Microbiol.App.Sci (2020) 9(8): 2490-2495
Economic Growth (IEG) and India
Meteorological Department (IMD). Under
this FASAL project, IMD in collaboration
with 46 Agromet Field Units (AM FU)
located at different parts of the country
develops intra-seasonal operational yield
forecast at district and state level for 13 major
crops of India during Kharif and Rabi seasons
using statistical model (Ghosh et al., 2014).
Rice and wheat are the major food grain crops
of Central Uttar Pradesh. The Central Uttar
Pradesh shares about 36% acreage and 35%
production of rice. 43% acreage and 44%
production of wheat in twelve districts of
Uttar Pradesh viz. Agra, Auraiya, Etawah,
Etah Farrukhabad, Hardoi, Kannauj, Kanpur
dehat, Kanpur Nagar, Mainpuri, Mathura and
Unnao falling under jurisdiction of the
AMFU, Kanpur under Chandra Shekhar Azad
University of Agriculture & Technology,
Kanpur which shares about 32% of rice
acreage and 30 % of rice production, 41% of
wheat acreage and 42% of wheat production
in Central Uttar Pradesh (Anonymous, 2010).
The present study was undertaken to
investigate the feasibility of estimating the
productivity of rice and wheat crops based on
weather variables using past weather and
yield records of different districts of Central
Uttar Pradesh.
Materials and Methods
Crop yield data of Rice and wheat for the
period of recent 23 years (1992-2015) were
used to develop yield forecasting models. The
weather data was used in standard
meteorological weeks (SMW) wise starting
from 27th to 38th SMW of each year i.e. the
period from transplanting to harvest of rice
and from 40th SMW of current year to 11th
SMW of next year from sowing to harvesting
of wheat. The variables used in this study
were weekly rainfall (mm), maximum and
minimum temperature (°C), RH- I
i.e.
morning relative humidity (%) and RH- II i.e.
afternoon relative humidity (%) for rice crop.
All the weather parameters together with solar
radiation data were used for wheat yield
prediction. Rainfall was not used as a
parameter for wheat forecasting. For selecting
the best regression equation among number of
independent variables, stepwise regression
procedure was adopted. Statistical Package
for Social Science (SPSS) computer software
was used for the analysis of data with
probability level of 0.05 to enter and 0.1 to
remove the variables. A regression model was
fitted considering the entered variables
obtained from individual stepwise regression
analysis to predict the yield of rice and wheat
for subsequent years. The multiple linear
stepwise regression analysis has been
developed on the basis of examination of
coefficients of determination (R2), Standard
Error (SE0 of estimates values resulted from
different weather variables. The F values are
used for the degree of accuracy of each
considered correlation to fit the measured
data. F value provides information on the long
term performance of the models. The best
agro meteorological indices were selected to
develop agro meteorological yield model for
the each district as per methodology given by
Ghosh et al., (2014). Yield forecast models
for all twenty three districts which produce
rice and wheat have been developed and their
performance s have been validated against the
observed year in 2015-16 and 2016-17.
Results and Discussion
Rice yield forecast
The yield variations explained by model
together with standard error are shown in
Table 1. Coefficient determination (R2) has
been significant at 5% probability level for
rice in all the twelve districts of Central Plain
Zone of Uttar Pradesh. The R2 was ranged
between 45% (Hardoi) to 73% (Farrukhabad).
2491
Int.J.Curr.Microbiol.App.Sci (2020) 9(8): 2490-2495
The percent F value was ranged between
13.53 (Mathura) and 57.20 (Auraiya),
However, the percent standard error was
ranged between 90.67 (Farrukhabad) and
217.73
(Auraiya).
The
best
agro
meteorological indices to incorporate in the
agro meteorological yield model for rice was
selected as, RH-I (Z41) for Agra district,
TIME for Auraya, Etawah, Farrukhabad,
Kanpur Dehat, Mainpuri district, TIME, RH-1
(Z41) for Etah, Tmax. x Tmin (Z121) for
Hardoi, Kannauj district, TIME, Rain (Z31)
for Kanpur district, Rain (Z31) for Mathura
district and TIME x RH I (Z141) for Unnao
district.
The validation of model for rice during the
year 2016 and 2017 are shown in Table 2.
Result revealed that in 2016, the models for
Agra (10.15%), Auraya (-5.26%), Etawah
(-5.15%), Etah (18.40%), Farrukhabad
(7.24%),
Hardoi
(11.02%),
Kannauj
(10.70%), Mainpuri (-1.68%) and Unnao
(-16.70%) districts have underestimated the
yield while over estimation was observed in
Kanpur Dehat (5.72%), Kanpur (6.30%), and
Mathura (1.56%) in 2016. Whereas, during
2017 Rice yield under estimated in all the
twelfth districts, models Auraya (-2.44%),
Etah (21.93%), Hardoi (21.78%), Kannauj
(19.80%), Mathura (28.23%) and Unnao
(-2.70%) and over estimated in Agra (9.54%),
Etawah (2.21%), Farrukhabad (8.69%),
Kanpur Dehat (8.37%), Kanpur (5.40%) and
Mainpuri (2.57%) districts. Models had less
than ± 10% error in rice yield prediction for
all districts during both the years. This has
indicated that the model can be used for
prediction of rice yield in above districts. The
result revealed that agrometeorological yield
model explained the yield variability due to
variations in temperatures, rainfall and
relative humidity during the different stages
(tillering, panicle initiation, booting and
physiological maturity). Maximum and
minimum temperatures were found common
agrometeorological indices for most of the
districts of this region. However, rainfall with
relative humidity is also proved important
agrometeorological indices for some of the
districts of Central Uttar Pradesh.
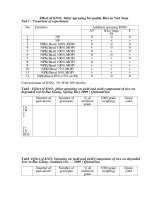
Table.1 Yield forecast models of rice for different districts of Central Uttar Pradesh
R2
SN
District
Equation
1
2
3
4
AGRA
AURAIYA
ETAWAH
ETHA
5
6
7
8
9
10
11
12
FARRUKHABAD
HARDOI
KANNAUJ
KANPUR DEHAT
KANPUR
MAINPURI
MATHURA
UNNAO
Y= 601+ 30.50*Z41
Y= 1927+45.67*TIME
Y=2035+ 31.97*TME
Y=2348
+27.03*TIME+30.09*Z41
Y=1887+ 24.28*TIME
Y= -1237+ 2.3*Z121
Y=-2102+3.90*Z121
Y= 17.98+32.20*TIME
Y=1529+25.20*TIME+2.37*Z31
Y=1816+33.32*TIME
Y=2187+5.82*Z31
Y=4063+0.73*Z141
2492
F
Std
Error
ERROR (%)
2016 2017
0.59
0.71
0.63
0.67
Forecast
yield
(Kg/ha)
2367
3206
2930
2431
32.71
57.20
40.76
20.42
146.52
217.73
180.55
153.07
10.15
-5.26
-5.15
18.40
0.73
0.45
0.52
0.57
0.62
0.64
0.55
0.56
2519
1659
1941
2700
2255
2716
2813
1979
56.31
17.78
24.91
29.82
14.83
38.80
13.53
29.70
90.67
7.24
8.69
184.73 11.02 21.78
185.20 10.70 19.80
212.63 5.72
8.37
186.80 6.30
5.40
181.42 -1.68 2.57
166.49 1.56 28.23
166.54 -16.70 -2.70
9.54
-2.44
2.21
21.93
Int.J.Curr.Microbiol.App.Sci (2020) 9(8): 2490-2495
Table.2 Validation of model for forecast of rice yield under different districts
of Central Uttar Pradesh
SN District
1
2
3
4
5
6
7
8
9
10
11
12
2016
2017
Observed Forecasted Error% Observed Forecasted Error%
2542
2284
10.15
2680
2424
9.54
AGRA
2959
3115
-5.26
3085
3160
-2.44
AURAIYA
2726
2866
-5.15
2964
2898
2.21
ETAWAH
2887
2355
18.40
3025
2361
21.93
ETHA
2663
2470
7.24
2732
2495
8.69
FARRUKHABAD
2314
2059
11.02
1297
1718
21.78
HARDOI
2684
2396
10.70
2987
2397
19.80
KANNAUJ
2796
2636
5.72
2912
2668
8.37
KANPUR
DEHAT
2493
2337
6.30
2504
2369
5.40
KANPUR
2606
2650
-1.68
2754
2683
2.57
MAINPURI
2346
2309
1.56
2451
1759
28.23
MATHURA
1858
2169
-16.70
2098
2155
-2.70
UNNAO
Table.3 Yield forecast models of wheat for different districts of Central Uttar Pradesh
R2
S.N. District
Equation
1.
AGRA
Y= 2834+0.38*Z241+0.5*Z351
0.52
2.
AURIYA
Y=3113+0.83*Z131
0.49
3105
21.33
184
22.31 12.08
3.
ETAWAH
Y=3136+17.26*Z51
0.52
2991
23.62
171
25.93 19.22
4.
ETHA
Y=2067+33154*TIME+8.50*Z51
0.74
2901
30.16
164
12.56
5.
FARRUKHABAD Y=2804+37.01*TIME
0.54
3804
26.5
243
4.87
6.
HARDOI
Y=2391+34.43*TIME
0.68
3321
47.63
169
7.
KANNAUJ
Y=2835+36.58*TIME
0.59
3833
32.23
201.8
8.
Y=1528+0.44*Z141
0.53
3461
24.71
252
26.79 15.09
9.
KANPUR
DEHAT
KANPUR
Y=1479+0.54*Z241
0.60
2549
31.79
184
35.10 29.67
10.
MAINPURI
Y=2665+35.62*TIME
0.71
3627
54.51
163
11.43
3.32
11.
MATHURA
Y=1755+1.55*Z121+18.46*TIME
0.68
3565
21.79
153
15.54
4.78
12.
UNNAO
Y=2001+37.42*TIME
0.62
3012
35.44
209
7.96
7.54
2493
Forecast
F
Std
ERROR
yield
Error 2016 2017
(Kg/ha)
3034
11.42 161.6 22.39 8.06
5.59
10.11
10.55 -0.39
4.47
0.31
Int.J.Curr.Microbiol.App.Sci (2020) 9(8): 2490-2495
Table.4 Validation of model for forecast of wheat yield for different districts
of Central Uttar Pradesh
SN
District
2016
2017
Observed Forecasted Error% Observed Forecasted Error%
1.
2.
3.
4.
5.
6.
7.
8.
9.
10.
11.
12.
AGRA
AURIYA
ETAWAH
ETHA
FARRUKHABAD
HARDOI
KANNAUJ
KANPUR DEHAT
KANPUR
MAINPURI
MATHURA
UNNAO
4080
4017
4140
3881
3921
3636
3925
4588
4065
4015
4104
3191
3167
3121
3067
3394
3730
3252
3750
3359
2638
3556
3466
2937
Wheat yield forecast
The yield variations explained by model for
wheat crop together with standard error are
shown in Table 3. Coefficient of determination
(R2) has been significant at 5% probability level
for wheat in all the twelve districts of central
Uttar Pradesh. The (R2) was ranged between 49
(Auriya) and 74% (Etawah). The percent F
value was ranged between 11.42 (Agra) and
54.51 (Mainpuri), However, the percent
standard error was ranged between 133.0
(Hathrus) and 252.0 (Kanpur dehat). The best
agrometeorological indices to incorporate in the
agrometeorological yield forecast model was
selected as Tmin x RH-I (Z241), Rain x RH-II
(Z351) for Agra, district, Tmax. x Rain (Z131)
for Auriya district, RH-II (Z51) for the Etawah,
Time, RH-II (Z51) for Etah district, TIME for
Farrukhabad, Firozabad, Hardoi, Kannauj,
Mainpuri and Unnao district, Tmin x RH-I
(Z241), Tmin. x RH-II (Z251) for Hathrus,
Tmax. x RH-I (Z141) for Kanpur dehat, Tmin.
x RH-II (Z241) for Kanpur and Tmax x Tmin
(Z121), TIME for Mathura district.
The validation of model for wheat during the
year 2016-17 and 2017-18 has been shown in
22.39
22.31
25.93
12.56
4.87
10.6
4.47
26.79
35.1
11.43
15.54
7.96
3528
3511
3598
3374
3421
3274
3798
3985
3714
3715
3687
3217
3244
3087
2906
3185
3767
3287
3786
3384
2612
3292
3511
2975
8.06
12.08
19.22
5.59
-10.11
-0.4
0.31
15.09
29.67
3.32
4.78
7.54
Table 4. Results revealed that the models
estimated error in Agra (22.39%), Auriya
(22.31%), Etawah (25.93%), Etah (12.56%),
Farrukhabad (4.87%), Hardoi (10.55%),
Kannauj (4.47%), Kanpur Dehat (26.79%),
Kanpur (35.10%), Mainpuri (11.43%), Mathura
(15.54%) and while over estimation was
observed for Kannauj (4.47%), Farrukhabad
(4.87%) and Unnao (7.96%) in 2016-17. During
2017-18 models underestimated in Auriya
(12.08%), Etawah (19.22%), Farrukhabad (10.10%), Hardoi (-0.39%), Kanpur Dehat
(15.09%), Kanpur (29.67%) and over estimated
in Agra (8.06%), Etah (5.59%), Kannauj
(0.31%), Mainpuri (3.39%), Mathura (4.75%)
and Unnao (7.54%) districts. Results also
indicated that the model has predicted that the
wheat yield with in±10% error in all the twelve
districts of Central Uttar Pradesh. Maximum &
minimum temperatures, RH-I and RH-II are
important agrometeorological indices for wheat
yield forecast. Predicted yield was closed to
observed yield, therefore, it can be used for
yield forecasting and planning purpose.
The results showed that agro-meteorological
yield model explained the yield variability due
to variations in minimum, maximum
2494
Int.J.Curr.Microbiol.App.Sci (2020) 9(8): 2490-2495
temperatures together with relative humidity
with respect to major wheat growing districts of
Agra, Etha, Kannauj, Mainpuri, Mathura and
Unnao. Whereas, variations in rain also
influenced in other districts where heat
cultivation is comparatively less intensive.
According to Singh et al, (2010) and Singh et
al., (2011). Over the past few years, the per
hectare yield of wheat in India has fallen due to
the temperature rising steadily in January,
February and March (a period most crucial for
the wheat crop). Maximum and minimum
temperatures are very sensitive weather
parameters for wheat crop, arise by 0.50C in
winter temperature is projected to reduce wheat
yield by 0.45 t ha-1 in India (Lal et al., 1998).
Wheat growing belts of this region are also
largely influenced by maximum and minimum
temperature prevailed during the cropping
season. Therefore, it can be infer that maximum
and minimum temperatures together with RH
found were significant weather parameters for
deciding wheat productivity in the region.
In conclusion, yield forecast has been done for r
ice and wheat crops for twelve districts of
Central Uttar Pradesh. The developed models
have reasonably good R2 between 45 to 73%
variation in rice crop yield and between 49 to
74% variation in wheat crop yield in different
districts. The F value between 13.53 to 57.20%
variation for rice crop and between 11.42 to
54.51% variation for wheat crop in different
districts. The percent standard error was
between 90.67 to 217.73 % for rice crop and
between 153 to 252 % for wheat crop. The
models were validated with ± 10% error in all
the twelve districts of Central Uttar Pradesh.
Therefore, it could be used for yield forecasting
satisfactorily for both crops and for all the
twelve districts of central plan zone of Uttar
Pradesh. Further, by and large, the maximum
and minimum temperatures in combination with
relative humidity have formed most important
agrometerological indices which can useful in
forecasting of yield of rice and wheat crop in
the region.
References
Agrawal, R and Mehta, S.C. (2007). Weather
based forecasting of crop yields, pests and
diseases-IASRI
models.
J.Ind.Soc.Agril.Statist., 61(2): 255-263.
Anonymous, (2010). Directorate of Economics
and Statistics, Department of Agriculture
and cooperation, India.
Ghosh,
K.,
Balasubramanian,
R.,
Bandopadhyay, S., Chattopadhyay, N.,
Singh, K.K. and Rathore, L. S. (2014).
Development of crop yield forecast
models under FASAL – a case study of
kharif rice in west Bengal. J.
Agrometerology, 16 (1): 1-8.
Lal, M., Singh, K.K., Rathore, L.S., Srinivasan,
G. and Saseendran, S.A. (1998).
Vulnerability of rice and wheat yields in
NW india to future changes in climate.
Agric. For, Meterol., 89:101-114.
Singh, H., Singh, K.N., Hasan, B. and Khan,
A.A. (2010). Agro climate models for
prediction of growth and yield of rice
(Oryza sativa) under temperate Kashmir
conditions. Indian J. Agric. Sci., 80(3):
254-257.
Singh, K., Sharma, S.N. and Sharma, Y.,
(2011). Effect of high temperature on
yield attributing traits in Bread Wheat.
Bangladesh J. Agric. Res., 36(3): 415426.
How to cite this article:
Naushad Khan, Ajay Kumar, Vijay Dubey, C.B. Singh, Sanjeev Kumar and Shubham Singh. 2020.
Estimated Yield Forecasting of Rice and Wheat for Central Uttar Pradesh using Statistical Modal.
Int.J.Curr.Microbiol.App.Sci. 9(08): 2490-2495. doi: />
2495