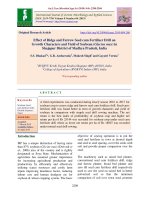
Evaluation of soybean [Glycine max (L.) Merill] for phenology, physiology, growth, productivity and quality under various herbicidal treatments
Bạn đang xem bản rút gọn của tài liệu. Xem và tải ngay bản đầy đủ của tài liệu tại đây (181.34 KB, 7 trang )
Int.J.Curr.Microbiol.App.Sci (2020) 9(8): 2176-2182
International Journal of Current Microbiology and Applied Sciences
ISSN: 2319-7706 Volume 9 Number 8 (2020)
Journal homepage:
Original Research Article
/>
Evaluation of Soybean [Glycine max (L.) Merill] for Phenology, Physiology,
Growth, Productivity and Quality under Various Herbicidal Treatments
Supriya Debnath1*, A. S. Gontia1, Mrunal Ghogare1, A. K. Jha2, Anubha Upadhyay1,
Preeti Sagar Nayak1 and Zuby Gohar Ansari1
1
Department of Plant Physiology, 2Department of Agronomy, Jawaharlal Nehru Krishi
Vishwa Vidyalaya, Jabalpur, Madhya Pradesh, India
*Corresponding author
ABSTRACT
Keywords
Propaquizafop,
Quizalofop,
Imazethapyr, Hand
weeding, Yield
Article Info
Accepted:
20 July 2020
Available Online:
10 August 2020
A research experiment was conducted at the Research Farm, Department of Agronomy,
JNKVV, Jabalpur (M.P.) during Kharif season of 2018 which was laid out in a Completely
Randomized Block design with three replications. Seven treatments comprised of
combinations as well as single application of herbicides T 1 (Propaquizafop @ 50 gha-1), T2
(Propaquizafop @ 60 gha-1), T3 (Propaquizafop @ 75 gha-1), T4 (Propaquizafop +
Imazethapyr @ (75 + 50) gha-1), T5 (Quizalofop @ 70 gha-1), T6 (Hand weeding @ 20 and
40 DAS) and T7 (Weedy Check). The results revealed that treatment T 2 had the longest
(56.75 days) span of reproductive phase, whereas the treatment T 4 had the shortest (55.25
days) span. T2 had the longest span of seed filling period (28.92 days). On the other hand,
treatments T4 and T5 (27.33 days) indicated lowest time for seed filling duration. T6
recorded maximum biological yield (16.44 gplant -1 and 5479 kgha-1) which ultimately
reflected in its maximum seed yield (5.74 gplant-1 and 1912 kgha-1). The maximum fat
(21.16%), carbohydrates (18.76%) and ash contents were registered in treatment T6
(5.64%), whereas crude fiber (8.34%) and proteins (40.12%) were registered in T 4.
Introduction
Soybean [Glycine max (L.) Merill] is known
as the "GOLDEN BEAN" of the 20th Century.
It accounts approximately 50% of total
production of oilseed crops in the world. It
has emerged as one of the important
commercial crops in many countries. Soybean
is also known as the “Miracle Crop” because
of its multiple uses and qualities as it has been
used as pulse as well as oilseed crop. It has
great potential as an exceptionally nutritive
and very rich protein food. Soybean contains
35-40% protein, 19% oil, 35% carbohydrate
(17% of which is a dietary fibre), 5% minerals
and several other components including
vitamins (Liu, 1997). Owing to its amino
acids composition, the protein of soybean is
called a complete protein. In India, soybean
cultivation is done in 10.56 million hectares
with the annual production of 11.39 million
metric tons and average productivity of
1078.6 kg hectare-1 (MOA & FW, 2018).
Among different states of India, Madhya
2176
Int.J.Curr.Microbiol.App.Sci (2020) 9(8): 2176-2182
Pradesh occupies the first position in area i.e.
54.09 lakh hectares and production of 59.17
lakh million tons with average productivity of
1094 kg ha-1 (SOPA, 2018). In M.P., farmers
apply high seed rate and narrow spacing of
plant and rows to avoid risk of less plant
population. Farmers in field apply more than
25 per cent more seed than needed. This is
because of for poor equipment or lack of
calibration. Some of it is just habit, but some
producer feels that the high seeding rates are
needed for better weed control. The low
productivity of the crop in the state is due to
several constraints, one of the major
constraints in soybean production is cropweed competition (Vollmann et al., 2010);
being a rainy season crop, as it is heavily
infested with grasses, sedges and broadleaved
weeds. The weed control practices have been
exercised for the long time. Recently
developed herbicides response to the weeds,
crop physiological traits, productivity and
quality aspects in soybean needs to be
ascertained. Keeping in view of the above
facts, the present investigations are
undertaken
Check) were laid out in Completely
Randomized Block Design with three
replications. Seeds and soybean (JS 20-29)
were sown in the field adopting recommended
cultural
practices.
The
phenological
observations were noted from three selected
and tagged plants throughout the growth
period through daily visual observations.
Materials and Methods
Results and Discussion
An experiment was conducted to evaluate the
effect of various herbicidal treatments on
phenophasic development and productivity
with biochemical aspects in soybean during
Kharif season of the year 2018 at the
Research Farm of Department of Agronomy,
JNKVV, Jabalpur (M.P.). Estimation of
biochemical constituent was done in the
laboratory of the Department of Plant
Physiology, JNKVV, Jabalpur. The seven
weed control treatments comprising of T1
(Propaquizafop
@
50
gha-1),
T2
-1
(Propaquizafop
@
60
gha ),
T3
(Propaquizafop
@
75
gha-1),
T4
(Propaquizafop + Imazethapyr @ (75 + 50)
gha-1), T5 (Quizalofop @ 70 gha-1), T6 (Hand
weeding @ 20 and 40DAS) and T7 (Weedy
Phenophases
The ash content in the seed sample was
estimated according to AOAC (1980). Total
carbohydrates in the samples were estimated
by the method as described by Sadasivam and
Manickam, 1992. The nitrogen content was
estimated by micro Kjeldhal method
(A.O.A.C., 1980) and the fat content in the
sample was estimated by pelican equipment
socs plus based on principle of Soxhlet’s
extraction method as described in AOAC
(1980).The seed yield g plant-1 and kg ha-1
was recorded after threshing, cleaning and
drying the seeds. It is also known as
economical yield. Biological yield is the total
yield of crop including economic yield and
the straw yield. The biological yield per plant
was recorded after harvesting.
Days to flower initiation
The investigations (Table 1) indicated that
treatments T3, T5 and T6 (35.00 days) acquired
minimum days to attain flower initiation stage
which is a beneficial trait for prolonging the
reproductive phase. On the other hand,
treatment T1 (36.00 days) took the maximum
time to record flower initiation. It is
worthwhile to indicate that the treatments had
not too much variation for this trait. The seed
yield was positively and directly influenced
by days of flower initiation (Kumar et al.,
2012).
2177
Int.J.Curr.Microbiol.App.Sci (2020) 9(8): 2176-2182
Table.1 Phenophases in soybean during reproductive growth period under different herbicidal treatments
Treatments
T1 = Propaquizafop @ 50 gha-1
T2 = Propaquizafop @ 60 gha-1
T3 = Propaquizafop @ 75 gha-1
T4 = Propaquizafop +
Imazethapyr @ (75+50) gha-1
T5 = Quizalofop @ 70 gha-1
T6 = Hand Weeding @ 20 and 40
DAS
T7= Weedy Check
SEm±
CD 5%
Days to
flower
initiation
36.00
35.67
35.00
35.33
Days to 50%
flowering
Days to pod
formation
Days to seed
Formation
39.50
37.67
39.00
39.00
Days to
completion
of flowering
46.75
48.75
47.75
48.25
Days to
maturity
64.25
63.50
64.75
63.25
Days to
physiological
maturity
76.25
76.75
76.75
78.75
55.25
54.25
54.25
55.25
35.00
35.00
38.00
38.00
47.75
48.50
54.25
55.75
64.25
62.50
76.25
75.75
91.58
90.58
35.00
0.22
0.68
39.00
0.34
1.06
46.25
0.47
1.45
52.25
0.46
1.41
64.50
0.51
1.57
75.25
0.47
1.43
91.08
0.39
1.19
92.42
92.42
91.42
90.58
Table.2 Productivity in soybean under various herbicidal treatments with biochemical constraints
Treatments
T1
T2
T3
T4
T5
T6
T7
SEm±
CD 5%
Ash
(%)
5.24
4.88
5.23
5.12
5.26
5.64
4.89
0.07
0.23
Crude fiber
(%)
6.37
6.14
8.12
8.34
6.52
7.65
6.43
0.23
0.69
Carbohydrate
(%)
17.56
17.81
18.39
18.48
17.77
18.76
16.44
0.34
1.05
Protein
(%)
38.06
38.43
38.36
40.12
38.63
39.3
37.09
0.45
1.37
2178
Fat
(%)
18.23
19.28
19.45
20.57
18.88
21.16
17.35
0.26
0.81
Seed yield
g plant-1
Kgha-1
3.40
1132
4.92
1640
5.09
1698
5.50
1832
4.30
1434
5.74
1912
2.20
732
0.23
49.66
0.71
153.0
Biological yield
gplant-1
Kg ha-1
11.15
3716
15.71
5237
15.69
5231
16.02
5340
12.99
4329
16.44
5479
8.38
2792
0.50
109.54
1.56
337.54
Int.J.Curr.Microbiol.App.Sci (2020) 9(8): 2176-2182
Days to 50% flowering
Days to seed formation
The results showed (Table 1) that treatments
T3, T4 and T7 (39.00) required maximum time
for completion of 50% flowering. On the
other hand, lowest time was recorded in T2
(37.67). This suggested that the treatments
didn’t indicate a similar pattern in respect of
days to flower initiation and completion of
50% flowering. The pattern of flower
production, pod retention, number of flowers
produced and percentage of flowers and pods
abscised varied with cultivars (Zaiter and
Barakat, 1995).
The present study showed (Table 1) that
treatment T6 (62.50 days) had the earliest seed
formation which is a beneficial trait for
enhancing economic productivity in crop
plants. However, treatment T3 (64.75 days)
had delayed seed formation. Normally early
seed formation is positively correlated with
the seed productivity provided the seed filling
rate is at optimum speed.
Days to completion of flowering
The investigations indicated (Table 1) that
treatment T7 (46.25 days) took minimum time
for completion of flowering, whereas
treatment T2 (48.75 days) required maximum
time for completion of flowering.
The pattern from flower initiation to
completion of flowering responded variably
in different treatments. Flowering was started
at 45 to 50 DAS, depending on genotypes
(Khan and Khalil, 2010).
Days to pod formation
Treatment T6 (55.75 days) registered (Table
1) maximum time for formation of pods. On
the other hand, T7 (52.25 days) needed
minimum time to attain this stage. Earlier
investigations showed that early pod
formation resulted in high productivity which
contradicts
the
result
of
present
investigations.
The weed competition is one of the most
important causes of yield loss (30 to 80%) in
kharif soybean and modification in source
sink balance could increase assimilates
distribution towards the pods (Yaduraju,
2016).
Days to physiological maturity
In the present study (Table 1), treatment T7
(75.23 days) recorded the minimum and T4
(78.75 days) maximum time to achieve this
stage. The real physiological maturity may be
advantageous if the seeds are harvested at that
particular stage (Gontia et al., 1995).
Days to maturity
The study showed (Table 1) that treatments T4
and T6 (90.58 days) attained the maturity
earliest which has the advantage of avoiding
shattering which sometimes takes place when
the crop is harvested at the later stages.
Treatment T1 and T2 (92.42 days) took
maximum time for reaching the maturity. The
seed yield plant-1 was found to be
significantly and positively correlated with
days to maturity (Kumar et al., 2004). Among
morphological traits under water stress
conditions, the days to maturity showed the
maximum reduction (94%) (Shadakshari et
al., 2014).
Seed yield (g plant-1 and kg ha-1)
The results indicated (Table 2) that all the
treatments significantly increased seed yield
in soybean. The results were in accordance
with the findings of Deore et al., (2007),
Pradhan et al., (2010) and Tuti and Das
(2011). The improvement in the yield and
2179
Int.J.Curr.Microbiol.App.Sci (2020) 9(8): 2176-2182
economic parameters were obtained under
different weed management practices in
soybean (Raskar and Bhoi, 2002).
Biological yield (g plant-1 and kg ha-1)
The present study (Table 2) indicated that the
treatments T6 (16.44 gplant-1 and 5479 kg ha1
) and T7 (16.02 gplant-1 and 2792 kgha-1)
recorded higher magnitudes for biological
yield. It is further mentioned that higher
biological yield is not always indicative of
higher economic yield as it depends on
allocation of photoas similates into the
vegetative or reproductive parts of the plant.
Under herbicidal treatments the highest seed
yield (24.46 qha-1) and straw yield of soybean
were also recorded in Imazethapyr @ 0.100
kg a.i.ha-1 + Quizalofop ethyl @ 0.075 kg a.i.
ha-1 as PoE (Prachand et al., 2014).
Biochemical constituents
Ash (%)
The present study (Table 2) indicated that
treatment T6 (6.54%) recorded the highest and
T2 (4.88%) lowest ash contents, respectively.
In ten vegetable soybean genotypes along
with the control the ash content was ranged
from 1.49-1.74 % (Salmani et al., 2012).
Crude fiber (%)
In ten vegetable soybean genotypes along
with the control the fiber content was ranged
from 1.89-2.69 %. On the other hand, in the
present investigations (Table 2), the crude
fiber was found to be in the range of 8.34% in
T4 and 6.4% in T2, respectively.
Carbohydrate (%)
The present study (Table 2) indicated that the
treatments T6 (18.76%) and T4 (18.48%)
recorded the higher magnitudes which is
beneficial trait for all the aspects. The
carbohydrates provide the energy for growth
and various functions in the plant. In ten
vegetable soybean genotypes along with the
control the carbohydrate content was ranged
from 5.88-7.93 % (Salmani et al., 2012).
Protein (%)
The protein is very important for maintaining
structural integrity of plant cells and also acts
as energy source under starvation. The present
study (Table 2) indicated that treatments T4
(40.12%) and T6 (39.3%) had the higher
magnitudes for protein contents, whereas
treatment T7 recorded the minimum
(37.09%).However, Salmani et al., (2012)
reported 12.32 - 14.96 % protein content in
ten vegetable soybean genotypes. The dry
matter and yield components had strong
negative association with protein content.
Variety
Awassa-95
(45%)
recorded
significantly higher protein contents than
variety Belessa-95 (40%) (Pal et al., 2012).
Fat (%)
The present investigations showed (Table 2)
that treatment T7 had the maximum (21.16)
fat %, whereas the lowest (17.35%) was
found in T7. The promising varieties of
soybean have been found to contain the oil in
the range of 19-24 percent oil concentrates
increase both herbicidal effectiveness and the
possibility of soybean injury (Ariunaa et al.,
2016). The yield obtained by early planting
was positively correlated with the oil contents
(Naoki et al., 2016).
In conclusion the studies pertaining
phenophases indicated that treatment T2 had
the longest (56.75 days) span of reproductive
phase, whereas the treatment T4 had the
shortest (55.25 days) phase of reproductive
phase. T2 had the longest span of seed filling
2180
Int.J.Curr.Microbiol.App.Sci (2020) 9(8): 2176-2182
period (28.92 days). On the other hand,
treatments T4 and T5 (27.33 days) indicated
lowest time for seed filling duration.
Treatment T6 (Hand Weeding @ 20 and 40
DAS) out yielded maximum seed yield (5.74
g plant-1 and 1912 kg ha-1) and biological
yield (16.44 gplant-1 and 5479 kgha1
).Treatment
T4
[Propaquizafop
+
-1
Imazethapyr @ (75 + 50) gha ] was adjudged
the second in yield performance (5.50 gplant-1
and 1832 kgha-1) and biological yield (16.02
gplant-1 and 5340 kgha-1). Treatment T7
indicated the lowest yield (2.20 gplant-1 and
732 kgha-1) owing to poor performance of all
yield components. The maximum fat
(21.16%), carbohydrates (18.76%) and ash
contents were registered in treatment T6 (5.64
%), whereas crude fiber (8.34 %) and proteins
(40.12 %) were in T4.
Acknowledgement
The Authors are thankful to Department of
Plant Physiology and Department of
Agronomy, JNKVV, Jabalpur for their helpful
and constant guidance during the course of
investigation.
References
AOAC.Official methods of analysis, 13th ed.
Association of official Analytical
chemists Washington DC, 1980, 376384.
Ariunaa O, Otgonsuren M and Bayarsukh N.
Effect of chemical weed control of
soybean (Glycine max L.) field in
Mongolia.
International
Journal
Advanced
Research
Biological
Sciences 2016; 3(1): 192-198.
Deore NR, Solanke AV, Shete BT, Tambe
AD and Nikam AS. Chemical Weed
Control in Soybean. Annals of Plant
Physiology. 2007; 21(1): 75-77
Gontia, A.S., Nigam, P.K., Sonakia, V.K. and
Dwivedi, S.K. Identification of
morphological
indices
of
physiological maturity in soybean
genotypes.
Indian
Journal
of
Agricultural Sciences 1995; 65 (6):
414 -18.
Khan A and Khalil A. Effect of leaf area on
dry matter production in aerated
mungbean seed.International Journal
Plant Physiology and Biochemistry
2010. 2: 52-61.
Kumar R, Ravikant K and Ojha CB.Character
association analysis in mung bean.
Legume Research 2004; 27(1):32-36.
Liu KS. Chemistry and Nutritional Value of
Soybean Components In Soybeans.
Chemistry,
Technology
and
Utilization, Liu, K.S. (Ed.).Chapman
and Hall, New York, 1997, USA 25113.
MOA & FW (Ministry of Agriculture and
Farmers Welfare).2018.Directorate of
Economics & Statistics.
Naoki M, Koichiro F and Shinori T. Effects
of early planting and cultivars on the
yield and agronomic traits of soybeans
grown in south-western Japan Plant
Production Science 2016; 39-43.
Pal Daniel, Markos UR and Uragie Elias. Dry
matter partitioning, nodulation and
seed traits of medium and late
maturing soybean varieties as affected
by planting pattern and plant density.
Journal of Agricultural Science and
Technology 2012; 2(1):142-150.
Prachand S, Kalhapure A and Kubde K. Weed
management in soybean with pre and
post-emergence herbicides Indian
Journal of Weed Science 2014; 47(2):
163–165.
Pradhan SS, Kolhe VS and Singh V. Studies
of weed control efficiency by
application
of
post-emergence
herbicides in soybean in Chhattisgarh
plain. Indian Journal of Weed Science
2010; 42(1&2): 101-103.
Raskar BS and Bhoi PG. Bio-efficacy and
2181
Int.J.Curr.Microbiol.App.Sci (2020) 9(8): 2176-2182
phytotoxicity
of
pursuit
plus
herbicides against weeds in soybean
(Glycine max L.). Indian Journal of
Weed herbicides against Science
2002; 34(1&2): 50-52.
Sadasivam S and Manickam A. Biochemical
methods for agricultural sciences
1992; 12-13.
Salmani Z, Vijayalakhsmi D and TY.
Screening of selected vegetable
soybean genotypes for nutrient and
anti-nutrient factors. Journal of
Dairying, Foods and H.S 2012;
31(2):142-145.
Shadakshari TV, Yathish KR, Kalaimagal T,
Gireesh C, Gangadhar K and Jaggal S.
Morphological response of soybean
under water stress during pod
development stage. Legume Research
2014; 37(1): 37–46.
SOPA.The Soybean Processors Association
of India 2018.Tuti MDI and Das TK.
Sequential application of metribuzin
on weed control, growth and yield of
soybean (Glycine max) Indian Journal
of Agronomy 2011; 56 (1): 57-61.
Vollmann J, Wagentristl H and Hartl W. The
effects of simulated weed pressure on
early maturing Soybean. European
Journal of Agronomy 2010; 32: 24348.
Yaduraju A, Malik RK, Punia SS. Studies on
carry-over effects of herbicides
applied in wheat on the succeeding
crop in rotation. Indian Journal of
WeedScience2016; 36(1&2): 15-18.
Zaiter HZ and Barakat SA. Flower and pod
abortion in chickpea as affected by
sowing date and cultivar. Canadian
Journal of Plant Science 1995; 75:
321-327.
How to cite this article:
Supriya Debnath, A. S. Gontia, Mrunal Ghogare, A. K. Jha, Anubha Upadhyay, Preeti Sagar
Nayak and Zuby Gohar Ansari. 2020. Evaluation of Soybean [Glycine max (L.) Merill] for
Phenology, Physiology, Growth, Productivity and Quality under Various Herbicidal
Treatments. Int.J.Curr.Microbiol.App.Sci. 9(08): 2176-2182.
doi: />
2182