Massively parallel sequencing fails to detect minor resistant subclones in tissue samples prior to tyrosine kinase inhibitor therapy
Bạn đang xem bản rút gọn của tài liệu. Xem và tải ngay bản đầy đủ của tài liệu tại đây (1.96 MB, 14 trang )
Heydt et al. BMC Cancer (2015) 15:291
DOI 10.1186/s12885-015-1311-0
RESEARCH ARTICLE
Open Access
Massively parallel sequencing fails to detect minor
resistant subclones in tissue samples prior to
tyrosine kinase inhibitor therapy
Carina Heydt1*, Niklas Kumm2, Jana Fassunke1, Helen Künstlinger1, Michaela Angelika Ihle1, Andreas Scheel1,
Hans-Ulrich Schildhaus3, Florian Haller2, Reinhard Büttner1, Margarete Odenthal1, Eva Wardelmann4
and Sabine Merkelbach-Bruse1
Abstract
Background: Personalised medicine and targeted therapy have revolutionised cancer treatment. However, most
patients develop drug resistance and relapse after showing an initial treatment response. Two theories have been
postulated; either secondary resistance mutations develop de novo during therapy by mutagenesis or they are
present in minor subclones prior to therapy. In this study, these two theories were evaluated in gastrointestinal
stromal tumours (GISTs) where most patients develop secondary resistance mutations in the KIT gene during
therapy with tyrosine kinase inhibitors.
Methods: We used a cohort of 33 formalin-fixed, paraffin embedded (FFPE) primary GISTs and their corresponding
recurrent tumours with known mutational status. The primary tumours were analysed for the secondary mutations
of the recurrences, which had been identified previously. The primary tumours were resected prior to tyrosine kinase
inhibitor therapy. Three ultrasensitive, massively parallel sequencing approaches on the GS Junior (Roche, Mannheim,
Germany) and the MiSeqTM (Illumina, San Diego, CA, USA) were applied. Additionally, nine fresh-frozen samples
resected prior to therapy were analysed for the most common secondary resistance mutations.
Results: With a sensitivity level of down to 0.02%, no pre-existing resistant subclones with secondary KIT mutations
were detected in primary GISTs. The sensitivity level varied for individual secondary mutations and was limited by
sequencing artefacts on both systems. Artificial T > C substitutions at the position of the exon 13 p.V654A mutation, in
particular, led to a lower sensitivity, independent from the source of the material. Fresh-frozen samples showed the
same range of artificially mutated allele frequencies as the FFPE material.
Conclusions: Although we achieved a sufficiently high level of sensitivity, neither in the primary FFPE nor in the
fresh-frozen GISTs we were able to detect pre-existing resistant subclones of the corresponding known secondary
resistance mutations of the recurrent tumours. This supports the theory that secondary KIT resistance mutations
develop under treatment by “de novo” mutagenesis. Alternatively, the detection limit of two mutated clones in
10,000 wild-type clones might not have been high enough or heterogeneous tissue samples, per se, might not
be suitable for the detection of very small subpopulations of mutated cells.
Keywords: NGS, Parallel sequencing, Sensitive methods, GIST, Pre-existing, Minor subclone, Low frequency mutation,
Resistance
* Correspondence:
1
Institute of Pathology, University Hospital Cologne, Kerpener Str. 62, 50937
Cologne, Germany
Full list of author information is available at the end of the article
© 2015 Heydt et al.; licensee BioMed Central. This is an Open Access article distributed under the terms of the Creative
Commons Attribution License ( which permits unrestricted use, distribution, and
reproduction in any medium, provided the original work is properly credited. The Creative Commons Public Domain
Dedication waiver ( applies to the data made available in this article,
unless otherwise stated.
Heydt et al. BMC Cancer (2015) 15:291
Background
In recent years, personalised cancer medicine and the development of receptor tyrosine kinase inhibitors as well as
monoclonal antibodies for targeted therapies led to dramatic improvements in cancer treatment and patient care.
Nonetheless, most patients develop drug resistance and
relapse after an initial treatment response [1,2]. Numerous
studies have investigated the underlying mechanisms of
drug resistance and showed, among others facts, that secondary mutations of the gene encoding the target protein
are responsible for drug resistance [3,4]. The emergence
of secondary gene mutations in a heterogeneous tumour
population follows the Darwinian law. Thus far, it is not
entirely understood if these mutations develop by means
of mutagenesis during therapy or if secondary gene mutations are present in pre-existing minor subclones in a
tumour subpopulation and are selected for during therapy
[5,6]. Sensitive methods as well as mathematical models,
like the Luria-Delbrück model, led to the identification of
pre-existing resistant subclones prior to therapy in some
tumour entities: In non-small cell lung cancer the EGFR
resistance mutation p.T790M and in colorectal carcinoma
secondary KRAS mutations down to a frequency of 0.01%
[7,8]. In this study, primary and secondary gastrointestinal stromal tumours (GISTs) were analysed. 75 – 80%
of GISTs are characterised by activating mutations in
the KIT gene [9]. Primary unresectable or metastatic
KIT positive GISTs are commonly treated with the receptor tyrosine kinase inhibitor imatinib (Glivec®, Novartis
Pharma). After an initial treatment response, nearly half of
the patients show tumour progression within two years
[10,11]. The most common resistance mechanism is the
acquisition of secondary resistance mutations in the KIT
gene [11,12]. It is still unknown whether the secondary
resistance mutations pre-exist in minor subclones or
develop “de novo” during therapy [5,11,13-15]. This study
investigated, using the currently available ultrasensitive
methods, if secondary KIT mutations pre-exist in minor
subclones in GISTs. For this approach, three massively parallel sequencing assays were used on the GS Junior (Roche,
Mannheim, Germany) and on the MiSeq™ (Illumina, San
Diego, CA, USA). The detection of pre-existing resistant
subclones would be a crucial contribution to the choice of
treatment course. Primary and secondary KIT mutations
could be targeted simultaneously by a combination of tyrosine kinase inhibitors. Thus, tumour growth and progression due to resistances could be prevented.
Methods
Cases and immunohistochemistry
33 cases of corresponding primary and secondary formalinfixed and paraffin embedded (FFPE) GISTs with known
mutational status were selected retrospectively from the
GIST and Sarcoma Registry Cologne/Bonn (Table 1).
Page 2 of 14
FFPE tissue samples were obtained as part of routine
clinical care under approved ethical protocols complied
with the Ethics Committee of the Medical Faculty of the
University of Cologne, Germany and informed consent
from each patient. Histological specimens were evaluated
by board certified senior pathologists specialised in soft
tissue pathology (E. W., H.-U. S. or R. B.). The diagnosis was based on morphology and immunohistochemistry against CD117, CD34, BCL2 (all Dako) and DOG1
(Spring Bioscience) as described previously [11,16]. The
mutational status of all samples was routinely analysed
by Sanger sequencing and high resolution melting analysis as described previously [5,16,17] (Table 1). Two cases
(case 13 and 31) showed a high polyclonal evolution of
multiple secondary KIT mutations.
From the 33 cases, the tumour regions of five cases
were divided into a total of 52 subregions of about the
same size. The subregions defined for this study were selected after re-examination of their immunohistochemical
staining pattern by a board certified senior pathologist
(E. W.).
Additionally, nine fresh-frozen GISTs (seven primary
GISTs and two metastases) with known mutational status
were selected from the registry of the Institute of Pathology,
University Hospital Erlangen (Table 2). All nine samples
had been collected prior to therapy.
Quantitative immunohistochemistry
Quantitative immunohistochemistry was performed by
whole-slide scanning with a resolution of 0.22 μm/pixel
(Pannoramic 250, 3DHistech, Budapest, Hungary) and
analysed with ImageJ [18]. For each subregion, three fieldsof-view were analysed at a 200x magnification covering
1.85 mm2 and >500 tumour cells. Staining intensity was
calculated by colour deconvolution.
DNA Extraction
Six sections of 10 μm thickness were cut from FFPE tissue
blocks. After deparaffinisation, tumour areas were macrodissected from unstained slides. The tumour area was
marked on a haematoxylin-eosin (H&E) stained slide by
a senior pathologist (E. W., H.-U. S.). DNA was extracted
with the MagAttract® DNA Mini M48 Kit (Qiagen,
Hilden, Germany) on the BioRobot® M48 (Qiagen). Samples collected before the year 2010 were extracted manually with the QIAamp® DNA Mini Kit (Qiagen). DNA
extraction of the subregions were performed with the
Maxwell® 16 FFPE Plus Tissue LEV DNA Purification Kit
(Promega, Mannheim, Germany) on the Maxwell® 16
(Promega). Fresh-frozen tissues were extracted with the
DNeasy® Blood & Tissue Kit (Qiagen) (Figure 1). All extraction procedures were performed following the manufacturers’ instructions.
Heydt et al. BMC Cancer (2015) 15:291
Page 3 of 14
Table 1 Clinical and pathological data and mutational status of 33 primary GISTs with known recurrent lesions
Primary tumour
Recurrent lesion
Case CD CD BCL2 DOG1 Tumour
No. 117 34
cell type
Sex Age Localisation
Primary mutation
1
+
+
+
NA
Spindle
M
80
EGIST
11: p.W557_V559delinsF
2
+
+
-
NA
Spindle
F
59
Small intestine 11: p.W557_E561del
Case Secondary mutation
No.
1a
13: p.V654A
2a
13: p.V654A
2b
17: Y823D
2c
13: p.V654A
3
+
(+)
(+)
NA
Mixed
M
45
Stomach
11: p.K550_V555delinsL
3a
17: p.D820Y
4
+
+
+
NA
Spindle
F
44
Peritoneum
11: p.W557_V560delinsC
4a
13: p.V654A
4b
13: p.V654A
17: p.D820E
5
+
+
+
NA
Epitheloid F
66
Peritoneum
5a
13: p.V654A
6
+
+
+
NA
Spindle
F
28
Small intestine 11: N567_L576delinsI
11: p.V559A
6a
17: p.D820G
7
+
(+)
(+)
NA
Spindle
M
66
Peritoneum
11: p.Q556_W557del
7a
13: p.V654A
8
+
+
+
+
Spindle
F
41
Stomach
11: p.[V560G(;)N566D]
8a
13: p.V654A
+
9
+
+
+
Mixed
M
44
Stomach
11: p.K550_K558del
9a
14: p.T670I
10
+
NA NA
+
Spindle
M
67
NA
11: p.V559G
10 a
17: p.D820Y
11
+
+
+
Spindle
F
65
Stomach
11: p.V559D
12
+
+
13
+
-
+
+
+
Spindle
M
63
Stomach
+
Spindle
F
71
Small intestine 11: p.V559G
11: p.W557_K558del
11 a
17: p.N822Y
11 b
17: p.D820E
12 a
13: p.V654A
13 a
11: p.[V559G;Y578C]; [V559G;D579del]
13: p.V654A
13 b
11: p.[V559G]; [V559G;Y578C]
13: p.V654A
14: p.N680K
14
+
+
NA
NA
Mixed
F
43
Small intestine 11: p.N567_Y578delinsSCV
15
+
-
-
NA
Mixed
F
59
EGIST
14 a
17: p.N822K
11: p.D579_H580insQQLPYD 15 a
17: p.D820E
16
+
+
+
+
Mixed
M
50
Small intestine 9: p.A502_Y503dup
16 a
17: p.N822Y
17
+
-
-
+
Epitheloid F
71
Small intestine 11: p.I563_P573del
17 a
17: p.K818_D820delinsN
18
+
+
+
+
Spindle
F
52
Stomach
11: p.K558_V560del
18 a
17: p.D820Y
19
+
+
-
+
Spindle
M
65
Stomach
11: p.W557_V560delinsC
19 a
17: p.Y823D
20
+
+
-
+
Spindle
M
42
NA
11: p.M552_V559del
20 a
14: p.T670E
21
+
+
+
+
Spindle
F
59
Stomach
11: p.W557_V559delinsC
21 a
13: p.V654A
22
+
+
-
+
Spindle
M
46
Rectum
11: p.K558_V560delinsS
22 a
13: p.V654A
23
+
+
+
+
Mixed
M
53
Stomach
11: p.V559G
23 a
13: p.V654A
24
+
+
+
+
Spindle
M
60
Stomach
11: p.W557_V559delinsF
24 a
17: p.N822K
25
+
+
(+)
NA
Mixed
M
65
Stomach
11: c.1648-5_1672del
25 a
-
26
+
-
+
NA
Epitheloid F
75
EGIST
11: p.Y570_L576del
26 a
-
27
+
-
+
NA
Mixed
M
72
Small intestine 9: p.A502_Y503dup
27 a
-
28
+
+
-
NA
Spindle
F
42
NA
9: p.A502_Y503dup
28 a
n.n.
29
+
+
+
NA
Mixed
M
66
EGIST
11: p.M552_K558del
29 a
-
30
+
+
+
NA
Spindle
F
43
Peritoneum
11: p.W557R
30 a
13: p.K642E
13: p.V654A
31
+
-
+
+
Epitheloid F
64
Peritoneum
11: p.W557G
31 a
13: p.V654A
Heydt et al. BMC Cancer (2015) 15:291
Page 4 of 14
Table 1 Clinical and pathological data and mutational status of 33 primary GISTs with known recurrent lesions
(Continued)
11: p.[W557G(;) V569_Y578del]
17: p.N822Y
32
+
+
+
+
Spindle
F
77
Stomach
11: p.W557R
32 a
17: p.N822K
33
+
+
+
+
Mixed
M
68
Small
intestine
11: p.I563_P577delinsN
33 a
17: p.D820G
NA: Not known. +: Positive staining; (+): Focal positive staining. M: Male; W: Female. n.n.: Not evaluable. EGIST: Extragastrointestinal stromal tumour; a, b, c: Count
of recurrent lesions of one case.
Amplicon-based massively parallel sequencing
DNA quantification
For the sensitive analysis of the primary GISTs, two massively parallel sequencing platforms were used: the GS
Junior (Roche, Mannheim, Germany) and the MiSeq™
(Illumina, San Diego, CA, USA). All samples were quantified in duplicates by the Quant-iT™ dsDNA HS Assay (Life
Technologies, Darmstadt, Germany) on the Qubit® 2.0
fluorometer (Life Technologies) and with the Quant-iT™
PicoGreen® dsDNA reagent (Life Technologies) (Figure 1).
GS Junior (Roche)
For the analysis of FFPE samples on the GS Junior
(Roche), a custom designed library was prepared according
to the Roche guidelines covering KIT exon 13, 14 and 17
combined with either exon 9 or 11 (Figure 1). Target specific primers are listed in Additional file 1. 100 – 150 ng of
genomic DNA were used for library preparation.
For library preparation of the fresh-frozen primary
GISTs, 75 ng DNA were amplified using custom designed primers (Additional file 2) and Phusion Hot Start
Flex DNA Polymerase (New England Biolabs, Ipswich, MA,
USA) according to manufacturer’s instructions.
For the fresh-frozen metastases the GIST MASTR
(Multiplicom, Niel, Belgium) and the 454 MID kit 1–8
(Multiplicom) were used according to manufacturer’s
instructions (Figure 1).
Table 2 Nine fresh-frozen GISTs before therapy with
known status of primary KIT mutation
Case No.
Mutation primary tumour
Mutation metastasis
F1
11: p.V559G
n.a.
F2
Wt
n.a.
F3
9: p.A502_Y503dup
n.a.
F4
Wt
n.a.
F5
n.a.
11: p.V559D
F6
n.a.
Wt
F7
Wt
n.a.
F8
p.W557_V559delinsF
n.a.
F9
p.V559A
n.a.
n.a.: Not analysed. Wt: Wild-type.
Libraries were purified, quantified and diluted to a final
concentration of 1 x 10⁶ molecules. 10 – 14 samples were
multiplexed, clonally amplified by emulsion PCR and
sequenced on the GS Junior (Roche) following manufacturer’s instructions.
MiSeq™ (Illumina)
Two amplicon-based assays were used on the MiSeq™
(Illumina): a GeneRead Mix-n-Match DNAseq Gene Panel
(Qiagen panel, Qiagen) for the whole KIT gene consisting
of 78 amplicons and an Ion AmpliSeq™ Custom DNA
Panel (AmpliSeq panel, Life Technologies) for exon 11, 13,
14 and 17 of the KIT gene with six amplicons (Additional
file 3). All 33 primary GISTs were evaluated with the
Qiagen panel. The 52 subregions of the five subdivided
cases were analysed with the AmpliSeq panel. Three
fresh-frozen samples were investigated with both assays
(Figure 1).
Analysis with the Qiagen panel was performed according
to the GeneRead DNAseq Gene Panel Handbook (Qiagen).
With the AmpliSeq panel, 10 ng of DNA were amplified as
described previously [19]. In brief, barcodes were ligated to
multiplex PCR products and targets were enriched with
the Ion AmpliSeq™ Library Kit 2.0 (Life Technologies).
All samples were quantified and diluted. 5 – 6 (Qiagen
panel) or 15 – 24 samples (AmpliSeq panel) were multiplexed and sequenced on the MiSeq™ (Illumina) following
manufacturer’s instructions.
Bioinformatics
GS Junior (Roche) sequencing reads were aligned to the
human reference genome 19 (hg19) and analysed with
the Amplicon Variant Analyser (AVA, Roche).
FASTQ files were generated and exported on the
MiSeq™ (Illumina). The FASTQ files were aligned to the
reference genome (NCBI build 37/hg19) using BWA and
BLAT algorithms. Variants were called with an in-house
pipeline developed by Peifer et al., which is based on the
general cancer genome analysis pipeline [20]. Mapped
reads and called variants were combined in a BAM file
and data were visualised with the Integrative Genomics
Viewer (IGV) [21].
Heydt et al. BMC Cancer (2015) 15:291
Page 5 of 14
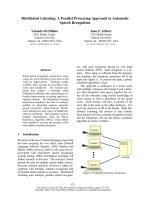
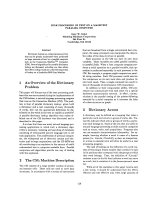
Figure 1 Visual depiction of the different experiments and workflows performed on the GS Junior (Roche) (A) and the MiSeq™ (Illumina) (B) with
FFPE and fresh-frozen material.
Heydt et al. BMC Cancer (2015) 15:291
Analysis of assay sensitivity, specificity and limit of
detection
All assays were validated with a set of samples with a
known mutational status. For the MiSeq™ (Illumina) assays, all 36 secondary samples and for the GS Junior a
different set of 18 samples were used. The sensitivity
and specificity were determined for each assay. The sensitivity is defined as the proportion of correctly identified
positive events (True positive rate). The specificity is defined as the proportion of correctly identified negative
events (True negative rate).
The limit of detection was determined in duplicates using
serial dilutions of DNA from a wild-type GIST and from
mutated GISTs with ten different mutations (p.V654A, p.
T670A, p.T670K, p.N680K, p.D820Y, p.D820G, p.D820E,
p.N822Y, p.D822K, p.Y823D, all from FFPE). The mean allele frequencies of the mutated GISTs used for the serial
dilutions were calculated by independent, massively parallel sequencing runs for each assay. Mutated DNA was
diluted to a concentration of 10 ng/μl and 10% allele
frequency for each mutation respectively. The limit of
detection was estimated as the point where the mutated
sample could still be distinguished from a wild-type sample, before which the serial dilution reached a constant
level (background noise).
Results
Primary mutations of the 33 primary GISTs
Previously determined KIT exon 9 and exon 11 mutations
were verified in 29 of the 33 primary GISTs using the GS
Junior (Roche). After repeating the experiment, three samples were still not evaluable and showed no coverage for
exon 9 or 11 due to a low DNA content or highly fragmented DNA. However, two of these three samples were
evaluable for exon 13, 14 and 17. All three samples could
be investigated with the MiSeq™ (Illumina) assays. Thus,
they were not excluded from this study. One sample
showed a wild-type sequence in exon 11 instead of the p.
V559G mutation. Using the Qiagen panel on the MiSeq™
(Illumina), the mutational status of KIT exon 9 and 11 of
all 33 primary GISTs was confirmed (Table 1). Differences
in the nomenclature of sequence variants were seen but
could be resolved by renaming the mutations according to
the recent HGVS nomenclature of gene variations [22].
The allele frequencies of exon 9 and 11 mutations in the
primary GISTs varied between the GS Junior (Roche) and
the MiSeq™ analysis. A difference of 1.8 – 91.4% was seen
in samples between these two platforms (Additional file 4).
Assay sensitivity, specificity and limit of detection
The sensitivity and specificity of each assay is shown in
Table 3. For validation of the MiSeq™ (Illumina) assay the
36 secondary GIST samples were used. For validation of
the GS Junior (Roche) a different set of 18 samples with
Page 6 of 14
known mutational status was used. The sensitivity and
specificity of the GS Junior (Roche) and the Qiagen panel
on the MiSeq™ (Illumina) was 100%. The sensitivity of
the AmpliSeq panel on the MiSeq™ (Illumina) was
only 93%. Using this panel, four of the exon 11 mutations (p.M552_K558del, p.M552_V559del, K550_K558del,
c.1648-5_1672del) could not be detected as these mutations were at the amplicon boundaries and primer binding
sites. The specificity of the AmpliSeq panel was 100%
(Table 3). Thus, all secondary KIT mutations could be detected with all three assays.
The limit of detection determines the lowest detectable
amount of mutated alleles in a background of wild-type
DNA. In this study, the limit of detection was determined
for ten different secondary KIT mutations. The limit of
detection for each mutation tested was 1% on the GS
Junior (Roche). For the MiSeq™ (Illumina) the limit of
detection differed depending on the position of the secondary mutation (Table 3, Additional file 5) It spread
from 0.03 – 0.25% on the MiSeq™ (Illumina) with the
Qiagen panel and 0.02 – 0.45% with the AmpliSeq panel.
Exemplarily, two of the serial dilutions illustrating the
limit of detection, including the coverage and allele frequencies for each dilution step, are shown in Additional
file 6.
Performance of the GS Junior (Roche) pyrosequencing
and the GeneRead Mix-n-Match DNAseq Gene Panel
(Qiagen) on the MiSeq™ (Illumina)
The GS Junior (Roche) runs yielded in 78,200 – 116,710
passed filter reads and the MiSeq™ (Illumina) runs with
the Qiagen panel yielded in 19.89 – 23.04 million passed
filter reads, showing an increase in sequencing depth of
around 200-fold. The quality of all GS Junior (Roche)
and MiSeq™ (Illumina) runs were in the upper range for
massively parallel sequencing according to manufacturer’s
specifications.
The aligned sequencing reads per sample (four amplicons) were 4,424 – 29,584 on the GS Junior (Roche)
and the mean coverage per sample (78 amplicons) were
450,879 – 5,551,341x on the MiSeq™ (Illumina) with the
Qiagen panel.
Analysis of secondary mutations in the 33 primary GISTs
The massively parallel sequencing results for the 33 primary GISTs were checked for the corresponding emerging secondary mutations that occurred in the lesions.
In the 11 primary tumour samples with secondary KIT
exon 13 mutation (c.1961 T > C, p.V654A) in the recurrent tumour, minor percentages were seen with the GS
Junior (Roche). However, when analysing the remaining
primary GISTs of the FFPE collective without later emerging secondary p.V654A resistance mutations as a negative
control, the substitution was detected with the same mean
Heydt et al. BMC Cancer (2015) 15:291
Page 7 of 14
Table 3 Validation of the three assays used
Assay
Sensitivity
Specificity
Limit of
detection
GS Junior
100% (21/21)
100% (69/69)
1%#
MiSeq™ - Qiagen panel
100% (77/77)
100% (118/118)
0.03 – 0.25%#
MiSeq™ - AmpliSeq
panel
93% (69/74)
100% (83/83)
0.02 – 0.45%#
Shown are the sensitivity, specificity and limit of detection for each assay.
Sensitivity: Proportion of correctly identified positive events (True
positive rate).
Specificity: Proportion of correctly identified negative events (True
negative rate).
(/): (number of detected/number of expected events).
#
See Additional file 5 for detailed information.
allele frequency and were considered background noise
(Table 4, Figure 2, Figure 3, Additional file 4). On the GS
Junior (Roche) minor allele frequencies were observed only
at the position of the secondary mutation p.V654A. No
mutated alleles were detected with the GS Junior (Roche)
at all other positions of known secondary mutations.
To increase the sequencing depth and to decrease amplification artefacts by sequencing only one sample, 12
identical libraries of the same case with the same barcode
were loaded on the GS Junior (Roche). With this approach
we were able to increase the coverage from 828 to 48,087x
and decrease the background noise from 1 to 0.4%, while
at the same time decreasing the allele frequency at the
position of the p.V654A mutation from an allele frequency
of 0.85 to 0.16% (Additional file 7A).
The higher sequencing depth of the MiSeq™ (Illumina)
led to similar results. With the Qiagen panel the mean
allele frequency of the p.V654A mutation was the same
between primary GISTs with and without emerging p.
V654A mutation. Minor mutated allele frequencies at
the positions of secondary mutations in exon 14 and
17 of the KIT gene were not detected with the GS Junior (Roche). With the MiSeq™ (Illumina) mutated allele
frequencies at these positions were detected at lower
frequencies than for the p.V654A mutation, but again
no difference could be seen between primary GISTs
with and without later emerging secondary mutations
and were again considered background noise (Table 4,
Figure 2, Figure 3, Additional file 4).
When analysing only one same sample at different coverages with the Qiagen panel on the MiSeq™ (Illumina) instead of the GS Junior (Roche), the same effect could be
observed; an increase in the sequencing depth decreased
the background noise (Additional file 7B).
In the cases 30, 31, 32 and 33, secondary KIT mutations
were identified with a high allele frequency (Additional
file 4). After repeated examination of the clinical history of the primary tumours, these tumours turned out
to be progressed lesions under therapy. Due to insufficient clinical data the tumours were initially identified
as primary tumours with activating KIT exon 11 mutations
and no secondary resistance mutations were evaluated.
Tumour segmentation into subregions and performance
of the Ion AmpliSeq™ Custom DNA Panel (Life Technologies)
on the MiSeq™ (Illumina)
Five of the primary GISTs were segmented into a total
of 52 equal subregions in order to increase the sensitivity, the sequencing depth and the likelihood of detecting
a minor resistant subclone by decreasing the wild-type
background,. The five selected primary GISTs showed
different primary mutations in KIT exon 11 and different
emerging secondary KIT mutations in exon 13, 14 and
17. Additionally, these samples were large resections of
different localisations with sufficient tumour material for
Table 4 Summary of allele frequencies at each secondary KIT mutation position in primary GISTs
Mutation
Assay
With emerging secondary mutation [%]
Without emerging secondary mutation [%]
Limit of detection [%]
p.V654A
GS Junior
0.000 - 0.850
0.000 - 0.790
1.00
Qiagen panel
0.146 - 0.248
0.107 - 0.233
0.25
p.N680K
p.D820E
p.N822Y
AmpliSeq panel
0.216 - 0.415
0.254 - 0.363
0.45
GS Junior
0.000
0.000
1.00
Qiagen panel
0.039
0.006 - 0.092
0.10
AmpliSeq panel
0.013 - 0.026
0.008 - 0.055 (0.385)
0.07
GS Junior
0.000
0.000
1.00
Qiagen panel
0.019 - 0.035
0.010 - 0.094
0.10
AmpliSeq panel
0.010 - 0.021
0.012 - 0.028
0.03
GS Junior
0.000
0.000
1.00
Qiagen panel
0.017 - 0.047
0.011 - 0.074
0.08
AmpliSeq panel
0.008 - 0.012
0.008 - 0.019
0.02
Shown are the allele frequencies in primary GISTs (FFPE) with and without emerging secondary mutation in the recurrent tumours in comparison to the limit of
detection. The positions of the mutations p.V654A, p.N680K, p.D820E, p.N822Y were analysed with each assay.
[%]: Allele frequency in percent.
(): Falsely higher allele frequency due to read bias in one run.
Heydt et al. BMC Cancer (2015) 15:291
Figure 2 (See legend on next page.)
Page 8 of 14
Heydt et al. BMC Cancer (2015) 15:291
Page 9 of 14
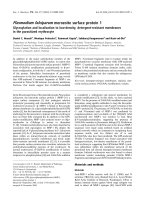
(See figure on previous page.)
Figure 2 Analysis of minor variants of secondary KIT mutations in GISTs prior to imatinib therapy. Shown are the mean allele frequency (± the
standard deviation) and mean coverage (± the standard deviation) at the positions of the mutations p.V654A (exon 13), p.N680K (exon 14), p.
D820E (exon 17) and p.N822Y (exon 17). At each mutation position the results are shown for each of the three panels used: the GS Junior panel,
the Qiagen panel and the AmpliSeq panel. The different coloured graphs illustrate the results of primary GISTs (FFPE) with (white) and without
(grey) emerging secondary KIT mutations in the recurrent tumours and of GISTs (fresh-frozen) with unknown emerging secondary KIT mutations
(dark grey). All measured allele frequencies are below the determined limit of detection (see corresponding Table 4).
segmentation. The subregions showed differences neither
in morphology nor immunohistochemical staining pattern
and intensity (Figure 4). By quantitative immunohistochemistry of the CD117 staining no categorical differences
were noticed.
The MiSeq™ (Illumina) runs of the 52 subregions with
the AmpliSeq panel yielded 15.38 – 19.66 million passed
filter reads. The quality of the runs was in concordance
with the manufacturer’s specifications. The mean coverage per sample (six amplicons) was between 437,619 and
3,046,805x. For all 52 samples the allele frequency at the
position of the KIT substitutions exon 13 p.V654A, exon
14 p.N680K, exon 17 p.D820E and exon 17 p.N822Y
was determined. For each substitution the same minor
allele frequency could be detected in primary tumours
with and without the corresponding emerging secondary
resistance mutation. Even an increase in the sequencing
depth with a coverage of 1.574 Million in exon 17 did not
lead to different results. For exon 13 and 17 the allele frequency was even higher in the negative control samples
(Table 4, Figure 2).
In one run with 15 negative control subregions, the
forward and the reverse strand of the exon 14 substitution p.N680K showed an imbalance in sequence reads,
which led to a false higher allele frequency (Additional
file 8). When excluding these 15 subregions the mean mutated allele frequency was reduced to the same frequency
as the other negative control samples. As the imbalance
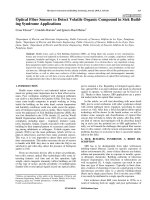
Figure 3 Results of minor variants of secondary KIT mutations of case 7 and 11 prior to therapy. Mean allele frequency of p.V654A and p.D820E
substitutions for cases with and without emerging KIT exon 13 and exon 17 mutations determined by GS Junior (Roche) and MiSeq™ (Illumina)
sequencing. The arrow indicates the position of the substitution.
Heydt et al. BMC Cancer (2015) 15:291
Page 10 of 14
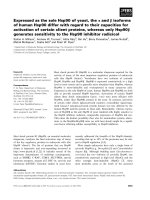
Figure 4 Histological characteristics of subregions of case 7. (A) Overview of segmented H&E stain (magnification 10x). (B) H&E stain of each
subregion (magnification 200x). (C) Overview of CD117 stain (magnification 10x). (D) 200x magnification of subregion 2b. (E) Quantitative
immunohistochemistry. Image analysis of 1.85 mm2 per subregions. Shown are the median, the 95% confidence interval and the standard
deviation.
was only seen in one run with negative control subregions,
the detection of minor subclones was not affected. Exemplarily, the results of two cases for all three assays are
shown in Figure 3.
Comparison of assay performance in DNA extracted from
fresh-frozen and FFPE tissue
For the fresh-frozen samples the mutational status after
therapy was not known. Therefore, the same four most
common secondary KIT mutations, as described above,
were analysed.
With the GS Junior (Roche) six fresh-frozen samples
were analysed and no mutated allele frequencies at the
positions of secondary mutations were detected. With the
MiSeq™ (Illumina) three fresh-frozen samples were analysed and minor frequencies of the mutated allele could
be detected. However, the allele frequencies were in the
same range as in the analysed primary FFPE samples and
Heydt et al. BMC Cancer (2015) 15:291
were determined to be background noise (Figure 3,
Additional files 8, 9 and 10).
Discussion
The development of secondary resistance mutations during
imatinib therapy is the most common resistance mechanism in GISTs. Experimental evidence of whether secondary
mutations are pre-existing in minor subclones or develop
“de novo” during therapy has yet to be provided and would
help to develop new therapeutic strategies in GISTs.
In this study, 33 primary GISTs with known progressed
disease and secondary resistance mutations were analysed
on the GS Junior (Roche) and on the MiSeq™ (Illumina)
with three different assays.
With an achieved sensitivity of 0.02% mutated alleles
in the background of wild-type alleles for KIT exon 17 p.
N822Y, p.N822K and p.Y823D mutations on the MiSeq™
(Illumina) with the AmpliSeq panel, no pre-existing subclones were detected with any of the three assays. The
limit of detection varied between individual secondary
mutations. Additionally, it could be seen that at each
position of secondary mutations some negative samples
(samples without later emerging secondary mutations)
had higher allele frequencies than the samples with later
emerging secondary mutations. Thus, the threshold used
to distinguish positive from negative cases was determined
for each position of secondary mutations by the allele frequencies of the negative samples, correlating with the
limit of detection.
On both systems the sensitivity of the assay was limited
by background noise. Particularly high background noise
and artificial T > C substitutions at the position of the p.
V654A mutation posed a problem and led to a higher detection limit. Artificial T > C transitions could be artefacts
which are associated with formalin fixation and are a
common problem in FFPE material, especially when using
small biopsies and low DNA content [23,24]. Formalin
cross-links cytosine nucleotides on either strand and/or
deaminates cytosine to uracil and adenine to hypoxanthine. During PCR reaction the Taq polymerase incorporates an adenine instead of a guanine and a cytosine
instead of a thymine and non-reproducible C<>T and
G<>A mutations are created [24-26].
Forshew et al. showed in 47 FFPE samples that background frequencies of artificial substitutions were around
0.1% and varied depending on base substitution and
loci [27].
To reduce the effect of fixation artefacts and background
noise three approaches were chosen: the sequencing
depth was increased, fresh-frozen material was analysed
and FFPE material was treated with uracil-N-glycosylase
(UDG).
It is common knowledge that the detection of low mutated allele frequencies depends among others on the
Page 11 of 14
sequencing depth. Thus, an increase in the sequence
coverage leads to an increase in the detection sensitivity
of somatic variants by decreasing the background noise
[28-32]. This effect was also seen in our study. However, in our study a much higher increase in the sequencing depth was achieved, which has not been published
yet. In our study, this approach was first shown on the GS
Junior (Roche). We increased the sequencing depth, and
thus the method sensitivity, by sequencing 12 independent
libraries with the same barcode of only one case on the
GS Junior (Roche). By this approach, we not only increased the method sensitivity by increasing the sequencing depth, we also decreased amplification errors and
thus the background noise by combining 12 independent
PCR reactions. Here, we were able to increase the coverage from 828 to 48,087 and decrease the background
noise from 1 to 0.4%, while at the same time decreasing
the allele frequency at the position of the p.V654A mutation from an allele frequency of 0.85 to 0.16%. On the
MiSeq™ (Illumina) we could observe the same effect of
coverage increase and background noise decrease, when
analysing the same sample at different coverages. Here,
we used one PCR reaction per sample only.
Generally speaking, with the MiSeq an approximately
70-fold increase in sequencing depth led to an at least
3-fold decrease in the background noise. However, the
principle described above could not be observed in all
experiments. On the MiSeq™ (Illumina), the AmpliSeq
panel showed in some amplicons a more than 10-fold
increase in the sequencing depth in comparison to the
Qiagen panel but a reduction of the background noise
at the positions of the secondary mutations could not
be observed an each position.
Thus, in our study, the reduction of background noise
and increase in detection sensitivity by increasing the sequencing depth of the method led to the same results.
No pre-existing secondary mutation exceeded the background noise (the allele frequency at the relevant position
of the secondary mutations) in the primary tumour
samples.
We analysed six fresh-frozen samples with the GS Junior
(Roche) and three fresh-frozen samples with both
MiSeq™ (Illumina) panels. With the GS Junior (Roche)
no minor frequencies of mutated alleles were seen at
four positions of secondary mutations (p.V654A, p.
N680K, p.D820E, p.N822Y). With the MiSeq™ (Illumina)
minor allele frequencies of the mutated allele were detected, but the frequencies and the sensitivity were the
same as with the FFPE material and were thus determined as background noise.
Spencer et al. showed that most high-quality base discrepancies were not significantly different between FFPE
und fresh-frozen material, and are rather due to sequencing errors and DNA damage. Only C > T and G > A
Heydt et al. BMC Cancer (2015) 15:291
transitions were significantly increased when comparing
FFPE and fresh-frozen material [33].
Nguyen et al. showed that transitions are especially
prone to sequencing errors due to base-pairing and reading
errors. They showed >1% erroneous sequences independent of the material source [34]. Another study showed the
presence of 0.05 – 1% sequencing errors with human cells
and bacterial DNA [35].
Additionally, 19 of the 33 primary GISTs were extracted with the GeneRead DNA FFPE KIT (Qiagen)
and sequenced with the AmpliSeq panel. This kit uses
UDG, which reduces C > T (and G > A) sequence artefacts
[26,36]. Do et al. showed that UDG treatment reduces the
allele frequency of G > A artefacts from 0.1 to 2.07% to 0.1
to 0.7%. However, as UDG removes uracil from damaged
FFPE DNA only C > T and respectively G > A transitions
are reduced. Therefore no reduction in T > C artefacts at
the p.V654A position was seen.
At the positions of exon 14 and exon 17 substitutions
the allele frequencies of the mutated allele and respectively the background noise were often as low as 0.02%
on the MiSeq™ (Illumina). These substitutions were mostly
transversions G<>T and T<>A, which are not affected
by fixation artefacts or sequencing errors. Nevertheless,
no minor resistant subclones could be detected at these
positions.
Further, low-diversity libraries, i.e. libraries with only
a few amplicons, may lead to an imbalance in sequence
reads of the forward and reverse strand in MiSeq™
(Illumina) runs with normal cluster densities. Due to the
low number of different amplicons, the likelihood of clusters of the same amplicon appearing next to each other on
a flow cell is higher than in MiSeq™ (Illumina) runs with
more diverse libraries. When analysing low-diversity libraries, the MiSeq™ (Illumina) cannot distinguish between the
individual clusters and might detect the wrong nucleotide.
As this reading error occurs in the two sequencing runs
independently, it results in an imbalance between the
two sequence reads and leads to the detection of false
positives with a falsely higher allele frequency. To increase the run quality, it is stated that the cluster density should be decreased and that only balanced sequence
reads should be analysed [37-39]. This approach was also
applied in this study. To show the risk of imbalanced
sequencing reads and false positives when using lowdiversity libraries, one run showing imbalanced sequencing reads at the position of the secondary mutation in
KIT exon 14 (p.N680K) was included in this paper. In this
run, only cases without later emerging p.N680K mutation
were included.
In addition to the massively parallel sequencing, a
wild-type blocking LNA-mediated clamping assay (TIB
Molbiol) for the p.V654A substitution was used in this
study. With a sensitivity of 0.4% the assay yielded no
Page 12 of 14
other results than the massively parallel sequencing
(data not shown). All samples were wild-type for p.V654A.
New large-scale sequencing approaches have revealed
the extensive intra- and intertumour heterogeneity in
many cancers [40-42]. In renal cancer 63 – 69% of mutations were not detectable in every tumour region [40].
Therefore, the detection of subclonal mutations is important as these subclones may contribute to primary and acquired resistance [43-45].
This tumour heterogeneity and the development of
polyclonal resistance mutations during therapy has also
been described for GISTs [5,10,11]. Wardelmann et al.
showed that a biopsy is not representative for the whole
tumour [5,11]. In our study, five of the 33 primary GISTs
were segmented into a total of 52 subregions to minimise the analysed tumour region and reduce the wild-type
background. However, this approach led to similar results
and no minor resistant subclones could be detected prior
to tyrosine kinase inhibitor therapy. It remains unresolved
whether the detection limit of two mutated clones in
10,000 wild-type clones was not high enough, whether
heterogeneous tissue samples are, per se, not suitable
for the detection of very small subpopulations of mutated
cells or whether in general no subclones were present.
The assessment of the probability of pre-existing resistant subclones is an ongoing challenge. In some tumour
entities, pre-existing resistant subclones could be detected.
In colorectal carcinoma KRAS resistance mutations were
detected with an allele frequency of 0.2%. In non-small
cell lung cancer p.T790M EGFR resistance mutations
were detected with an allele frequency of 0.4 – 0.02%
[4,7,8]. These mutations were mainly detected with TaqMan
assays, massively parallel sequencing approaches and mathematical modelling. The method sensitivity in our study
was within the same range. However, in our study no
pre-existing resistant subclones were detected. This is
in concordance with published theories, which state that
in GIST resistance mutations develop “de novo” during
therapy as GIST patients with developing secondary resistance mutations are commonly treated longer with the
tyrosine kinase inhibitor imatinib than resistant patients
without these mutations [14]. Hence, it is assumed that
clonal selection of pre-existing resistance mutations in
GIST is unlikely.
In the previous lung and colorectal carcinoma studies,
mentioned above, pre-existing subclones were determined
in blood samples and cell cultures.
Therefore, the analysis of circulating tumour DNA
may be promising in the early detection of resistance
mutations, which will overcome tissue heterogeneity and
formalin fixation, and may also be useful in the detection
of pre-existing resistant subclones [46-48].
Further, mathematical models have already been used
and might be useful to predict pre-existing resistant
Heydt et al. BMC Cancer (2015) 15:291
Page 13 of 14
minor subclones in combination with experimental and
clinical data in GISTs [15].
Competing interests
The authors declare that they have no competing interests.
Conclusion
Despite the use of ultrasensitive methods available nowadays and a minimal sensitivity level of 0.02% varying
between individual secondary mutations, this study detected no pre-existing resistant subclones. This result is
based on the analysis of 33 primary FFPE GISTs with
known secondary resistance mutation and nine freshfrozen GISTs prior to therapy.
Our results support the theory that such mutations
develop under tyrosine kinase inhibitor treatment by
“de-novo” mutagenesis in GISTs. On the other hand, either the methods employed might still not be sensitive
enough or heterogeneous tissue samples, per se, might
not be suitable for the detection of very small subpopulations of mutated cells.
Authors’ contributions
CH, SMB drafted the manuscript. CH, NK, MO, FH, EW, SMB conceived and
designed the study design and the experiments. CH, NK performed the
experiments. CH, NK, FH, JF, MAI, HK, AS were involved in data interpretation
and analysis. RB, EW, HUS participated in the coordination of the study and
helped drafting the manuscript. All authors read and approved the final
manuscript.
Additional files
Additional file 1: Target specific primers for GS Junior library
preparation (FFPE).
Additional file 2: Target specific primers for GS Junior library
preparation (fresh-frozen).
Additional file 3: Primers of the Ion AmpliSeq™ Custom DNA Panel
(Life Technologies) for the KIT gene (FFPE/fresh-frozen).
Additional file 4: Results of the 33 sequenced primary tumours
with the GS Junior (Roche) and the GeneRead Mix-n-Match DNAseq
Gene Panel (Qiagen) on the MiSeq™ (Illumina).
Additional file 5: Limit of detection for each assay on the GS Junior
(Roche) and on the MiSeq™ (Illumina) for nine different secondary
mutations.
Additional file 6: Determination of the limit of detection for the
mutation p.V654A with the GeneRead Mix-n-Match DNAseq
Gene Panel (Qiagen) and Ion AmpliSeq™ Custom DNA Panel (Life
Technologies) on the MiSeq™ (Illumina).
Additional file 7: Illustration of the reduction of background noise
by increasing the sequencing depth of the same case on the GS
Junior (Roche) (A) and on the MiSeq™ (Illumina) with the GeneRead
Mix-n-Match DNAseq Gene Panel (Qiagen)(B) at the position of the
mutation p.V654A. The red arrow indicates the position of the p.V654A
mutation. On the GS Junior (Roche) amplification artefacts and thus
background noise were reduced additionally by combining 12 independent
PCR reactions of the same case.
Additional file 8: Results of the 52 sequenced subregions with the
Ion AmpliSeq™ Custom DNA Panel (Life Technologies) on the MiSeq™
(Illumina).
Additional file 9: Results of the 6 sequenced fresh-frozen primary
tumours with the GS Junior (Roche).
Additional file 10 Results of the 3 sequenced fresh-frozen primary
tumours with the GeneRead Mix-n-Match DNAseq Gene Panel
(Qiagen) and the Ion AmpliSeq™ Custom DNA Panel (Life Technologies)
on the MiSeq™ (Illumina).
Abbreviations
GIST: Gastrointestinal stromal tumour; FFPE: Formalin-fixed, paraffin embedded;
H&E: Haematoxylin-eosin; Qiagen panel: GeneRead Mix-n-Match DNAseq
Gene Panel (Qiagen); AmpliSeq panel: Ion AmpliSeqTM Custom DNA Panel
(Life Technologies); AVA: Amplicon Variant Analyser; IGV: Integrative
Genomics Viewer; UDG: Uracil-N-glycosylase.
Acknowledgements
We thank Ulrike Koitzsch, Claudia Vollbrecht, Katharina König, Theresa Buhl,
Claudia Dorloff, Ellen Paggen, Elke Binot and Wiebke Jeske for technical
support. We also thank Anna Fries, Jochen Fries, Elisabeth Lamers-Schmidt
und Christina Lissewski for critically reading the manuscript.
The authors declare that they have received no funding for this study.
Author details
1
Institute of Pathology, University Hospital Cologne, Kerpener Str. 62, 50937
Cologne, Germany. 2Institute of Pathology, University Hospital Erlangen,
Krankenhausstraße 8-10, 91054 Erlangen, Germany. 3Institute of Pathology,
University Hospital Göttingen, Robert-Koch-Strasse 40, 37075 Göttingen,
Germany. 4Gerhard-Domagk-Institute of Pathology, University Hospital
Münster, Albert-Schweitzer-Campus 1, Gebäude D17, 48149 Münster,
Germany.
Received: 11 October 2014 Accepted: 1 April 2015
References
1. Jackson SE, Chester JD. Personalised cancer medicine. Int J Cancer. 2014.
Epub.
2. Lackner MR, Wilson TR, Settleman J. Mechanisms of acquired resistance to
targeted cancer therapies. Future Oncol. 2012;8:999–1014.
3. Gerstung M, Beisel C, Rechsteiner M, Wild P, Schraml P, Moch H, et al.
Reliable detection of subclonal single-nucleotide variants in tumour cell
populations. Nat Commun. 2012;3:811.
4. Rosell R, Molina MA, Costa C, Simonetti S, Gimenez-Capitan A, Bertran-Alamillo J,
et al. Pretreatment EGFR T790M mutation and BRCA1 mRNA expression in
erlotinib-treated advanced non-small-cell lung cancer patients with EGFR
mutations. Clin Cancer Res. 2011;17:1160–8.
5. Wardelmann E, Thomas N, Merkelbach-Bruse S, Pauls K, Speidel N, Buttner R,
et al. Acquired resistance to imatinib in gastrointestinal stromal tumours
caused by multiple KIT mutations. Lancet Oncol. 2005;6:249–51.
6. Zahreddine H, Borden KL. Mechanisms and insights into drug resistance in
cancer. Front Pharmacol. 2013;4:28.
7. Diaz Jr LA, Williams RT, Wu J, Kinde I, Hecht JR, Berlin J, et al. The molecular
evolution of acquired resistance to targeted EGFR blockade in colorectal
cancers. Nature. 2012;486:537–40.
8. Ding D, Yu Y, Li Z, Niu X, Lu S. The predictive role of pretreatment epidermal
growth factor receptor T790M mutation on the progression-free survival
of tyrosine-kinase inhibitor-treated non-small cell lung cancer patients:
a meta-analysis. Onco Targets Ther. 2014;7:387–93.
9. Hirota S, Isozaki K, Moriyama Y, Hashimoto K, Nishida T, Ishiguro S, et al.
Gain-of-function mutations of c-kit in human gastrointestinal stromal tumors.
Science. 1998;279:577–80.
10. Gramza AW, Corless CL, Heinrich MC. Resistance to Tyrosine Kinase Inhibitors in
Gastrointestinal Stromal Tumors. Clin Cancer Res. 2009;15:7510–8.
11. Wardelmann E, Merkelbach-Bruse S, Pauls K, Thomas N, Schildhaus HU,
Heinicke T, et al. Polyclonal evolution of multiple secondary KIT mutations
in gastrointestinal stromal tumors under treatment with imatinib mesylate. Clin
Cancer Res. 2006;12:1743–9.
12. Liegl B, Kepten I, Le C, Zhu M, Demetri GD, Heinrich MC, et al. Heterogeneity of
kinase inhibitor resistance mechanisms in GIST. J Pathol. 2008;216:64–74.
13. Henze J, Muhlenberg T, Simon S, Grabellus F, Rubin B, Taeger G, et al. p53
modulation as a therapeutic strategy in gastrointestinal stromal tumors.
PLoS One. 2012;7, e37776.
14. Antonescu CR. The GIST paradigm: lessons for other kinase-driven cancers.
J Pathol. 2011;223:251–61.
Heydt et al. BMC Cancer (2015) 15:291
15. Tomasetti C, Demetri GD, Parmigiani G. Why tyrosine kinase inhibitor
resistance is common in advanced gastrointestinal stromal tumors.
F1000Res. 2013;2:152.
16. Kunstlinger H, Huss S, Merkelbach-Bruse S, Binot E, Kleine MA, Loeser H,
et al. Gastrointestinal stromal tumors with KIT exon 9 mutations: Update on
genotype-phenotype correlation and validation of a high-resolution melting
assay for mutational testing. Am J Surg Pathol. 2013;37:1648–59.
17. Merkelbach-Bruse S, Dietmaier W, Fuzesi L, Gaumann A, Haller F, Kitz J, et al.
Pitfalls in mutational testing and reporting of common KIT and PDGFRA
mutations in gastrointestinal stromal tumors. BMC Med Genet. 2010;11:106.
18. National Institutes of Health: ImageJ. (Accessed
July 2014).
19. Ihle MA, Fassunke J, Konig K, Grunewald I, Schlaak M, Kreuzberg N, et al.
Comparison of high resolution melting analysis, pyrosequencing, next
generation sequencing and immunohistochemistry to conventional Sanger
sequencing for the detection of p.V600E and non-p.V600E BRAF mutations.
BMC Cancer. 2014;14:13.
20. Peifer M, Fernandez-Cuesta L, Sos ML, George J, Seidel D, Kasper LH, et al.
Integrative genome analyses identify key somatic driver mutations of small-cell
lung cancer. Nat Genet. 2012;44:1104–10.
21. Broad Institute. Integrative Genomics Viewer. />igv/home (Accessed July 2014).
22. Human Genome Variation Society. Nomenclature for the description of
sequence variants. (Accessed July 2014).
23. Akbari M, Hansen MD, Halgunset J, Skorpen F, Krokan HE. Low copy number
DNA template can render polymerase chain reaction error prone in a
sequence-dependent manner. J Mol Diagn. 2005;7:36–9.
24. Do H, Dobrovic A. Limited copy number-high resolution melting (LCN-HRM)
enables the detection and identification by sequencing of low level mutations
in cancer biopsies. Mol Cancer. 2009;8:82.
25. Srinivasan M, Sedmak D, Jewell S. Effect of fixatives and tissue processing
on the content and integrity of nucleic acids. Am J Pathol. 2002;161:1961–71.
26. Do H, Wong SQ, Li J, Dobrovic A. Reducing sequence artifacts in ampliconbased massively parallel sequencing of formalin-fixed paraffin-embedded
DNA by enzymatic depletion of uracil-containing templates. Clin Chem.
2013;59:1376–83.
27. Forshew T, Murtaza M, Parkinson C, Gale D, Tsui DW, Kaper F, et al.
Noninvasive identification and monitoring of cancer mutations by targeted
deep sequencing of plasma DNA. Sci Transl Med. 2012;4:136ra168.
28. Hadd AG, Houghton J, Choudhary A, Sah S, Chen L, Marko AC, et al.
Targeted, high-depth, next-generation sequencing of cancer genes in
formalin-fixed, paraffin-embedded and fine-needle aspiration tumor specimens.
J Mol Diagn. 2013;15:234–47.
29. Kerick M, Isau M, Timmermann B, Sultmann H, Herwig R, Krobitsch S, et al.
Targeted high throughput sequencing in clinical cancer settings: formaldehyde
fixed-paraffin embedded (FFPE) tumor tissues, input amount and tumor
heterogeneity. BMC Med Genom. 2011;4:68.
30. Flaherty P, Natsoulis G, Muralidharan O, Winters M, Buenrostro J, Bell J, et al.
Ultrasensitive detection of rare mutations using next-generation targeted
resequencing. Nucleic Acids Res. 2012;40:e2.
31. Frampton GM, Fichtenholtz A, Otto GA, Wang K, Downing SR, He J, et al.
Development and validation of a clinical cancer genomic profiling test
based on massively parallel DNA sequencing. Nat Biotechnol. 2013;31:1023–31.
32. Spencer DH, Tyagi M, Vallania F, Bredemeyer AJ, Pfeifer JD, Mitra RD, et al.
Performance of common analysis methods for detecting low-frequency
single nucleotide variants in targeted next-generation sequence data.
J Mol Diagn. 2014;16:75–88.
33. Spencer DH, Sehn JK, Abel HJ, Watson MA, Pfeifer JD, Duncavage EJ.
Comparison of clinical targeted next-generation sequence data from
formalin-fixed and fresh-frozen tissue specimens. J Mol Diagn. 2013;15:623–33.
34. Nguyen P, Ma J, Pei D, Obert C, Cheng C, Geiger TL. Identification of errors
introduced during high throughput sequencing of the T cell receptor
repertoire. BMC Genomics. 2011;12:106.
35. Kinde I, Wu J, Papadopoulos N, Kinzler KW, Vogelstein B. Detection and
quantification of rare mutations with massively parallel sequencing. Proc
Natl Acad Sci U S A. 2011;108:9530–5.
36. Do H, Dobrovic A. Dramatic reduction of sequence artefacts from DNA
isolated from formalin-fixed cancer biopsies by treatment with uracil- DNA
glycosylase. Oncotarget. 2012;3:546–58.
Page 14 of 14
37. Illumina. Technical Note: Sequencing. Using a PhiX Control for HiSeq®
Sequencing Runs. Available: />technotes/technote_phixcontrolv3.pdf. Accessed 07 March 2014. 2013.
38. Krueger F, Andrews SR, Osborne CS. Large scale loss of data in low-diversity
illumina sequencing libraries can be recovered by deferred cluster calling.
PLoS One. 2011;6, e16607.
39. McElroy K, Zagordi O, Bull R, Luciani F, Beerenwinkel N. Accurate single
nucleotide variant detection in viral populations by combining probabilistic
clustering with a statistical test of strand bias. BMC Genomics. 2013;14:501.
40. Gerlinger M, Rowan AJ, Horswell S, Larkin J, Endesfelder D, Gronroos E, et al.
Intratumor heterogeneity and branched evolution revealed by multiregion
sequencing. N Engl J Med. 2012;366:883–92.
41. Ng CK, Pemberton HN, Reis-Filho JS. Breast cancer intratumor genetic
heterogeneity: causes and implications. Expert Rev Anticancer Ther.
2012;12:1021–32.
42. Landau DA, Carter SL, Getz G, Wu CJ. Clonal evolution in hematological
malignancies and therapeutic implications. Leukemia. 2014;28:34–43.
43. Almendro V, Marusyk A, Polyak K. Cellular heterogeneity and molecular
evolution in cancer. Annu Rev Pathol. 2013;8:277–302.
44. Murugaesu N, Chew SK, Swanton C. Adapting clinical paradigms to the
challenges of cancer clonal evolution. Am J Pathol. 2013;182:1962–71.
45. Vogelstein B, Papadopoulos N, Velculescu VE, Zhou S, Diaz Jr LA, Kinzler KW.
Cancer genome landscapes. Science. 2013;339:1546–58.
46. Bettegowda C, Sausen M, Leary RJ, Kinde I, Wang Y, Agrawal N, et al. Detection
of circulating tumor DNA in early- and late-stage human malignancies. Sci
Transl Med. 2014;6:224ra224.
47. Maier J, Lange T, Kerle I, Specht K, Bruegel M, Wickenhauser C, et al. Detection
of mutant free circulating tumor DNA in the plasma of patients with
gastrointestinal stromal tumor harboring activating mutations of CKIT or
PDGFRA. Clin Cancer Res. 2013;19:4854–67.
48. Nannini M, Astolfi A, Urbini M, Biasco G, Pantaleo MA. Liquid biopsy in
gastrointestinal stromal tumors: a novel approach. J Transl Med. 2014;12:210.
Submit your next manuscript to BioMed Central
and take full advantage of:
• Convenient online submission
• Thorough peer review
• No space constraints or color figure charges
• Immediate publication on acceptance
• Inclusion in PubMed, CAS, Scopus and Google Scholar
• Research which is freely available for redistribution
Submit your manuscript at
www.biomedcentral.com/submit