A microRNA profile associated with Opisthorchis viverrini-induced cholangiocarcinoma in tissue and plasma
Bạn đang xem bản rút gọn của tài liệu. Xem và tải ngay bản đầy đủ của tài liệu tại đây (1.66 MB, 15 trang )
Plieskatt et al. BMC Cancer (2015) 15:309
DOI 10.1186/s12885-015-1270-5
RESEARCH ARTICLE
Open Access
A microRNA profile associated with Opisthorchis
viverrini-induced cholangiocarcinoma in tissue
and plasma
Jordan Plieskatt1,2, Gabriel Rinaldi1,2, Yanjun Feng1,2, Jin Peng1,2, Samantha Easley3, Xinying Jia4, Jeremy Potriquet4,
Chawalit Pairojkul5, Vajarabhongsa Bhudhisawasdi5, Banchob Sripa5, Paul J Brindley1,2, Jeffrey Bethony1,2†
and Jason Mulvenna4,6*†
Abstract
Background: Intrahepatic cholangiocarcinoma (ICC) is a highly aggressive tumor of the bile duct, and a significant
public health problem in East Asia, where it is associated with infection by the parasite Opisthorchis viverrini. ICC is
often detected at an advanced stage and with a poor prognosis, making a biomarker for early detection a priority.
Methods: We have comprehensively profiled miRNA expression levels in ICC tumor tissue using small RNA-Seq and
validated these profiles using quantitative PCR on matched plasma samples.
Results: Distinct miRNA profiles were associated with increasing histological differentiation of ICC tumor tissue. We
also observed that histologically normal tissue adjacent to ICC tumor displayed miRNA expression profiles more
similar to tumor than liver tissue from healthy donors. In plasma samples, an eight-miRNA signature associated with
ICC, regardless of the degree of histological differentiation of its matched tissue, forming the basis of a circulating
miRNA-based biomarker for ICC.
Conclusions: The association of unique miRNA profiles with different ICC subtypes suggests the involvement of
specific miRNAs during ICC tumor progression. In plasma, an eight-miRNA signature associated with ICC could form
the foundation of an accessible (plasma-based) miRNA-based biomarker for the early detection of ICC.
Keywords: MicroRNA, Cholangiocarcinoma, Intrahepatic cholangiocarcinoma, Opisthorchis viverrini, RNA-seq
Background
Intrahepatic cholangiocarcinoma (ICC) is an aggressive
subtype of bile duct cancer, which arises in the cholangiocytes of the biliary ducts that extend into the upper
hepatoduodenal ligament. While ICC is rare in developed countries such the United States (0.5 per 100,000),
ICC is a significant public health problem in low and
middle-income countries (LMICs) of Southeast Asia (incidence of 96 per 100,000), particularly the Mekong
River Basin countries of Thailand, Laos, Cambodia, and
Vietnam [1-3]. This variation in incidence reflects the
* Correspondence:
†
Equal contributors
4
QIMR Berghofer Medical Research Institute, Infectious Disease and Cancer,
Brisbane, Queensland 4006, Australia
6
The University of Queensland, School of Biomedical Sciences, Brisbane,
Queensland 4072, Australia
Full list of author information is available at the end of the article
different underlying etiologies of ICC. In the Mekong
River Basin, ICC is strongly associated with chronic infection by the food-borne liver fluke Opisthorchis viverrini (Ov) [4]: one of only three eukaryote pathogens
considered Group 1 carcinogens [4]. Ov is a ribbon-like,
two-centimeter long parasite that is acquired by eating
under-cooked cyprinoid fish that harbor the metacercarial stage of this parasite [2]. Upon ingestion, the metacercariae excyst in the host duodenum and migrate up
the biliary tree, inhabiting the host bile ducts for years
(even decades), feeding on epithelial cells of the biliary
tract. This prolonged injury to the bile duct epithelia
creates a persistent “smouldering inflammatory milieu”
[5], that eventually results in several hepatobiliary abnormalities, principal among them ICC [5].
The location of ICC tumors in the upper hepatoduodenal ligament makes this tumor asymptomatic and
© 2015 Plieskatt et al.; licensee BioMed Central. This is an Open Access article distributed under the terms of the Creative
Commons Attribution License ( which permits unrestricted use, distribution, and
reproduction in any medium, provided the original work is properly credited. The Creative Commons Public Domain
Dedication waiver ( applies to the data made available in this article,
unless otherwise stated.
Plieskatt et al. BMC Cancer (2015) 15:309
hence difficult to detect in early stages. Moreover, its location in the upper hepatoduodenal ligament increases
the opportunities for distant metastasis due to the proximity to the lymphatic and vascular systems of the liver
[6]. As such, these slow-growing tumors are usually diagnosed at an advanced stage, when the primary cancer
is no longer amenable to surgical extirpation and has
metastasized to other organs [5]. The median survival
rate of Ov-induced ICC is less than 24 months [7]. This
poor prognosis highlights the need for diagnostic biomarkers of Ov-induced ICC, especially in resource poor
areas, where the incidence is highest and access to
health care is difficult.
Over the last five years, microRNAs (miRNAs) have
become key biomarker candidates for carcinogenesis as
they play a role in numerous physiological and pathological processes, including cellular transformation,
tumor differentiation, neoplastic proliferation, and apoptosis [8]. In cholangiocarcinoma, a growing number of
miRNAs have been associated with the disease and a
functional role has been defined for many of these (for
examples see [9] and [10]; also reviewed in [11] and
summarized in Table 1). MicroRNAs are very stable
small non-coding RNA species and hence well preserved
in formalin fixed paraffin embedded (FFPE) tumor
blocks, an ample sample source, considered unsuitable for
transcriptome studies. Recently, we reported the first comprehensive microarray-based profiling of miRNA expression using FFPE from the three most common subtypes of
Ov-induced ICC tumors [12]: moderately differentiated
ICC, papillary type ICC, and well-differentiated ICC. Each
Ov-induced ICC subtype exhibited a distinct miRNA profile, which suggested the involvement of specific sets of
miRNAs in the progression of this tumor.
In the current manuscript, we confirm and extend
these findings using small-RNA Next Generation Sequencing (NGS). In addition we verified if tissue-based
miRNA profiles were also detectable as circulating
miRNA (c-miRNA) in matched plasma samples, a more
accessible biomarker source than tissue. MicroRNAs in
the blood circulate as signaling molecules during carcinogenesis [13-17], are “stable, reproducible, and consistent among individuals with the same cancer” [18]
and hence have already been used as circulating biomarkers for breast [19], colorectal [20] and ovarian cancers [21]. While most studies of miRNA expression in
cancer have focused on biomarker discovery in either
tumor tissue or blood (i.e., serum or plasma), our study
is among the first to compare different sample matrices
(tissue and blood) for biomarker discovery by using
paired samples (i.e., tissue and plasma from the same
case), using two different discovery methods (microarray
and small RNA-Seq). Hence, not only does the current
manuscript inform our current basic understanding of
Page 2 of 15
miRNA in Ov-induced ICC, it also provides a methodological advance by following a biomarker discovery pipeline that starts with tissue-based biomarker discovery
and then verifies candidate biomarkers in the blood.
Methods
Study Samples: tissue and matched plasma
FFPE liver sections and matched plasma samples from histologically confirmed Ov-induced ICC patients archived at
the Liver Fluke and Cholangiocarcinoma Research Center,
Faculty of Medicine, Khon Kaen University, Thailand were
studied. The 14 tumor samples were derived from liver resections performed in the course of palliative treatment for
confirmed cases of Ov-associated ICC at the Khon Kaen
University’s Srinagarind Hospital, Khon Kaen, Thailand
and are referred to as cholangiocarcinoma tissue (CTT). In
addition, non-tumor tissue, microdissected distal from any
observed dysplasia or frank carcinoma from the same CTT
tumor block as noted above, were also examined and are
referred to as Distal Non-Tumor (D-NT) tissue. Finally,
non-tumor FFPE controls derived from liver biopsies of
nine individuals suspected of severe steatosis or steatohepatitis prior to gastric bypass surgery were used to assess
baseline liver histology of individual from non Ov endemic
areas (USA) and are referred to as Normal Non-Tumor
tissue (N-NT). The nine control individuals (N-NT) were
female with an average age of 45 years (95% Confidence
Interval of 38 to 54 years of age). Detailed clinicopathological information and representative images of the
tissues used in the current study are presented in detail in
the previous manuscript, in which tissue-based miRNAs
were assessed by microarray [12].
The ICC plasma samples included the following samples matched from the tissue based studies described
above: four plasma matched to the well differentiated
ICC tumor tissue, two plasma matched to the moderately differentiated ICC tissue, and six plasma matched
to papillary graded tumors (Table 2). All but two plasma
samples, B091 and Y070 (Table 2), were matched to
tissue samples used in RNA-Seq analysis. Nine control
plasma from individuals not resident in an Ov endemic
area (USA) were utilized in quantitative PCR (qPCR)
analysis alone as non-endemic controls.
The Human Research Ethics Committee, Khon Kaen
University, approved the study protocols for obtaining
the human liver samples (HE571294) and both the Khon
Kaen University and George Washington University
IRBs determined that the samples used in this study did
not meet the definition of human subjects research; i.e.,
a living individual about whom an investigator conducting research obtains: a) data through intervention or
interaction with the individual or b) private identifiable
information. This determination was made since the
Plieskatt et al. BMC Cancer (2015) 15:309
Page 3 of 15
Table 1 Comparison of dysregulated miRNAs associated with ICC to those reported in the literature
miRNA
Function
Target
Direction this work
Tissue
Ref
Up-regulated in the literature
Let-7a
Cell survival
NF2
-
Cell lines
[50]
miR-21
Apoptosis, proliferation,
MBD2, 15-PGDH/HPGD,
Up
Cell lines, Tissue
[10,51-54]
Cell lines, Tissue
[55]
Cell lines, Tissue
[56]
Tissue
[57]
invasion, metastasis
PTEN,PDCD4, TIMP3
miR-25
Apoptosis
DR4
Up
miR-26a
Proliferation, colony formation,
GSK-3
Down
miR-29b
-
-
Up
miR-31
Proliferation, apoptosis
RASA1
Up
Cell lines, Tissue
[58]
miR-34b
-
-
Up
Tissue
[57]
miR-135
-
-
Up
Tissue
[57]
miR-141
Proliferation, circadian rhythm
CLOCK
Up
Cell lines
[51]
miR-146a
-
-
Up
Tissue
[57]
miR-192
-
-
Tissue
[57]
miR-194
-
-
-
Tissue
[57]
miR-200a
Chemoresistance
PTPN12
Up
Cell lines
[57]
miR-200b
Chemoresistance
PTPN12
Up
Cell lines
[51,57]
(CCT v. N-NT)
tumor growth
(CCT v. N-NT)
(Pap. v. N-NT)
(Pap. v. N-NT)
Down
(CCT v. N-NT)
miR-200c
Chemoresistance
PTPN12
Up
Cell lines
[57]
miR-203
-
-
Up
Tissue
[57]
miR-210
Proliferation
Mnt
Up
Mouse tissue
[59]
(CCT v. N-NT)
miR-215
-
-
-
Tissue
[57]
miR-221
-
-
Up
Tissue
[57]
miR-361
-
-
Up
Tissue
[57]
miR-375
-
-
Up
Tissue
[57]
miR-421
Proliferation, migration,
FXR
Up
Cell lines, Tissue
[60]
(CCT v. N-NT)
(CCT v. N-NT)
(CCT v. N-NT)
colony formation
(CCT v. N-NT)
miR-429
-
-
Up
Tissue
[57]
miR-582
-
-
-
Tissue
[57]
miR-892b
-
-
Up
Tissue
[57]
Down-regulated in the literature
miR-29b
Gemcitabine sensitivity, apoptosis
PIK3R1, MMP-2, Mcl1
-
Cell lines
[61,62]
miR-34a
Cell cycle, proliferation
c-Myc
Up
Mouse tissue
[59]
miR-124
Migration, invasion
SMYD3
-
Cell lines
[63]
miR-138
Proliferation, cell cycle,
RhoC
Up
Tissue
[64]
Pafah1b2
Down
Tissue
[57]
migration, invasion
miR-144
Proliferation, invasion
Plieskatt et al. BMC Cancer (2015) 15:309
Page 4 of 15
Table 1 Comparison of dysregulated miRNAs associated with ICC to those reported in the literature (Continued)
miR-148a
Proliferation
DNMT-1
Down
Cell lines
[65]
miR-200b/c
Migration, invasion
Rho-kinase2, SUZ12
Up
Tissue
[66]
miR-204
EMT, migration,
Slug, Bcl-2
Down
Cell lines, Tissue
[67,68]
Tissue
[69]
Cell lines, Tissue
[68]
invasion, apoptosis
miR-214
EMT, metastasis
(Pap. v. N-NT)
Twist
Up
(CCT v. N-NT)
miR-320
Apoptosis
Mcl-1
Down
(CCT v. N-NT)
miR-370
Proliferation
MAP3K8
Down*
Cell lines
[70]
miR-373
Epigenetics
MBD2
-
Tissue
[71]
miR-376c
Migration
GRB2
Down
Cell lines
[72]
(CCT v. N-NT)
miR-451
-
-
Down
Tissue
[57]
miR-486
-
-
Down
Tissue
[57]
miR-494
Proliferation, cell cycle
CDK6
-
Cell lines
[73]
miR-495
-
-
Down
Tissue
[57]
miR-513
-
-
-
Tissue
[57]
miR-625
-
-
Up
Tissue
[57]
Tissue
[57]
(Pap. v. N-NT)
(CCT v. N-NT)
miR-1926
-
-
-
Unless otherwise stated ‘Direction this work’ refers to the CCT v. D-NT comparison.
samples were limited to preexisting, de-identified specimen analysis labeled with a random code.
Histological grading
Histological grading was done as described by the International Agency for Research on Cancer (IARC) [22]. In
brief, assignment of the histological grade of welldifferentiated adenocarcinoma to a tumor sample required
that 95% of the tumor contain glands. For moderately differentiated ICC, tissue was required to have between 40 to
94% of the tumor composed of glands [22]. Though neither poorly differentiated nor undifferentiated carcinomas
were used in this study, they would have had to display between 5 to 39% of the tumor containing glands or less
than 5% of glandular structures, respectively [22]. In the
case of papillary ICC, we again followed the IARC classification for tumors of the gallbladder and extrahepatic bile
ducts [22], with the lesions having to consist predominantly of papillary structures lined by cells with a biliary
phenotype, with good demarcation and consisting of papillary structures lined by tall columnar cells [22].
RNA isolation from FFPE
RNA used was previously isolated from the dissected
FFPE sections using the miRNeasy FFPE kit (Qiagen)
[12] according to the manufacturer’s protocol and as
previously described [23]. Total RNA was eluted in a volume of 30 μL RNase-free water. Concentration, purity and
integrity for the RNA were determined by spectrophotometry (Nanodrop 1000) and Agilent 2100 Bioanalyzer/Agilent
RNA 6000 Nano Kit and Agilent Small RNA kit. Purified
RNA was stored at < −50°C.
RNA isolation from matched plasma
RNA was isolated from plasma using the miRNeasy
Serum/Plasma kit (Qiagen) according to manufacturer’s
protocol. Briefly, 1 mL QIAzol lysis reagent was added
to 200 μL thawed plasma, mixed and incubated at room
temperature for 5 minutes. As a miRNA mimic, 3.5 μL
of Spike-In Control (at 1.6 × 10⁸ copies/μL of cel-miR39-3p was added in addition to 200 μL chloroform
(Fisher). Following shaking, incubation and centrifugation, the upper aqueous phase was transferred and
900 μL ethanol (Acros Chemical) was added and transferred to the RNeasy MinElute column. The column was
washed with RWT, RPE, and 80% Ethanol (Acros Chemical), followed by drying and eluted in 14 μL RNase-free
water. The concentration, purity and integrity were analyzed and stored as described above.
Plieskatt et al. BMC Cancer (2015) 15:309
Page 5 of 15
Table 2 Histological gradings of samples used for RNA-Seq and qPCR analysis of miRNA expression profiles
ID
Sex Age Histological gradea Gross classification
Microarray
RNA-Seq analysis Paired plasma
analysis [12]
analysis (qPCR)
B070 M
61
WD
Mass-forming
X
X
B079 M
61
WD
Periductal infiltrating, invasive intraductal and mixed X
X
X
B083 F
53
WD
Mass-forming
X
X
X
B090 M
58
WD
Mass-forming
X
X
X
B099 M
48
WD
Mass-forming
X
X
X
Y042 M
61
WD
Mass-forming
X
X
X
B091 M
63
MD
Periductal infiltrating, invasive intraductal and mixed X
Y070 F
63
MD
Mass forming
Y056 F
56
PC
Periductal infiltrating, invasive intraductal and mixed X
Y062 M
57
PC
Periductal infiltrating, invasive intraductal and mixed X
X
B040 M
64
PC
Mass forming
X
X
X
Y083 F
51
PC
Mass forming
X
X
X
Y088 F
58
PC
Periductal infiltrating, invasive intraductal and mixed X
X
X
Y089 F
60
PC
Mass forming
X
X
Y093 M
63
PC
Periductal infiltrating, invasive intraductal and mixed X
X
X
Y096 F
64
PC
Mass forming
X
X
X
X
X
X
X
X
a
Histological types: tumor differentiation: WD = Well Differentiated tubular adenocarcinoma; MD = Moderately Differentiated tubular adenocarcinoma; and
PC = Papillary Carcinoma.
Samples were further annotated including TNM anud staging in [12].
Microarray analysis
Microarray analysis using the Agilent human miRNA
microarray (miRBase Release 16.0) of the FFPE cases is
extensively described in our previous manuscript [12]
and the data was used here to compare the results of the
two discovery platform microarray and small RNA-Seq
data comparison.
Small RNA sequencing
RNA purified from FFPE samples were depleted of
rRNA by treatment with the Ribo-Zero rRNA Removal
Kit (Cat. No. RZH1086, Epicentre), as described by the
manufacturer. Briefly, biotinylated capture probes directed against rRNA sequences were added to total RNA
samples and allowed to hybridize. Biotinylated complexes were removed using streptavidin-conjugated
microbeads and non-ribosomal RNAs precipitated in
ethanol. Libraries for small RNA sequencing were prepared using the TruSeq Small RNA Sample Prep Kit
(Illumina). Illumina libraries were constructed from
1,000 ng of total RNA. Briefly, indexed oligonucleotide
adapters were ligated to both the 3’-hydroxyl end and the
5’-phosphate end of the miRNAs using T4 RNA Ligase
(New England Biolabs). RNA was reverse-transcribed and
amplified using 14 cycles of PCR with primers targeting
the 5’- and 3’- adapters, a specific index sequence, and
Illumina sequencing adapters. The resulting products were
analyzed and quantified using Agilent 2100 BioAnalyzer
and the mole amount of mature miRNA present in the
library was estimated by integrating the area under the
curve in the 145–160 bp range. Individual libraries were
mixed to create multiplexed pools, the mixture was gel
purified, and the 145–160 bp range of RNA excised from
the gel, crushed using a Gel Breaker tube (IST Engineering),
eluted with nuclease-free water, and precipitated in ethanol.
The concentration of the final library pool was determined
using the PicoGreen system (Invitrogen) and the size distribution of the pool by the Agilent 2100 Bioanalyzer. Library
pools were normalized to 2 nM for sequencing. Sequencing
was performed using an Illumina Genome Analyzer IIx.
Library preparation and small RNA sequencing was
performed by Expression Analysis, A Quintiles Company
(Durham, NC).
MicroRNA alignment, mapping and annotation
Adapter sequences were clipped from deep sequencing
reads using FastqMcf ( />wiki/FastqMcf and initial quality assessment performed
using FastQC ( />projects/fastqc/). To analyze miRNA expression profiles
both miRDeep 2.0.0.5 [24] and miRExpress 2.0 [25] were
used. Briefly, short reads were mapped to the human
(UCSC hg19) genome allowing a minimum read length of
18, zero mismatches in the seed region and a maximum of
five genomic loci. Known human miRNAs were identified
and quantified based on miRBase Release 19 [26] entries.
Plieskatt et al. BMC Cancer (2015) 15:309
Using miRExpress known human miRNAs were identified
from miRBase Release 19 with an alignment identity of 1%
a tolerance range of four and a similarity threshold of 0.8
in the analysis. Differential expression analysis was performed separately for miRDeep and miRExpress using a
negative binomial distribution in EdgeR [27]. Only miRNAs with at least one count per million in at least half of
the samples analyzed were used in expression analysis and
counts were normalized using the trimmed mean of Mvalues normalization method [27]. For comparisons of
matched samples (i.e. ICC tumor versus distal histologically normal tissue from the same patient) a generalized
linear model was employed, using the Cox-Reid profileadjusted likelihood method for estimating dispersion [27].
For comparisons of tumor tissue to non-CCA normal tissue the quantile-adjusted conditional maximum likelihood method was employed using moderated tagwise
dispersion [27]. Differentially expressed miRNAs were
defined as having a Benjamini and Hochberg corrected
p value of < 0.05.
Quantitative real time PCR
cDNA was generated from 250 ng of purified plasma
RNA using the miScript RT II kit (Qiagen) with heparinase co-treatment during the RT reaction as described
[23]. qPCR analysis was performed using the miScript
SYBR Green PCR Kit (Qiagen) on custom printed 96 well
miScript miRNA arrays (SABiosciences). Selected miRNAs and normalization controls are shown in Additional
file 1: Table S2. qPCR was performed on a BioRad iCycler
iQ5 with an initial activation step of 95°C for 15 minutes
followed by 40 cycles of 3-step cycling (Denaturation,
15 seconds at 94°C; Annealing, 30 seconds at 55°C; and Extension, 30 seconds at 70°C) followed by melt curve analysis
for 81 cycles at 55°C and 20 second dwell time. Quantitation was performed using the ΔΔCt method [28]. Ct values
were exported and analyzed using SABiosciences data analysis tools ( />Samples were normalized using miR-103a, −15b, −16,
−191, −22 as well as cel-miR-39-3p (C. elegans mimic
spike-in control).
Database accession
Microarray data was previously prepared according to
MIAME standards and deposited in the GEO (Gene
Expression Omnibus Database, National Center for
Biotechnology Information, U.S. National Library of
Medicine, Bethesda, MD) under accession number
GSE53992. RNA sequence data have been submitted to the
Sequence Read Archive (National Center for Biotechnology
Information, U.S. National Library of Medicine, Bethesda,
MD) under accession number PRJNA275105 (Sample submission pending).
Page 6 of 15
Results
RNA of suitable concentration and purity were obtained
from FFPE and plasma samples
Using Qiagen’s miRNeasy FFPE kit, sections of FFPE
tumor tissue yielded purified RNA with 260/280 and
260/230 ratios of 2.0 and 1.9, respectively, indicating
that it was pure, and of suitable quality for downstream
applications [12]. RIN scores were between 2–3 for
RNA purified from FFPE samples, indicating degradation of larger RNA species, but, as miRNAs exhibit
greater robustness in FFPE tissue [29] and RIN values
have negligible effect on miRNA results [30], the purified RNA was considered suitable for further analysis
including RNA-seq. As plasma contains small quantities of miRNA/RNA [31] and, typically, the quantity
of plasma available is limited, we have previously evaluated techniques and kits to optimize isolation and yield
[23,32]. Initial cDNA synthesis reactions demonstrated
inhibition of transcription by residual heparin (co-purified from plasma samples) and this was overcome by
co-treatment of the RNA with Bacteroides heparinase I
during reverse transcription, as previously described
[32]. Subsequent cDNA derived from plasma RNA was
then successfully analyzed by qPCR using customized
miRNA plates coated with 85 CCA specific miRNAs.
Illumina sequencing showed enrichment of miRNA
species in RNA from FFPE samples
Using Illumina sequencing, the small RNA populations
from the following samples were characterized: (1) ICC
tumor tissue (CTT) (n = 14); (2) matched non-tumor
tissue microdissected from the same ICC tumor block
as the CTT but distal from observed dysplasia or frank
carcinoma (D-NT; n = 14); and (3) normal liver tissue
from biopsies of individuals undergoing gastric bypass
surgery at George Washington University (N-NT; n =
9). Two different histological grades of Ov-induced ICC
were represented in the sample set, well differentiated
(n = 6) and papillary tumor (n = 8). Moderately differentiated FFPE were not analyzed in this study due to the
lack of available tumor tissue. Approximately 246 million raw reads were obtained from these samples (∼10
million per sample) and, after quality filtering and short
read removal, ∼143 million reads were retained. Before
analysis with miRDeep, these reads were mapped to the
human genome using Bowtie (−n 3 -l 28) and the reads
successfully aligned ranged between 82—97% (average
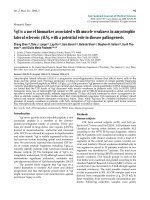
85%). Using miRDeep, reads were compressed and
remapped to the human genome and 86% of aligned
reads mapped to miRNA genes (∼47 million reads), 6%
to protein coding genes, and the remainder mapped to
various small non-coding RNA species (Figure 1A).
Counts were obtained for 690 miRNAs, each miRNA
possessing greater than one count per million (cpm) in
Plieskatt et al. BMC Cancer (2015) 15:309
Page 7 of 15
Figure 1 Summary of RNA-Seq analysis of CCA tumor tissue and controls. A. Mapping of short-reads to the human genome showed an enrichment
of miRNA species versus protein coding genes and other small non-coding RNA species; B. Top ten significantly (BH corrected p < 0.05) up- and
down-regulated miRNAs after differential expression analysis of tumor tissue and matched distal normal tissue. FC; Fold change, FDR; Benjamini and
Hochberg corrected p value; C. Linear regression analysis (solid line) of miRNA fold changes in tumor tissue versus matched distal normal tissue (D-NT)
and non-CCA normal liver tissue (N NT). Plot is annotated with the regression equation.
at least half of the samples. Analysis with miRExpress
provided similar results with counts for 617 miRNAs
obtained, each with greater than 1 cpm in at least half
of the samples.
ICC samples displayed a distinct profile of dysregulated
tissue-based miRNAs
MicroRNA expression profiles of CTT were compared
to their matched distal non-tumor tissue (D-NT). Using
an additive linear model in EdgeR, 67 miRNAs were
found to be significantly dysregulated when CTT were
compared to D-NT, with 32 miRNAs significantly
down-regulated and 35 significantly up-regulated
(Figure 1B) (Benjamini and Hochberg (BH) corrected p
value of < 0.05). The CTT expression profile was also
compared to non-tumor tissue taken from control
individuals (N-NT) and 316 miRNAs were called as
significantly dysregulated (BH corrected p < 0.05); 144
significantly up-regulated and 172 significantly downregulated (Figure 1B; Additional file 2: Table S1). The 316
significantly dysregulated miRNAs from the N-NT
comparison included all but eight of the miRNAs
identified as dysregulated when CTT tumor tissue was
compared with D-NT tissue and all of these had the same
direction of dysregulation.
MicroRNA profiles from ICC tumor tissue displayed more
similarity to distal tissue from the same block than with
normal “non tumor” tissue
The pattern of miRNA dysregulation from CTT samples
was similar when compared to both D-NT and N-NT
controls. Linear regression analysis of fold change (FC)
values from the two experiments gave an R2 value of
0.60 and a y-intercept of 0.19 (Figure 1C). However, the
magnitude of the FC values for miRNAs found to be significantly dysregulated was greater when CTT was compared to N-NT than when CTT was compared to D-NT
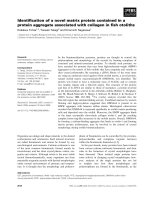
(Figure 1C). To visualize the grouping of test and control samples, multi-dimensional scaling (MDS) plots
were used as shown in Figure 2. These plots generate
distances between samples corresponding to the biological coefficient of variation between the most heterogeneous genes in each sample [27]. In MDS plots
comparing CTT and N-NT, a distinct grouping of tumor
and control tissue can be observed (Figure 2A, right).
Conversely, MDS plots comparing CTT and D-NT
showed no distinct grouping of tumor and control tissue
(Figure 2A, left), suggesting fewer differences between
these sample types. When D-NT and N-NT miRNA
levels were directly compared, clear differences were observed: 200 miRNAs were significantly dysregulated,
with 116 up-regulated and 84 down-regulated. The two
Plieskatt et al. BMC Cancer (2015) 15:309
Page 8 of 15
Figure 2 Multi-dimensional scaling plots comparing miRNA expression levels in different tissue. A. Multi-dimensional scaling plots comparing
miRNA expression levels in CCA tissue versus matched distal normal tissue (Distal) and non-CCA normal liver tissue (Non-CCA). When compared
to non-CCA normal tissue, tumor tissue grouped together but fewer differences where observed when comparing tumor tissue to its matched
distal normal tissue. B. Comparison of miRNA expression in the two control samples, D-NT and N-NT. Multi-dimensional scaling plot of
comparison between raw counts obtained from D-NT and N-NT. A clear differentiation between the two samples can be seen.
types of control samples (D-NT and N-NT) clearly clustered into two distinct groups when compared in a MDS
plot (Figure 2B).
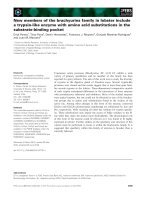
Papillary tumors exhibited greater miRNA dysregulation
than well-differentiated tumors
Sufficient RNA was recovered from papillary ICC (n = 8)
and well differentiated ICC (n = 6) samples to compare
the effect of histological differentiation on miRNA profiles.
No significantly dysregulated miRNAs were identified
in well-differentiated tumor samples, when compared
to D-NT. Conversely, 147 dysregulated miRNAs were
identified in papillary tumors when compared to DNT, with 78 up-regulated and 69 down-regulated
(Additional file 2: Table S1). These included 64 of the
67 miRNAs found to be dysregulated when comparing all 14 tumor samples to D-NT controls. This can
be observed visually in MDS plots, comparing papillary and well-differentiated tumor tissue to their
matched D-NT tissue, with papillary tumor samples
forming a distinct group versus the control groups.
Well differentiated ICC did not form a unique group
(Figure 3 top row). Both forms of tumor tissue
grouped together when compared to N-NT (Figure 3
bottom row) and, once again, well differentiated tissue had fewer significantly dysregulated miRNAs
(245) than papillary tissue (322). The majority of dysregulated miRNAs (71%) in the papillary tumors
when compared to D-NT were also identified as dysregulated in the comparison with N-NT.
Small RNA-Seq profiling of ICC tissue verified microarray
profiling
In previous work [12], we comprehensively profiled these
very same tumor tissue samples using the Agilent human
miRNA microarray (miRBase Release 16.0). In comparison
to Illumina sequencing, microarray analysis resulted in the
identification of 28 (cf. 147 using NGS) and 120 (cf. 322
using NGS) dysregulated miRNAs in papillary tissue versus
D-NT and N-NT controls respectively. Likewise, in well
differentiated tissue 12 (cf. none using NGS) and 61 (cf.
245 using NGS) dysregulated miRNAs were identified. On
both platforms a subset of 20, 15 and 49 common miRNAs
were identified in comparisons of well differentiated tissue
to N-NT, papillary tissue to D-NT and papillary tissue to
N-NT, respectively (Additional file 1: Figure S1A). Previous
studies have shown that statistical measures of significance
can vary when analyzing differential expression by microarray versus NGS platforms [23,33]. Accordingly, FC values
of significantly dysregulated miRNAs from the microarray
study were compared to the FC values of the same miRNAs determined using RNA-Seq, with a strong association
observed between the values (Pearson’s coefficient (PC) of
0.94; Additional file 3: Figure S1B). For papillary ICC
tissue samples, there was a good correlation (PC = 0.97;
Additional file 3: Figure S1B) for miRNAs significantly
dysregulated using both discovery methods. Likewise,
although no miRNAs were significantly dysregulated in
the RNA-Seq of well-differentiated ICC, a comparison
of the FC values determined by microarray and by
RNA-Seq showed a reasonable association (PC = 0.63;
Additional file 3: Figure S1B).
Plieskatt et al. BMC Cancer (2015) 15:309
Page 9 of 15
Figure 3 Multi-dimensional scaling plots comparing differently graded tumor tissue to matched normal distal tissue and non-CCA normal liver
tissue. EdgeR [27] was used to measure distances between the miRNA expression profile of papillary and well differentiated tumor tissue to D-NT
and N-NT. When compared to non-CCA normal liver tissue both papillary and well differentiated tumor samples were clearly distinguishable from
the control samples. Conversely, when compared to matched D-NT only papillary samples were clearly distinguishable from the control samples.
PCR of matched plasma samples revealed a miRNA
expression profile specific to ICC
Following the dysregulated miRNA identification pipeline
from tissue-based discovery to verification in blood, eightyfive dysregulated miRNAs (Additional file 1: Table S2) were
included on custom-made qPCR plates based on the
significant dysregulation observed in both microarray
analysis [12] and in small RNA-Seq profiling of the
same Ov-induced ICC tumor tissue performed here.
The custom printed PCR plates were used to screen
plasma-isolated RNA paired with the Ov-induced ICC
tissue samples used in microarray and small RNA-Seq.
Four Ov-associated ICC plasma samples from patients
with well differentiated ICC, two with moderately differentiated ICC, and six with papillary ICC were analyzed by qPCR. All samples were matched to the tissues
analyzed using RNA-Seq, with the exception of the
moderately differentiated samples (see Table 2). Five
plasma controls for normalization were included, along
with a C. elegans control (miRTC), and PCR controls
for normalization and quality control (PPC) (Additional
file 1: Table S2).
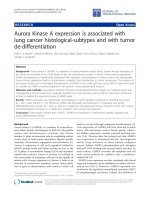
When plasma from matched Ov-induced ICC samples,
regardless of histology, were compared to control
plasma, seven miRNAs were found to be dysregulated
(Figure 4). When histology was considered, six, three
and six miRNas were dysregulated in moderately differentiated, papillary and well differentiated ICC, respectively
(Figure 4). Interestingly, the 15 most highly dysregulated
miRNAs observed in the tissue-based discovery stage were
absent in paired plasma samples (Figure 5, Additional file 4:
Table S3). Accordingly, these 15 miRNAs appear to be dysregulated exclusively in tumor tissue. Moreover, while seven
miRNAs were amplified in both case and control plasma,
eight miRNAs were amplified exclusively in the ICC
plasma but not in control plasma, suggesting a circulating
miRNA profile exclusive to ICC (Figure 5, Additional file 4:
Table S3). Surprisingly, only two of these 8 miRNAs were
down-regulated in tissue using RNA-Seq. Indeed, there
was a slight inverse ratio between expression levels of
dysregulated miRNAs in tissue and plasma (PC between −0.20 and −0.28 for the differently graded tissue)
(Figure 6). This was particularly evident in miRNAs
significantly dysregulated in plasma samples. Thirteen
miRNAs were dysregulated in at least one of the above
comparisons and seven of these showed an inverse FC
when compared to their expression in ICC (Figure 6B).
Discussion
MicroRNAs have great potential as predictive, diagnostic
and prognostic biomarkers for Ov-induced ICC, making
an understanding of the ways in which miRNA expression
levels vary during ICC tumor progression essential. This
manuscript expands on our previous tissue-based miRNA
discovery efforts by microarray (miRBase 16.0) by employing Next Generation Sequencing (small RNA-Seq) on the
same sample set [12]. Here, we again observed that increasing histological differentiation of Ov-induced ICC
tumors is reflected in an increasing number and magnitude of dysregulated miRNAs, suggesting that miRNA
regulation is a key process in tumor differentiation. The
use of small RNA-Seq also confirmed that adjacent nontumor tissue (D-NT), which has with no dysplasia or frank
carcinoma, shares similar miRNA dysregulation profiles
with adjacent tumor tissue (CTT). Finally, our analysis of
matched plasma samples by quantitative PCR showed
Plieskatt et al. BMC Cancer (2015) 15:309
Page 10 of 15
Figure 4 Circulating miRNA expression profiles determined using qPCR. Customized qPCR plates were used to profile 85 miRNAs dysregulated in CCA
tumor tissue. Volcano plots show log fold change for each miRNA assayed versus log of the P value. Dotted lines represent 2-fold dysregulation and
the solid line represents a p value of 0.05. Comparisons were made between all plasma from all CCA patients (All) and five non-endemic normal plasma
control samples. Comparisons were also made between control samples and tumor samples grouped by the histological grading of the matched
tumor sample.
than an eight-miRNA expression profile strongly associated with ICC.
Due to the location of ICC tumors in the upper hepatoduodenal ligament and the proximity of these tumors
to the lymphatic and vascular systems of the liver [2], we
expected ICC tumors to shed miRNAs into the blood
stream, as observed with other solid tumors (e.g., metastatic breast, colon, and prostate cancers as reviewed in
[19]). As Ov-induced ICC poses unique diagnostic and
prognostic challenges, an accessible early diagnostic
Figure 5 Summary of miRNAs detected during PCR analysis of plasma samples. Custom-made qPCR plates were used to profile 85 miRNAs found
to be dysregulated in CCA tumor tissue. Fifteen miRNAs, highly dysregulated in tumor tissue, were not detected in any plasma samples and eight
were detected in all ICC plasma samples but no controls. Thirty-six miRNAs were detected in all plasma samples, including those miRNAs found
to be differentially expressed in ICC plasma.
Plieskatt et al. BMC Cancer (2015) 15:309
Page 11 of 15
Figure 6 Log fold changes in miRNA expression in FFPE tumor tissue versus plasma. A. Scatter plots showing correlations between log fold
changes (FC) in CCA tissue and matched tissue samples. A weak negative correlation was observed across all miRNAs assayed in qPCR
experiments when compared with their FC in matched tissue samples. B. Comparison of miRNA FC in plasma and matched tissue samples in
thirteen dysregulated miRNAs. Dysregulated miRNAs include those from all comparisons, including each of the histological grading comparisons.
Of these thirteen miRNAs, seven exhibited inverse expression values between plasma and tissue. Asterisk denotes that the miRNA was observed
to be significantly dysregulated in RNA-Seq experiments comparing all tumor samples to matched distal normal tissue and an exclamation mark
denotes that the miRNA was found to be significantly dysregulated in the comparison of papillary tumor tissue with its matched distal normal sample.
marker in blood is greatly needed. Towards this end, we
generated a custom made qPCR plate containing miRNAs found to be dysregulated in ICC tumor tissue by
small RNA-Seq to target these miRNAs in plasma
matched samples. Eight of these dysregulated miRNAs
in plasma emerged as strongly associated with ICC: i.e.,
eight dysregulated miRNAs were identified in all Ovinduced ICC plasma samples and not in control plasma
(Figure 5). Interestingly, a negative correlation was observed between the expression levels of these eight miRNAs in tissue and in their matched plasma samples
(Figure NA), with seven displaying opposite expression
changes in plasma to that in tissue (miR-1275, miR-193a5p, miR199b-5p, miR-320a, miR-483-5p, miR-505-3p,
miR-874) (Figure NB). A similar inverse relationship
between tissue and blood based miRNA dysregulation
has been reported for several other cancers and pathologies, including for another infection-related cancer
(nasopharyngeal carcinoma) by our own group [23], as
well as breast cancer [34], endometrioid endometrial carcinoma [35], leukemia [36], neointimal hyperplasia [37]
and also in atherosclerotic abdominal aortic aneurysm
[38]. An additional 13 significantly dysregulated miRNAs
were observed only when matched plasma was compared
Plieskatt et al. BMC Cancer (2015) 15:309
to control plasma, indicative of miRNA solely found circulating in the plasma of NPC cases not found in their
tumor tissue. These results reflect on the possible different
functions of miRNAs in tissue and circulating in peripheral blood. Moreover, the recent finding of circulating exosomes (or microvesicles) “laden” with miRNAs secreted
from the bile duct of individuals with ICC offers intriguing
possibilities for miRNA trafficking. As exosomes are actively exported from cells and incorporated into cells from
the blood, they offer an explanation that cancer cells are
able to selectively export or import particular miRNAs via
these microvesicles, which would explain the inverse
expression levels in tissue and plasma [36,39].
In this regard, the absence of a linear association
between miRNA expression levels in tumor tissue and
blood suggests that the primary focus of plasma biomarker discovery should be the plasma itself and not the
primary tumor tissue, as we have previously assumed for
our biomarker discovery pipeline [12,23]. The finding of
divergent expression profiles in tumor tissue and
matched plasma samples is especially intriguing for Ovinduced ICC, given the proximity of Ov-induced ICC tumors to the lymphatic and vascular systems of the liver
[2]. In addition to the validation in a large sample set of
potential miRNA biomarkers identified here, we plan to
investigate the trafficking of miRNAs by exosomes in future studies. Moreover, multiple novel miRNAs (not in
miRBase) were detected in the tissue samples examined
by RNA-seq and we plan to validate the association of
these miRNAs with ICC in plasma and tissue and determine whether they are human miRNAs and not contributed by Ov during infection.
Ov-induced ICC tumor tissue showed few differences
from adjacent “non-tumor tissue” (D-NT) in miRNA expression profile (see the MDS plot in Figure 2A). However, when histological grade was taken into account,
papillary ICC tumor did show significant differences
compared to its adjacent non-tumor tissue D-NT, while
well-differentiated tissue exhibited no differentiation
with paired distal tissue (Figure 3). This suggests a regulation of different subsets of miRNAs during tumor progression, an observation consistent with findings in
hepatocarcinoma [40,41], where differences in the composition, numbers and relative expression levels of
miRNA increase with increasing histological differentiation. Functional studies also suggest that associations
between the miRNA expression profile and histological
grade are derived from miRNA regulation of key processes in tumor differentiation [40,41]. In this context,
the differences observed in miRNA dysregulation between papillary and well differentiated tumor tissue in
this study, likely reflect the fact that, by definition, well
differentiated tumor tissue has the most resemblance to
the bile duct tissue from which the tumor arose.
Page 12 of 15
Similarly, in comparisons of differently graded tumor
with N-NT, well differentiated tissue exhibited fewer differences with the control tissue than papillary tissue. Indeed, in all comparisons using either D-NT or N-NT
control tissue similar expression profiles were observed
(as reflected in the PC of 0.60 between fold-change
values generated using the two controls) but with greater
magnitude of dysregulation in comparisons using N-NT.
Tumors and their surrounding microenvironment are in
constant interaction and the greater similarity between
D-NT and CTT could reflect the influence of the tumor
on surrounding tissue. Although, in this study, the difficultly in obtaining control tissue (discussed below) makes
it difficult to ascertain the extent of such an effect.
We also tested different discovery platforms to identify
signatures of miRNAs in Ov-induced ICC tumor FFPE tissue. Our previous approach [12] used a “targeted platform”,
where known miRNAs were surveyed in ICC FFPE samples
by a microarray built using miRBase 16 [26]. Here, we used
an “untargeted” discovery approach, with a high throughput
analysis of all small RNA species in case and control FFPE
and found that the expression profiles determined by Illumina sequencing were similar to those determined in our
microarray studies of Ov-induced ICC [12]. Robust correlations were observed between miRNA expression ratios
obtained by microarray [12] with those obtained by Illumina miRNA sequencing (PCs of 0.97 and 0.63 for papillary and well differentiated tumors respectively as shown in
Additional file 3: Figure S1). When comparing significantly
dysregulated miRNAs, however, differences were observed
between the two methods (Additional file 3: Figure S1A).
In previous work comparing microarray and NGS analysis
of miRNA expression levels, we [23], and others [33], have
reported variations in the statistical assessment of
significantly dysregulated miRNAs despite the overall
similarity in fold change values. This may be due to crosshybridization of closely related miRNA species on the
microarray [23,33] or differences in the statistical methods
employed by the two platforms, for example t-tests in
microarray analysis and empirical Bayes estimation and
exact tests based on the negative binomial distribution
in NGS [27]. However, in the current manuscript the
strong similar profiles obtained by these two discovery
platforms suggests that the miRNA profiles reported
here are an accurate representation of those for tissuebased miRNAs for Ov-induced ICC, despite differences
in significance calling between the two platforms.
An obvious limitation of the current study was the
lack of a predominantly cholangiocytic control tissue. As
this type of sample is extremely rare, normal liver tissue
(N-NT) obtained from liver biopsies of patients undergoing gastric bypass surgery was the best available control to represent liver tissue from non-Ov-induced ICC
individuals. Nonetheless, the results reported here are,
Plieskatt et al. BMC Cancer (2015) 15:309
for the most part, in accord with literature (Table 1)
suggesting not only that these results are an accurate reflection of the miRNA expression profile of Ov-induced
ICC but that miRNAs reported here could have some
utility in non-Ov-induced cholangiocarcinoma. Despite
the limitations imposed by this control sample, it is clear
that the miRNA profiles of D-NT tissue were more
similar to ICC tumor tissue than to normal liver tissue
N-NT. When ICC tumor tissue was compared to D-NT
tissue, MDS plots showed differences in miRNA profiles
when comparing tumor expression profiles to N-NT but
not when compared to D-NT. Apart from intrinsic
differences between the tumor tissue and N-NT, it is
well documented that the tumor microenvironment is a
major contributor to metastatic potential and the similarities between tumor tissue and their nearby non
tumor tissue (D-NT) reflect this. Metastasis is closely
associated with changes such as epithelial-mesenchymal
transition, angiogenesis, matrix degradation, and stroma
remodeling that occurs in the microenvironment [42]. A
large number of miRNAs have been associated with metastasis (reviewed in [43]), at least one, miR-1 (also
found to be dysregulated in this study), has been shown
to directly influence the microenvironment of glioblastomas [44]. Another miRNA identified in our analysis,
miR210, has been repeatedly implicated in the establishment of hypoxia [45-47]. Interestingly, in the work
described here, miR-210 was significantly up-regulated
in tumor tissue when compared to N-NT but not when
compared to D-NT, suggesting a role for this miRNA in
the establishment of a hypoxic microenvironment in Ovinduced ICC. Extracellular exosomal transport of miR210 and possible uptake by endothelial cells has been
shown in leukemic and metastatic cancer cells [48,49]
and the results reported are consistent with the potential
trafficking of miRNAs to areas adjacent to the tumor.
Conclusions
In summary, this is the first comparative analysis using
the latest available methods and matrices for the discovery of Ov-induced biomarkers for ICC. We show that
optimized extraction protocols could produce sufficient
RNA from FFPE and plasma for miRNA discovery and
verification. While our study also showed the marked reproducibility between the two different miRNA discovery
platforms (microarray and small RNA-Seq) when applied
to FFPE, we concluded that RNA-Seq is the more informative method given its untargeted nature and the concomitant possibility of discovering novel miRNAs associated
with a tumor. Third, and most intriguing, while the dysregulation profiles for subtypes of Ov-induced ICC tumors
were not as strong in plasma as in matched tissue, eight
miRNAs were identified only in case plasma and not
control plasma, regardless of histology, as well as 13
Page 13 of 15
dysregulated miRNAs detected solely in plasma. The
results of this novel effort reflect the possible different
functions of miRNAs for Ov-induced ICC in tissue and in
peripheral blood and, more importantly, identify a candidate circulating miRNA profile that should be further
explored as diagnostic biomarker in peripheral blood for
Ov-induced ICC.
Additional files
Additional file 1: Table S2. qPCR Plate Layout.
Additional file 2: Table S1. EdgeR output from miRNA differential
expression analysis.
Additional file 3: Figure S1. Regression analysis comparing fold
change (FC) values from miRNAs identified as significantly dysregulated
in microarray analysis to FC values from RNA-Seq analysis of the same
tissue. When all samples where compared to their matched D-NT tissue
FC values were strongly correlated (Pearson’s correlation of 0.94; PC on
graph). Similarly, when analyses were broken into comparisons between
samples of the same histological grade, strong correlation was observed
in the FC values obtained using both methods.
Additional file 4: Table S3. Summary of miRNA expression in plasma
as measured using custom-made qPCR plate.
Competing interests
The authors declare that they have no competing interests.
Authors’ contributions
JPl carried out molecular studies, contributed to drafting the manuscript and
helped conceive the project. GR carried out molecular studies and
contributed to drafting the manuscript. YF carried out molecular studies. JP,
SE CP, VB, and BS participated in the design of the study and helped draft
the study. XJ and JPo conducted bioinformatics analysis and contributed to
drafting the manuscript. JB and JM conceived the project, participated in the
design of the study and drafted the manuscript. All authors read and
approved the final manuscript.
Acknowledgments
The contents are solely the responsibility of the authors and do not
represent the official views of NIAID, NCI, the Katzen Cancer Research Center
of the George Washington University, or the NHMRC of Australia. This
research was partially supported by awards R01CA155297 (JMB, JPM, and
PJB) from the National Cancer Institute, P50AI098639 (BS, JMB, and PJB) from
the National Institute of Allergy and Infectious Disease, fellowship support
(JPM) and research support (JMB and JPM - grant number 1051627) from the
National Health and Medical Research Council of Australia, and research
support from the Dr. Cyrus And Myrtle Katzen Cancer Research Center at the
George Washington University (PJB and JMB).
Author details
1
Department of Microbiology, Immunology and Tropical Medicine, School of
Medicine and Health Sciences, George Washington University, Washington,
DC 20037, USA. 2Research Center for Neglected Diseases of Poverty, School
of Medicine and Health Sciences, George Washington University,
Washington, DC 20037, USA. 3Department of Pathology, School of Medicine
and Health Sciences, George Washington University, Washington, DC 20037,
USA. 4QIMR Berghofer Medical Research Institute, Infectious Disease and
Cancer, Brisbane, Queensland 4006, Australia. 5Faculty of Medicine, Khon
Kaen University, Khon Kaen 40002, Thailand. 6The University of Queensland,
School of Biomedical Sciences, Brisbane, Queensland 4072, Australia.
Received: 23 November 2014 Accepted: 25 March 2015
Plieskatt et al. BMC Cancer (2015) 15:309
References
1. Khan SA, Thomas HC, Davidson BR, Taylor-Robinson SD. Cholangiocarcinoma.
Lancet. 2005;366:1303–14.
2. Sripa B, Bethony JM, Sithithaworn P, Kaewkes S, Mairiang E, Loukas A, et al.
Opisthorchiasis and Opisthorchis-associated cholangiocarcinoma in Thailand
and Laos. Acta Trop. 2011;120 Suppl 1:S158–68.
3. Sripa B, Kaewkes S, Sithithaworn P, Mairiang E, Laha T, Smout M, et al. Liver
fluke induces cholangiocarcinoma. PLoS Med. 2007;4, e201.
4. IARC. Schistosomes, liver flukes and helicobacter pylori. IARC monographs
on the evaluation of carcinogenic risks to humans. In: IARC monographs on
the evaluation of carcinogenic risks to humans, vol. volume 61. Lyon: IARC;
1994. p. 218–21.
5. Sripa B, Brindley PJ, Mulvenna J, Laha T, Smout MJ, Mairiang E, et al.
The tumorigenic liver fluke Opisthorchis viverrini–multiple pathways to
cancer. Trends Parasitol. 2012;28:395–407.
6. Malhi H, Gores GJ. Cholangiocarcinoma: modern advances in understanding
a deadly old disease. J Hepatol. 2006;45:856–67.
7. Blechacz B, Gores GJ. Cholangiocarcinoma: advances in pathogenesis,
diagnosis, and treatment. Hepatology. 2008;48:308–21.
8. Pritchard CC, Cheng HH, Tewari M. MicroRNA profiling: approaches and
considerations. Nat Rev Genet. 2012;13:358–69.
9. Wang S, Yin J, Li T, Yuan L, Wang D, He J, et al. Upregulated circulating
miR-150 is associated with the risk of intrahepatic cholangiocarcinoma.
Oncol Rep. 2015;33:819–25.
10. Chusorn P, Namwat N, Loilome W, Techasen A, Pairojkul C, Khuntikeo N, et al.
Overexpression of microRNA-21 regulating PDCD4 during tumorigenesis of
liver fluke-associated cholangiocarcinoma contributes to tumor growth and
metastasis. Tumour Biol. 2013;34:1579–88.
11. O’Hara SP, Gradilone SA, Masyuk TV, Tabibian JH, LaRusso NF. MicroRNAs in
cholangiopathies. Curr Pathobiol Rep. 2014;2:133–42.
12. Plieskatt JL, Rinaldi G, Feng Y, Peng J, Yonglitthipagon P, Easley S, et al.
Distinct miRNA signatures associate with subtypes of cholangiocarcinoma
from infection with the tumourigenic liver fluke Opisthorchis viverrini.
J Hepatol. 2014;61:850–8.
13. Bartel DP. MicroRNAs: genomics, biogenesis, mechanism, and function.
Cell. 2004;116:281–97.
14. Cullen BR. Viruses and microRNAs. Nature Genet. 2006;38:S25–30.
15. He L, Hannon GJ. MicroRNAs: small RNAs with a big role in gene regulation.
Nature Rev Genet. 2004;5:522–31.
16. Huang X, Yuan T, Tschannen M, Sun Z, Jacob H, Du M, et al.
Characterization of human plasma-derived exosomal RNAs by deep
sequencing. BMC Genomics. 2013;14:319.
17. Chen SJ, Chen GH, Chen YH, Liu CY, Chang KP, Chang YS, et al.
Characterization of Epstein-Barr virus miRNAome in nasopharyngeal
carcinoma by deep sequencing. PLoS ONE. 2010;5, e12745.
18. Wittmann J, Jäck HM. Serum microRNAs as powerful cancer biomarkers.
Biochim Biophys Acta. 2010;1806:200–7.
19. Asaga S, Kuo C, Nguyen T, Terpenning M, Giuliano AE, Hoon DS. Direct
serum assay for microRNA-21 concentrations in early and advanced breast
cancer. Clin Chem. 2011;57:84–91.
20. Pu XX, Huang GL, Guo HQ, Guo CC, Li H, Ye S, et al. Circulating miR-221
directly amplified from plasma is a potential diagnostic and prognostic
marker of colorectal cancer and is correlated with p53 expression.
J Gastroenterol Hepatol. 2010;25:1674–80.
21. Resnick KE, Alder H, Hagan JP, Richardson DL, Croce CM, Cohn DE. The detection
of differentially expressed microRNAs from the serum of ovarian cancer patients
using a novel real-time PCR platform. Gynecol Oncol. 2009;112:55–9.
22. Hamilton SR, Aaltonen LA. Pathology and genetics of tumours of the
digestive system. In: World Health Organization Classification of Tumors.
Lyon: IARC press; 2000.
23. Plieskatt JL, Rinaldi G, Feng Y, Levine PH, Easley S, Martinez E, et al. Methods
and matrices: approaches to identifying miRNAs for Nasopharyngeal
carcinoma. J Transl Med. 2014;12:3.
24. Friedländer MR, Chen W, Adamidi C, Maaskola J, Einspanier R, Knespel S,
et al. Discovering microRNAs from deep sequencing data using miRDeep.
Nat Biotechnol. 2008;26:407–15.
25. Wang WC, Lin FM, Chang WC, Lin KY, Huang HD, Lin NS. miRExpress:
analyzing high-throughput sequencing data for profiling microRNA
expression. BMC Bioinformatics. 2009;10:328.
26. Kozomara A, Griffiths-Jones S. miRBase: integrating microRNA annotation
and deep-sequencing data. Nucleic Acids Res. 2011;39:D152–7.
Page 14 of 15
27. Robinson MD, McCarthy DJ, Smyth GK. EdgeR: a Bioconductor package for
differential expression analysis of digital gene expression data.
Bioinformatics. 2010;26:139–40.
28. Livak KJ, Schmittgen TD. Analysis of relative gene expression data using
real-time quantitative PCR and the 2(−Delta Delta C(T)) Method. Methods.
2001;25:402–8.
29. Xi Y, Nakajima G, Gavin E, Morris CG, Kudo K, Hayashi K, et al. Systematic
analysis of microRNA expression of RNA extracted from fresh frozen and
formalin-fixed paraffin-embedded samples. RNA. 2007;13:1668–74.
30. Jung M, Schaefer A, Steiner I, Kempkensteffen C, Stephan C, Erbersdobler A,
et al. Robust microRNA stability in degraded RNA preparations from human
tissue and cell samples. Clin Chem. 2010;56:998–1006.
31. Wang K, Yuan Y, Cho JH, McClarty S, Baxter D, Galas DJ. Comparing the
MicroRNA spectrum between serum and plasma. PLoS ONE. 2012;7, e41561.
32. Plieskatt, JL, Feng, Y, Rinaldi, G, Mulvenna, JP, Bethony, JM, Brindley, PJ:
Circumventing qPCR inhibition to amplify miRNAs in plasma. Biomark Res.
2014. In press
33. Git A, Dvinge H, Salmon-Divon M, Osborne M, Kutter C, Hadfield J, et al.
Systematic comparison of microarray profiling, real-time PCR, and
next-generation sequencing technologies for measuring differential
microRNA expression. RNA. 2010;16:991–1006.
34. Guo L, Zhao Y, Yang S, Cai M, Wu Q, Chen F. Genome-wide screen for
aberrantly expressed miRNAs reveals miRNA profile signature in breast
cancer. Mol Biol Rep. 2013;40:2175–86.
35. Torres A, Torres K, Pesci A, Ceccaroni M, Paszkowski T, Cassandrini P, et al.
Deregulation of miR-100, miR-99a and miR-199b in tissues and plasma
coexists with increased expression of mTOR kinase in endometrioid
endometrial carcinoma. BMC Cancer. 2012;12:369.
36. Tanaka M, Oikawa K, Takanashi M, Kudo M, Ohyashiki J, Ohyashiki K, et al.
Down-regulation of miR-92 in human plasma is a novel marker for acute
leukemia patients. PLoS ONE. 2009;4, e5532.
37. Liu X, Cheng Y, Zhang S, Lin Y, Yang J, Zhang C. A necessary role of
miR-221 and miR-222 in vascular smooth muscle cell proliferation and
neointimal hyperplasia. Circ Res. 2009;104:476–87.
38. Kin K, Miyagawa S, Fukushima S, Shirakawa Y, Torikai K, Shimamura K, et al.
Tissue- and plasma-specific MicroRNA signatures for atherosclerotic
abdominal aortic aneurysm. J Am Heart Assoc. 2012;1:e000745.
39. Ohyashiki K, Umezu T, Yoshizawa S, Ito Y, Ohyashiki M, Kawashima H, et al.
Clinical impact of down-regulated plasma miR-92a levels in non-Hodgkin’s
lymphoma. PLoS ONE. 2011;6:e16408.
40. Braconi C, Patel T. MicroRNA expression profiling: a molecular tool for defining
the phenotype of hepatocellular tumors. Hepatology. 2008;47:1807–9.
41. Murakami Y, Yasuda T, Saigo K, Urashima T, Toyoda H, Okanoue T, et al.
Comprehensive analysis of microRNA expression patterns in hepatocellular
carcinoma and non-tumorous tissues. Oncogene. 2006;25:2537–45.
42. Koontongkaew S. The tumor microenvironment contribution to
development, growth, invasion and metastasis of head and neck squamous
cell carcinomas. J Cancer. 2013;4:66–83.
43. Su Y, Li X, Ji W, Sun B, Xu C, Li Z, et al. Small molecule with big role: MicroRNAs
in cancer metastatic microenvironments. Cancer Lett. 2013;344:147–56.
44. Bronisz A, Wang Y, Nowicki MO, Peruzzi P, Ansari K, Ogawa D, et al. Extracellular
vesicles modulate the glioblastoma microenvironment via a tumor suppression
signaling network directed by miR-1. Cancer Res. 2013;74:738–50.
45. Gee HE, Camps C, Buffa FM, Patiar S, Winter SC, Betts G, et al. Hsa-mir-210 is
a marker of tumor hypoxia and a prognostic factor in head and neck
cancer. Cancer. 2010;116:2148–58.
46. Huang X, Ding L, Bennewith KL, Tong RT, Welford SM, Ang KK, et al.
Hypoxia-inducible mir-210 regulates normoxic gene expression involved in
tumor initiation. Molecular cell. 2009;35:856–67.
47. Ho AS, Huang X, Cao H, Christman-Skieller C, Bennewith K, Le QT, et al.
Circulating miR-210 as a novel hypoxia marker in pancreatic cancer.
Transl Oncol. 2010;3:109.
48. Kosaka N, Iguchi H, Hagiwara K, Yoshioka Y, Takeshita F, Ochiya T. Neutral
sphingomyelinase 2 (nSMase2)-dependent exosomal transfer of angiogenic
microRNAs regulate cancer cell metastasis. J Biol Chem. 2013;288:10849–59.
49. Tadokoro H, Umezu T, Ohyashiki K, Hirano T, Ohyashiki JH. Exosomes
derived from hypoxic leukemia cells enhance tube formation in endothelial
cells. J Biol Chem. 2013;288:34343–51.
50. Meng F, Henson R, Wehbe-Janek H, Smith H, Ueno Y, Patel T. The MicroRNA
let-7a modulates interleukin-6-dependent STAT-3 survival signaling in
malignant human cholangiocytes. J Biol Chem. 2007;282:8256–64.
Plieskatt et al. BMC Cancer (2015) 15:309
51. Meng F, Henson R, Lang M, Wehbe H, Maheshwari S, Mendell JT, et al.
Involvement of human micro-RNA in growth and response to chemotherapy
in human cholangiocarcinoma cell lines. Gastroenterology. 2006;130:2113–29.
52. Lu L, Byrnes K, Han C, Wang Y, Wu T. miR-21 targets 15-PGDH and promotes
cholangiocarcinoma growth. Mol Cancer Res. 2014;12:890–900.
53. He Q, Cai L, Shuai L, Li D, Wang C, Liu Y, et al. Ars2 is overexpressed in
human cholangiocarcinomas and its depletion increases PTEN and PDCD4
by decreasing microRNA-21. Mol Carcinog. 2013;52:286–96.
54. Selaru FM, Olaru AV, Kan T, David S, Cheng Y, Mori Y, et al. MicroRNA-21 is
overexpressed in human cholangiocarcinoma and regulates programmed
cell death 4 and tissue inhibitor of metalloproteinase 3. Hepatology.
2009;49:1595–601.
55. Razumilava N, Bronk SF, Smoot RL, Fingas CD, Werneburg NW, Roberts LR,
et al. miR-25 targets TNF-related apoptosis inducing ligand (TRAIL) death
receptor-4 and promotes apoptosis resistance in cholangiocarcinoma.
Hepatology. 2012;55:465–75.
56. Zhang J, Han C, Wu T. MicroRNA-26a promotes cholangiocarcinoma growth
by activating β-catenin. Gastroenterology. 2012;143:246–56.
57. Yang R, Chen Y, Tang C, Li H, Wang B, Yan Q, et al. MicroRNA-144 suppresses
cholangiocarcinoma cell proliferation and invasion through targeting platelet
activating factor acetylhydrolase isoform 1b. BMC Cancer. 2014;14:917.
58. Hu C, Huang F, Deng G, Nie W, Huang W, Zeng X. miR-31 promotes
oncogenesis in intrahepatic cholangiocarcinoma cells via the direct
suppression of RASA1. Exp Ther Med. 2013;6:1265–70.
59. Yang H, Li TW, Peng J, Tang X, Ko KS, Xia M, et al. A mouse model of
cholestasis-associated cholangiocarcinoma and transcription factors
involved in progression. Gastroenterology. 2011;141:378–88.
60. Zhong XY, Yu JH, Zhang WG, Wang ZD, Dong Q, Tai S, et al. MicroRNA-421
functions as an oncogenic miRNA in biliary tract cancer through
down-regulating farnesoid X receptor expression. Gene. 2012;493:44–51.
61. Mott JL, Kobayashi S, Bronk SF, Gores GJ. mir-29 regulates Mcl-1 protein
expression and apoptosis. Oncogene. 2007;26:6133–40.
62. Okamoto K, Miyoshi K, Murawaki Y. miR-29b, miR-205 and miR-221 enhance
chemosensitivity to gemcitabine in HuH28 human cholangiocarcinoma
cells. PLoS ONE. 2013;8:e77623.
63. Zeng B, Li Z, Chen R, Guo N, Zhou J, Zhou Q, et al. Epigenetic regulation of
miR-124 by hepatitis C virus core protein promotes migration and invasion
of intrahepatic cholangiocarcinoma cells by targeting SMYD3. FEBS Lett.
2012;586:3271–8.
64. Wang Q, Tang H, Yin S, Dong C. Downregulation of microRNA-138 enhances
the proliferation, migration and invasion of cholangiocarcinoma cells through
the upregulation of RhoC/p-ERK/MMP-2/MMP-9. Oncol Rep. 2013;29:2046–52.
65. Braconi C, Huang N, Patel T. MicroRNA-dependent regulation of DNA
methyltransferase-1 and tumor suppressor gene expression by interleukin-6
in human malignant cholangiocytes. Hepatology. 2010;51:881–90.
66. Peng F, Jiang J, Yu Y, Tian R, Guo X, Li X, et al. Direct targeting of SUZ12/
ROCK2 by miR-200b/c inhibits cholangiocarcinoma tumourigenesis and
metastasis. Br J Cancer. 2013;109:3092–104.
67. Qiu YH, Wei YP, Shen NJ, Wang ZC, Kan T, Yu WL, et al. miR-204 inhibits
epithelial to mesenchymal transition by targeting slug in intrahepatic
cholangiocarcinoma cells. Cell Physiol Biochem. 2013;32:1331–41.
68. Chen L, Yan HX, Yang W, Hu L, Yu LX, Liu Q, et al. The role of microRNA
expression pattern in human intrahepatic cholangiocarcinoma.
J Hepatol. 2009;50:358–69.
69. Li B, Han Q, Zhu Y, Yu Y, Wang J, Jiang X. Down-regulation of miR-214
contributes to intrahepatic cholangiocarcinoma metastasis by targeting
Twist. FEBS J. 2012;279:2393–8.
70. Meng F, Wehbe-Janek H, Henson R, Smith H, Patel T. Epigenetic regulation
of microRNA-370 by interleukin-6 in malignant human cholangiocytes.
Oncogene. 2008;27:378–86.
71. Chen Y, Luo J, Tian R, Sun H, Zou S. miR-373 negatively regulates methyl-CpGbinding domain protein 2 (MBD2) in hilar cholangiocarcinoma. Dig Dis Sci.
2011;56:1693–701.
72. Iwaki J, Kikuchi K, Mizuguchi Y, Kawahigashi Y, Yoshida H, Uchida E, et al.
MiR-376c down-regulation accelerates EGF-dependent migration by targeting
GRB2 in the HuCCT1 human intrahepatic cholangiocarcinoma cell line.
PLoS ONE. 2013;8, e69496.
73. Olaru AV, Ghiaur G, Yamanaka S, Luvsanjav D, An F, Popescu I, et al.
MicroRNA down-regulated in human cholangiocarcinoma control cell cycle
through multiple targets involved in the G1/S checkpoint. Hepatology.
2011;54:2089–98.
Page 15 of 15
Submit your next manuscript to BioMed Central
and take full advantage of:
• Convenient online submission
• Thorough peer review
• No space constraints or color figure charges
• Immediate publication on acceptance
• Inclusion in PubMed, CAS, Scopus and Google Scholar
• Research which is freely available for redistribution
Submit your manuscript at
www.biomedcentral.com/submit