EIF6 over-expression increases the motility and invasiveness of cancer cells by modulating the expression of a critical subset of membrane-bound proteins
Bạn đang xem bản rút gọn của tài liệu. Xem và tải ngay bản đầy đủ của tài liệu tại đây (2.53 MB, 15 trang )
Pinzaglia et al. BMC Cancer (2015) 15:131
DOI 10.1186/s12885-015-1106-3
RESEARCH ARTICLE
Open Access
eIF6 over-expression increases the motility and
invasiveness of cancer cells by modulating the
expression of a critical subset of membrane-bound
proteins
Michela Pinzaglia1†, Claudia Montaldo2†, Dorina Polinari1†, Mattei Simone3, Anna La Teana4, Marco Tripodi1,2,
Carmine Mancone1,2*, Paola Londei1 and Dario Benelli1
Abstract
Background: Eukaryotic Initiation factor 6 (eIF6) is a peculiar translation initiation factor that binds to the large
60S ribosomal subunits, controlling translation initiation and participating in ribosome biogenesis. In the past,
knowledge about the mechanisms adopted by the cells for controlling protein synthesis by extracellular stimuli has
focused on two translation initiation factors (eIF4E and eIF2), however, recent data suggest eIF6 as a newcomer in
the control of downstream of signal transduction pathways. eIF6 is over-expressed in tumors and its decreased
expression renders cells less prone to tumor growth. A previous work from our laboratory has disclosed that
over-expression of eIF6 in transformed cell lines markedly increased cell migration and invasion.
Methods: Here, we performed a quantitative proteomic analysis of membrane-associated proteins in A2780
ovarian cancer cells over-expressing eIF6. Differentially expressed proteins upon eIF6 overproduction were further
investigated in silico by Ingenuity Pathway Analysis (IPA). RT-qPCR and Western blot were performed in order to
validate the proteomic data. Furthermore, the effects of a potent and selective inhibitor ML-141 in A2780 cells were
evaluated using transwell migration assay. Finally, we explored the effects of eIF6 over-expression on WM793
primary melanoma cell lines.
Results: We demonstrated that: (i) the genes up-regulated upon eIF6 overproduction mapped to a functional
network corresponding to cellular movements in a highly significant way; (ii) cdc42 plays a pivotal role as an
effector of enhanced migratory phenotype induced upon eIF6 over-expression; (iii) the variations in abundance
observed for cdc42 protein occur at a post-transcriptional level; (iv) the increased cell migration/invasion upon eIF6
over-expression was generalizable to other cell line models.
Conclusions: Collectively, our data confirm and further extend the role of eIF6 in enhancing cell migration/
invasion. We show that a number of membrane-associated proteins indeed vary in abundance upon eIF6
over-expression, and that the up-regulated proteins can be located within a functional network controlling cell
motility and tumor metastasis. Full understanding of the role eIF6 plays in the metastatic process is important, also
in view of the fact that this factor is a potentially druggable target to be exploited for new anti-cancer therapies.
Keywords: Protein synthesis, Ribosome biogenesis, eIF6, cdc42, Cell migration
* Correspondence:
†
Equal contributors
1
Istituto Pasteur-Fondazione Cenci Bolognetti and Department of Cellular
Biotechnologies and Haematology, Sapienza University of Rome, Via Regina
Elena 324, 00161 Rome, Italy
2
L. Spallanzani National Institute for Infectious Diseases, IRCCS, Via Portuense
292, 00149 Rome, Italy
Full list of author information is available at the end of the article
© 2015 Pinzaglia et al.; licensee BioMed Central. This is an Open Access article distributed under the terms of the Creative
Commons Attribution License ( which permits unrestricted use, distribution, and
reproduction in any medium, provided the original work is properly credited. The Creative Commons Public Domain
Dedication waiver ( applies to the data made available in this article,
unless otherwise stated.
Pinzaglia et al. BMC Cancer (2015) 15:131
Background
Protein synthesis and ribosome biogenesis are the most
expensive processes for the cell in terms of energy and
biosynthetic precursors. Cells are able to respond rapidly
to the changes of the surrounding environment, modifying
the expression profile of existing mRNAs and controlling
the rate of ribosome biogenesis at any given time through
multiple regulatory mechanisms.
Favorable stimuli (growth factors or nutrients) upregulate ribosome, and consequently protein synthesis,
to ensure enhanced growth and proliferation [1,2]. In
contrast, stress circumstances down-regulate ribosome
biogenesis reducing protein synthesis and cell proliferation [3]. Taken together, ribosome biogenesis and
translational control are critical processes that are inextricably linked to cell growth and proliferation, permitting
the cells to respond quickly to altered environmental
conditions.
Increased cell proliferation, which is also a common
characteristic of a perturbed cell cycle in cancerous cells,
requires a general increase in protein synthesis that is, in
many cases, sustained also by up-regulation of the ribosome biogenesis rate. Extensive studies focused on signal
transduction pathways, such as PI3K-AKT-mTOR and
RAS-MAPK, showed that their deregulation affects the
function and expression of various components of the
translational machinery, thus modifying the expression
of specific mRNAs at the level of protein synthesis [4,5].
Hence, translation factors and ribosomal proteins impaired in their expression were recognized as a consequence of cancer progression and interpreted as a result
of the higher biosynthetic demand of cycling cells [6].
However, during the last two decades, increasing data
suggest an active role of ribosome biogenesis and
translation factors in tumorigenesis. For example, the
mere over-expression of the translation initiation factor eIF4E has been widely recognized to be sufficient
to transform cells, regulating the preferential expression of specific proteins or the general translation
rate [7,8]. Similarly, numerous genetic diseases harbouring mutations in distinct components involved in ribosome
biogenesis, collectively referred as “ribosomopathies”, are
prone to developing cancer [9]. In this perspective, the
molecular mechanisms involved in protein synthesis
represent a cause of cancer progression instead of a
consequence.
One of the translation factors recently demonstrated
to have a role in the control of protein synthesis and
aberrantly expressed during cancer is the eukaryotic
initiation factor 6 (eIF6) [10,11]. This is an essential
protein that is expressed differently in various tissues
and at different developmental stages. Although the
mechanism whereby eIF6 acts in tumorigenesis is still
not understood, it has been established to be rate-limiting
Page 2 of 15
for cell growth and transformation both in in vitro
and in vivo. Indeed, eIF6 haploinsufficient mice are
less susceptible to Myc and growth factor-induced tumors [12].
eIF6 is a conserved 25 kDa protein present in eukaryotes and archaea with a high grade of similarity [13]. It
was initially identified as an anti-association factor in
wheat germ [14] for its ability to bind the 60S ribosomal
subunits and thus prevent their association with the 40S
ribosomal subunits to form the 80S initiation complex.
Differently, by the other translation initiation factors
involved in the regulation of the first step of protein synthesis, eIF6 also exerts a role at the level of ribosome
biogenesis. Indeed, genetic and biochemical experiments
performed in yeast reclassified Tif6 (eIF6 homologue) as
a ribosome biogenesis factor since it localizes in the
nucleolus associated with pre-60S subunits and its loss
produces a decrease of 60S particles [15].
A previous work from our laboratory [16] has disclosed
that eIF6 transcription is under the control of the transmembrane receptor Notch-1, a protein involved in a wide
variety of human neoplasms [17]. Inhibition of Notch-1
signaling in ovarian cancer cells by γ-secretase inhibitors
slowed down cell-cycle progression and decreased the
level of eIF6 protein. Remarkably, over-expression of eIF6,
both in stably and transiently transfected cell lines, had
little or no effect on cell proliferation but markedly increased cell migration and invasion, suggesting that eIF6
could be an important downstream effector whereby
Notch-1 modulates cell motility in physiological or pathological conditions. Indeed, it has been known for some
time that certain translational factors, notably eIF4E, are
downstream targets of various signaling pathways that
control cell migration, and its over-expression is causative
of cancer progression [18].
The aim of the present study was to analyze the
variations of protein abundance and composition
caused by up-regulated eIF6 levels that could justify
increased cell migration. By combining a stable-isotope
labeling with amino acids in cell culture (SILAC), quantitative proteomic approach of cells over-expressing
eIF6, computational analysis of proteomic data sets and
molecular analysis we demonstrated that: (i) cells overexpressing eIF6 show a changed expression of a number
of proteins; (ii) the proteins which appear to be upregulated upon eIF6 overproduction mapped to a functional network corresponding to cellular movements in
a highly significant way; (iii) cdc42, one of these proteins,
plays a pivotal role as an effector of enhanced migratory
phenotype induced upon eIF6 over-expression; (iv) the
variations in abundance observed for cdc42 protein occur
at a post-transcriptional level; (v) the increased cell migration/invasion upon eIF6 over-expression was generalizable
to other cell line models.
Pinzaglia et al. BMC Cancer (2015) 15:131
Methods
Ethics statement
The use of the human derived cell cultures has been approved by the ethics committee of the Sapienza University
of Rome, Italy, according to the ethical guidelines of the
1975 Declaration of Helsinki.
Cell culture and treatments
The human ovarian cancer cells A2780 and human melanoma cell lines WM793 were cultured in RPMI 1640
medium (Gibco) supplemented with 10% FBS (Gibco),
1 mmol/L L-glutamine, 100 u/mL penicillin, and 100
ug/mL streptomycin in 5% CO2 incubator at 37°C. All
cells were tested to ensure that there was no mycoplasma contamination. For the SILAC experiments,
A2780 cells were cultured in “light” (12C6 14 N4-arginine
and 12C6-lysine, SILANTES) and “heavy” (13C6 15 N4arginine and 13C6-lysine, SILANTES) conditions for eleven
passages before the next experiments. This period lasted
about 4 weeks, where the SILAC “heavy” cells’ labeling
was complete. SILAC labeling and proteomic analysis were
performed twice.
For protein stability analysis, A2780 cells transfected
with pcDNA3.1 and pcDNA3.1/eIF6 were treated 24 h
after transfection with CHX (Sigma-Aldrich) at 40 μM
for the indicated hours.
Transfection assays
A2780 cells seeded in 60 mm or 100 mm dishes were
transiently transfected at 80% confluence with 10 μg and
20 μg of the appropriate amount of plasmid, respectively.
Lipofectamine 2000 reagent (Invitrogen) was employed
according to the manufacturer’s instructions. Whenever
required, ten times less of the pEGFP plasmid was used as
reporter in order to detect the transfection efficiency.
After 48 h of growth cells were lysed and subjected to the
subsequent required analysis. The transfection of WM793
cell lines was performed in similar conditions.
For SILAC experiments, labeled A2780 cells were
seeded in 100mm dishes and, once reached 80% confluence, the light labeled cells were transiently transfected
with 10 μg/dish of human full-length eIF6 expression
vector while the heavy labeled cells were transfected
with the same amount of the control plasmid. pEGFP
plasmid was also transfected at 1 μg/dish in both differentially labeled cell populations as control of transfection. Each transfection was performed in triplicate.
After 7 hours from transfection, cells were splitted and
left to grow overnight in the respective light and high
fresh medium. The next day GFP expression was analyzed by fluorescence microscopy and the transfections
with efficiency higher than 60% were taken in account
for next analysis.
Page 3 of 15
Membrane protein digestion, peptide purification and
nanoLC analysis
For SILAC samples preparation, all cells were lysed
and membrane proteins were isolated following the
Membrane Protein Extraction Kit (M-PEK) protocol
(CALBIOCHEM). Samples were analyzed by Bradford
assay to determine the protein concentration. Equal
amounts (200 μg) of membrane proteins from A2780/
CTR and A2780/eIF6 cell lines were mixed and subsequently separated on 4 − 12% gradient gels (Invitrogen),
stained by Simply Blue Safe Stain staining and visualized.
Sixteen sections of the gel lane were cut. Proteincontaining gel pieces were washed with 100 μL of 0.1 M
ammonium bicarbonate (5 min at RT). Then, 100 μL of
100% acetonitrile (ACN) was added to each tube and incubated for 5 min at RT. The liquid was discarded, the
washing step repeated once more, and the gel plugs were
shrunk by adding ACN. The dried gel pieces were reconstituted with 100 μL of 10 mM DTT/0.1 M ammonium
bicarbonate and incubated for 40 min at 56°C for cysteine
reduction. The excess liquid was then discarded and cysteines were alkylated with 100 μL of 55 mM IAA/0.1 M
ammonium bicarbonate (20 min at RT, in the dark). The
liquid was discarded, the washing step was repeated once
more, and the gel plugs were shrunk by adding ACN. The
dried gel pieces were reconstituted with 12.5 ng/μL trypsin in 50 mM ammonium bicarbonate and digested overnight at 37°C. The supernatant from the digestion was
saved in a fresh tube and 100 μL of 1% TFA/30% ACN
were added on the gel pieces for an additional extraction
of peptides. The extracted solution and digested mixture
were then combined and vacuum centrifuged for organic component evaporation. Peptides were resuspended
with 40 μL of 2.5% ACN/0.1% TFA, desalted and filtered
through a C18 microcolumn ZipTip, and eluted from the
C18 bed using 10 μL of 80% ACN/0.1% TFA. The organic
component was once again removed by evaporation in a
vacuum centrifuge and peptides were resuspended in a
suitable nanoLC injection volume (typically 3–10 μL) of
2.5% ACN/0.1% TFA. An UltiMate 3000 nano-LC system
(Dionex, Sunnyvale, CA) equipped with an integrated
nanoflow manager and microvacuum degasser was used
for peptide separation. The peptides were loaded onto a
75 μm I.D. NanoSeries C18 column (Dionex, P/N 160321)
for multistep gradient elution (eluent A 0.05% TFA; eluent
B 0.04% TFA in 80% ACN) from 5 to 20% eluent B within
10 min, from 20 to 50% eluent B within 45 min and for
further 5 min from 50 to 90% eluent B with a constant
flow of 0.3 μL/min. After 5 min, the eluted sample fractions were continuously diluted with 0.5 μL/min a-cyano4-hydroxycinnamic acid (CHCA) and spotted onto a
MALDI target using a Probot (LC-Packings/Dionex) with
an interval of 20 s resulting in 144 fractions for each
gel slice.
Pinzaglia et al. BMC Cancer (2015) 15:131
Protein identification and quantification
MALDI-TOF-MS spectra were acquired using a 4800
Plus MALDI TOF/TOF Analyzer (AB Sciex, Foster City,
CA). The spectra were acquired in the positive reflector
mode by 20 subspectral accumulations (each consisting
of 50 laser shots) in an 800 − 4000 mass range, focus
mass 2100 Da, using a 355 nm Nb:YAG laser with a
20 kV acceleration voltage. Peak labeling was automatically done by 4000 Series Explorer software Version 3.0
(AB Sciex) without any kind of smoothing of peaks or
baseline, considering only peaks that exceeded a signalto noise ratio of 10 (local noise window 200 m/z) and a
half maximal width of 2.9 bins. Calibration was performed using default calibration originated by five standard
spots (ABI4700 Calibration Mixture). Only MS/MS spectra of preselected peaks (out of peak pairs with a mass
difference of 6.02, 10.01, 12.04, 16.03, and 20.02 Da) were
integrated over 1000 laser shots in the 1 kV positive ion
mode with the metastable suppressor turned on. Air at
the medium gas pressure setting (1.25 × 10 − 6 Torr) was
used as the collision gas in the CID off mode. After
smoothing and baseline subtractions, spectra were generated automatically by 4000 Series Explorer software. MS
and MS/MS spectra were processed by ProteinPilot
Software 2.0.1 (AB SCIEX) which acts as an interface
between the Oracle database containing raw spectra and
a local copy of the MASCOT search engine (Version
2.1, Matrix Science, Ltd.). The Paragon algorithm was
used with SILAC (Lys + 6, Arg + 10) selected as the
Sample Type, iodacetamide as cysteine alkylation, with the
search option “biological modifications” checked, and
trypsin as the selected enzyme. MS/MS protein identification was performed against the Swiss-Prot database (number of protein sequences: 254757; released on 20070123)
without taxon restriction using a confidence threshold of
95% (Proteinpilot Unused score ≥1.31). The monoisotopic
precursor ion tolerance was set to 0.12 Da and the MS/
MS ion tolerance to 0.3 Da. The minimum required peptide length was set to 6 amino acids; two peptides were
required for protein identification.
For quantitation, the Heavy/Light average ratio for a
protein was calculated by ProteinPilot Software with
automatic bias correction. Quantitation was based on a
two-dimensional centroid of the isotope clusters within
each SILAC pair. Ratios of the corresponding isotope
forms in the SILAC pair were calculated, and lines fitting these intensity ratios gave the slope as the desired
peptide ratio. To represent the ratio of a peptide being
quantified several times, the median value was chosen.
To minimize the effect of outliers, protein ratios were
calculated as the median of all SILAC pair ratios that
belonged to peptides contained in this protein. The percentage of quantitation variability was defined as the
standard deviation of the natural logarithm of all ratios
Page 4 of 15
used for obtaining the protein ratio multiplied by a constant factor of 100. Only relative Heavy/Light (or Light/
Heavy) ratios exceeding factor 1.5 were considered.
Data analysis
Differentially expressed proteins were analyzed using
Ingenuity Pathway Analysis (IPA, Ingenuity Systems;
see www.ingenuity.com). The over-represented biological
processes, molecular functions, and canonical pathways
were generated based on information contained in the
Ingenuity Pathways Knowledge Base. Right-tailed Fisher’s
exact test was used to calculate a p-value determining the
probability that each biological function and/or disease involved in that proteome profile alteration is due to chance
alone.
Western blot analysis
Total protein extract was obtained by lysing the cells
with extraction buffer (20 mM Tris-HCl pH7.5, 150 mM
NaCl, 1 mM EDTA pH 8.0, 1% Triton-X) and protease
inhibitor cocktail (Roche). The protein concentration of
A2780/eIF6 and control cell lysates was measured.
Equivalent amounts of proteins from whole cell extracts
or membranous fractions were denatured in a 5X sample
loading buffer by heating at 95°C for 5 min and resolved
by 15% SDS-PAGE. Proteins were electrotransferred to
0,45 μm nitrocellulose membrane (Amersham Biosciences)
using a transfer apparatus according to the manufacturer’s
protocols (Bio-Rad). After incubation with 5% nonfat milk
in TBST (10 mM Tris, pH 8.0, 150 mM NaCl, 0,1% Tween
20) or with 3% BSA in TBST for 60 min, the membranes
were washed once with TBST and incubated with antibodies against eIF6 (1:3000, BD Biosciences), cdc42
(1:1000, Cell Signaling), GAPDH (1:5000, Calbiochem
Merck), Calnexin (1:200, Santa Cruz) or tubulin (1:20000,
Sigma-Aldrich) at 4°C for 16 h. Membranes were washed
once for 10 min and incubated with a 1:15000 dilution
of horseradish peroxidase-conjugated anti-mouse or antirabbit antibodies for 1 h. Membranes were washed with
TBST three times for 10 min each and developed with
the ECL system (Amersham Biosciences) according to
the manufacturer’s protocols. The intensity of the signals
was quantified by densitometry analysis using ImageJ
software.
RNA extraction, reverse transcription and quantitative
real-time PCR
Total RNA was extracted from ovarian or melanoma cancer cells using Trizol reagent (Invitrogen, Carlsbad, CA)
following the manufacture’s protocol. cDNA was synthesized from 2 μg of total RNA using enhanced avian reverse transcriptase (Sigma-Aldrich). Quantitative real time
PCR was performed with iCycler (Bio-Rad, Hercules, CA)
on 2 μl of 1: 4 cDNA using 10 μl of SensiMix SYBR &
Pinzaglia et al. BMC Cancer (2015) 15:131
Page 5 of 15
Fluorescein Kit 2000 (Bioline). Cycling parameters were:
95°C for 10 min, followed by 40 cycles of 95°C for 15 s,
60°C for 1 min, 72°C for 10s. The relative amount of each
mRNA was obtained by 2-ΔΔCt method and normalized
to human housekeeping gene glyceraldehyde phosphate
dehydrogenase (GAPDH) mRNA expression. The quantification of cdc42 mRNA in heavy fractions collected by
sucrose gradients was performed by the coapplicationreverse transcription protocol adapted to that described
elsewhere [19]. Specifically, cDNA was synthesized from 1
μg of total RNA using enhanced avian reverse transcriptase (Sigma-Aldrich) in presence of 0,8 μM oligo-(dT)
primers and 2,5 μM of 18S-RNA-specific primer (5′GAGCTGGAATTACCGCGGCT-3′). Quantitative real
time PCR was performed with iCycler (Bio-Rad, Hercules,
CA) on 1 μl of 1: 10 cDNA according to the abovedescribed method.
Primer sequences used for cdc42 detection were as
follows, sense: 5′-CCCGGTGGAGAAGCTGAG-3; and
antisense: 5′-CGCCCACAACAACACACTTA-3′. For
Hax1 detection, sense: 5′- GACCTCGGAGCCACAGAG
AT-3′, and antisense: 5′-GGTGCTGAGGACTATGGAA
C-3′. For HGF detection, sense: 5′- CAATAGCATGTCA
AGTGGAG-3′; and antisense: 5′-CTGTGTTCGTGTGG
TATCAT3′. For SDC1 detection, sense: 5′- AGGACGAA
GGCAGCTACTCCT-3′, and antisense: 5′- TTTGGTG
GGCTTCTGGTAGG-3′. For GAPDH detection, sense:
5′-AGCCACATCGCTGAGACA-3′, and antisense: 5′GCCCAATACGACCAAATCC-3′. For rRNA detection,
sense: 5′-TACCACATCCAAGGAAGGCAGCA-3′, and
antisense: 5′- TGGAATTACCGCGGCTGCTGGCA-3′.
of starting, or DMSO 0,1%. After 48 hours, cells migrated
in the lower chamber were stained with crystal violet dye.
In the lower chamber, medium supplemented with 10%
FBS was used as chemoattractant and also in this chamber
the molecular probe was added at the concentration used
in the upper chamber. Experiments were carried out in
triplicate and repeated three times. Membrane filters were
imaged with ImageJ software.
For the experiments designed to evaluate the activity
of ML 141 on eIF6-induced cell migration A2780 cells
were transfected with the plasmid pcDNA3.1/eIF6 and
the corresponding control according to that described
above. After 24 hours pcDNA3.1/eIF6 and pcDNA3.1
A2780 cells were pretreated in complete medium containing the molecular probe ML 141 for 24 h before
plating (2.5 × 10⁵ per well) in the BD Falcon™ Cell Culture Inserts (BD Biosciences) for the next 24 hours. Successively, the chambers with the cells were placed on 24
well plates containing medium without serum plus the
molecular probe at the same concentration of starting.
After 48 hours, cells migrated in the lower chamber
were stained with crystal violet dye. In the lower chamber, medium supplemented with 10% FBS was used as
chemoattractant and also in this chamber the molecular
probe was added at the concentration used in the upper
chamber. Experiments were carried out in triplicate and
repeated three times. Membrane filters were imaged
with ImageJ software.
To test the results of eIF6 over-expression on the migratory activity of the WM793 cells we adopted the same
protocol described above in absence of ML 141 inhibitor.
Rac1/Cdc42 activity assays
Invasion in matrigel-coated chambers
Cdc42 activity was assessed using GST-tagged p21 binding
domain of PAK1 (GST-PBD) according to the manufacturer’s instructions (Cell Signaling). Briefly, cells grown
to ~70-80% confluence in regular growth medium following 24 h from transfection with pcDNA3.1 and pcDNA3.1/
eIF6 constructs were collected in lysis buffer plus 1 mM
PMSF. 500 μg of cleared extracts were incubated overnight at 4°C with glutathione beads coupled with GSTPBD to pull down GTP-bound cdc42. The amount of total
and activated cdc42 was determined by Western blotting
according to the above-described method.
WM793 cells were transfected with the plasmid
pcDNA3.1/eIF6 and the corresponding control according to as described above. After 24 hours, 2.5 × 10⁵ cells
were seeded in the BD Matrigel invasion chambers (BD
Biosciences). Cells were seeded in the upper chamber in
medium without serum. After 24 hours, cells migrated
in the lower chamber were stained with crystal violet
dye. In the lower chamber, medium supplemented with
10% FBS was used as chemoattractant. Experiments
were carried out in triplicate and repeated three times.
Cell viability
Migration assay
A2780 cells were pretreated in complete medium containing the molecular probe ML 141 for 24 h before
plating (2.5 × 10⁵ per well) in the BD Falcon™ Cell Culture Inserts (BD Biosciences). Mock treatments were
carried out pretreating the cells in the same medium
with DMSO 0,1%. The chambers with the cells were
placed on 24 well plates containing medium without
serum plus the molecular probe at the same concentration
A2780 cells were seeded into 35 mm plates at a density
of 2 × 10⁵ per well and treated with the following:
vehicle control (DMSO 0,1%), and 10 μM ML 141. The
cells were treated for 24 h or 48 h. Cell viability was
determined by trypan blue dye exclusion assay. Cells and
growth medium were separately collected and Trypan
Blue stained the dead cells in each fraction. The viable
and unstained cells were counted. Triplicate wells of
viable cells for each concentration were counted on a
Pinzaglia et al. BMC Cancer (2015) 15:131
hemacytometer after trypsinization. Each well had three
repeats of counting. The experiment was repeated three
times.
Immunoflurescence analysis
After 7 hours from transfections, cells in 60 mm or 100
mm dishes were spit and an adequate amount of
resuspended cells were transferred in 35 mm dishes. The
next day, when confluence was about 50%, cells in
35 mm dishes were washed 3 times with phosphatebuffered saline 1X (PBS) and fixed by adding 250 μL 4%
paraformaldehyde (in PBS) for 15 min at RT. Then paraformaldehyde was removed, cells were washed 3 times
with PBS and microscope slides were gently placed on
cells for microscope examination. Transfection efficiency
was calculated as the ratio of GFP-expressing cells over
the total.
Polysomal profiles
A2780 cells transfected with pcDNA3.1 and pcDNA3.1/
eIF6 were treated 24 h after transfection with CHX
(Sigma-Aldrich) to a final concentration of 100 μg/ml
and then incubated at 37°C for 15 min. After washing
the monolayer once with ice-cold PBS 1X + CHX (50
μg/ml), the cells were scraped in 500 μl of ice-cold lysis
buffer (10 mM Tris-HCl pH 7.4, 10 mM KCl, 15 mM
MgCl2, 1 mM DTT, 1% Triton-X 100, 1% deoxycholate,
0.5 units μl-1 rRNasin, 100 μg/ml CHX ) on ice. Cell
debrises were removed by a 8 min centrifugation at
10,000 g at 4°C. 6 A260 units of supernatants were layered on top of a linear 15-50% (w/v) sucrose gradient
containing 20 mM Tris-HCl pH 7.4, 5 mM MgCl2, 140
mM KCl, 0.5 mM DTT and 0.1 mg/ml CHX. The gradients were centrifuged at 4°C in a SW41 Beckman rotor
for 3 h at 39,000 rpm and unloaded while monitoring
absorbance at 254 nm with the EM-1 Econo UV absorbance instrument. Fractions (0.5 ml) were collected in 18
tubes and precipitated with an equal volume of isopropanol and 2 μl of GlycoBlue™ Coprecipitantat 15 mg/ml
(Invitrogen) at -20°C over night. Successively, the samples were centrifuged at 13000 rpm for 30 min at 4°C.
The resulting pellets were resuspended in 40 μl of
DEPC-treated dH2O. The presence of the ribosomes in
each fraction was checked analyzing 10 μl of each fraction onto 0,8% agarose gel. The fractions ribosome-free
were pooled together and renamed “light fractions”
whereas the fractions containing the ribosomes were
pooled together and renamed “heavy fractions”. The
total RNA of the last two fractions resulting from each
cell sample was purified from the proteins with the Total
RNA Purification Kit (Norgen Biotech Corp.) and quantified. The amount of cdc42 mRNA in each fraction was
analyzed on equal amounts of RNA by qRT-PCR according to the above-described method.
Page 6 of 15
Results
eIF6 over-expression perturbs the membrane proteome
profiles of cultured ovarian cancer cells
As mentioned above, in a previous publication we observed that the principal effect of eIF6 over-expression
in A2780 ovarian cell lines consisted in their increased
motility/invasiveness. Independent of cell type and mode
of migration, cell motility and invasiveness occur mainly
through cytoskeletal remodeling and active participation
of different protein complexes present on the cytoplasmic membrane at the front of the cells. Therefore, to
identify the protein effectors of cell membranes through
which eIF6 induces increased migration, we performed a
membrane proteomic analysis of A2780 cells overexpressing eIF6 with respect to the control cells transfected with the empty vector. In particular, we applied
the SILAC strategy that allows for quantitative comparisons among different samples by means of metabolic
labelling in cell culture (Figure 1A). Specifically, we
metabolically labeled A2780 ovarian cancer cells with
13
C6 15 N4-arginine and 13C6-lysine (heavy) for SILAC
standard production. Non-labeled cell populations were
instead grown in light medium (12C6 14 N4-arginine and
12
C6-lysine). After the complete incorporation of the
“heavy” amino acids into the cells, A2780 “light” and
“heavy” cells were transfected with a plasmid expressing
eIF6 under the control of a strong promoter (hereafter
termed as A2780/eIF6) and with the empty plasmid used
as the standard (hereafter termed as “control”), respectively. Moreover, pEGFP plasmid was transfected in equal
amounts in both of the previous transfections in order
to detect the efficiency of DNA intake (Additional file 1:
Figure S1). Following 48 h of growth, the transfected
cells were analyzed by immunofluorescence. Those
transfection assays showing a DNA intake higher than
60% were lysed and the effectiveness of eIF6 overexpression was verified by Western blotting (Figure 1B).
The results of immunoblot and immunofluorescence experiments confirmed that A2780 cells received similar
amounts of plasmid constructs in each transfection and
that A2780/eIF6 cells displayed an increased expression
of the ectopic protein, approximately two-fold with respect to the control.
For proteomics analysis, whole cell extracts isolated
separately from “light” (empty vector) and “heavy” (eIF6
over-expression) cell lines were mixed in equal amounts.
Then, the pooled sample was separated in membrane
fraction enriched with integral and peripheral membraneassociated proteins (M fraction) with respect to the remaining “non-membranous” proteins defined as soluble
cell fraction (S fraction). Next, both fractions were analyzed by Western blotting, investigating the presence of
distinct markers characterizing the selective enrichment
for the membrane proteins from A2780 cells (Figure 1C).
Pinzaglia et al. BMC Cancer (2015) 15:131
A
Page 7 of 15
B
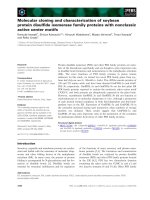
Figure 1 SILAC-based proteomic analysis of membrane protein changes induced by eIF6 overexpression. A) Schematic representation of
SILAC-based proteomic workflow. B) 10 micrograms of protein whole cell extracts isolated from A2780 transfected either with pcDNA3.1 and
pcDNA3.1-eIF6 were separated by SDS-PAGE and transferred to a PVDF membrane. Bands relative to eIF6 and tubulin (loading control) were
detected with respective antibodies and analyzed by densitometry using Quality-One software (Bio-Rad laboratories, Richmond, CA). The X-axis
shows the relative intensity of eIF6/tubulin; one representative experiment out of three is shown. C) Equal amounts of protein whole cell extracts
isolated from control (pcDNA3.1) and eIF6-overexpressing (pcDNA3.1-eIF6) cells were mixed and subjected to native membrane purification. 10
micrograms of whole cell extract (WCE), soluble (S) and membrane (M) fractions were analyzed by western blotting. Antibodies against calnexin
and GAPDH were used as markers of membrane and soluble fractions, respectively. One representative experiment out of three is shown.
The results of immune blots confirmed the accuracy of
the cell fractioning procedure and permitted us to proceed
to the proteomic analysis of the membrane fractionassociated proteins.
By means of nanoLC-MALDI-TOF/TOF analysis of
two independent biological replicates we identified and
quantified 576 proteins. Among them, we considered those
proteins showing a SILAC ratio (Heavy/Light or Light/
Heavy) ≥1.5 for subsequent analyses. By these criteria, in
eIF6 over-expressing cells, 22 proteins were found downregulated, while 66 showed an increased abundance
(Additional file 2: Table S1).
Interaction network generated by proteomic data highlights
involvement of proteins entailed in cell migration
To address the biological relevance of the significantly
and differentially regulated proteins following eIF6 overexpression, the proteomic data sets were further investigated in silico by Ingenuity Pathway Analysis (IPA)
(Ingenuity Systems, Mountain View, CA; http://www.
ingenuity.com). In particular, the web-based pathways
analysis tool IPA allowed us to determine if proteins
that changed in abundance could be mapped to specific functional networks that may be common to cell
migration.
Table 1 shows that the enrichment results from the
protein data set descends from an over-representation of
genes related to high-level ontology database annotations of cell movement and migration of tumor cell lines
(p-value of 4.49E-02 and 4.65E-02, respectively). In light
of this, it is conceivable that the up-regulated proteins
(i.e.: AGK, C1QBP, CDC42, HAX1, HGF, SDC1 and
YBX1), involved in these biological functions, may be
candidates as effectors of the eIF6-induced increased
migration.
Validation of changed cdc42 protein levels by western
blotting
Successively, in order to uncover the actual participation
of one of the above-predicted effectors on the increased
cell migration we focused our attention on cdc42. Indeed,
there is widely proven evidence in literature indicating
Pinzaglia et al. BMC Cancer (2015) 15:131
Page 8 of 15
Table 1 Biofunctional analysis by ingenuity pathway analysis
Functions annotation
p-value
Predicted activation state
Activation z-score
Molecules
cell movement of
tumor cell lines
4.49E-02
Increased
2.305
AGK,C1QBP,CDC42,HAX1,HGF,SDC1,YBX1
migration of tumor
cell lines
4.65E-02
Increased
2.117
AGK,C1QBP,CDC42,HAX1,HGF,SDC1
cell death
4.85E-02
Decreased
-1.770
C1QBP,CD59,CDC42,COX5A,FDFT1,GAPDH,HAX1,HGF,HNRNPC,
PGRMC1,RPS19,RTN4,SDC1,SLC25A4,TIMM50,YBX1
The genes up-regulated upon eIF6 overproduction mapped in a highly significant way to a functional network corresponding to cellular movement. Only data
with significant Activation z-scores ≥ 1.5 or ≤ -1.5 were shown.
that its enhanced activity is correlated to the augment of
cell migration [20,21].
Preliminarily, we confirmed the proteomic results on
the cdc42 differential expression by Western blotting.
The analysis was performed on the whole cell extracts
derived from other transfections replicating the experimental conditions adopted in the SILAC analysis
(Figure 2). The results showed that the cdc42 upregulation was in agreement with the data obtained
by proteomic analysis. Moreover, the experiments performed on whole cell extracts highlighted genuine differential expression of the gene products instead of mere
relocalization. Indeed, in the latter case the protein levels
had to be unchanged.
Increased amount of eIF6 perturbs cdc42 expression at
the post-transcriptional level
Since eIF6 is characterized as a translation initiation
factor, the most likely hypothesis is that it somehow differentially modulates the translation of the proteins
involved in cell motility/invasiveness. However, we might
speculate that the variation in abundance previously
observed for some proteins is not directly controlled by
eIF6 but rather by transcription factors or other transcriptional regulators which are under the direct control
of eIF6 suggesting, as a consequence, an indirect effect
of eIF6 on gene transcription of the differentially expressed
target which was previously analyzed.
For this reason, we evaluated the transcriptional expression levels of cdc42 mRNA levels, using GADPH as
an internal control. The quantitative RT-PCR did not
show any difference of the cdc42 mRNA levels following
eIF6 over-expression (Figure 3A). Noteworthy is the fact
that the analysis of mRNAs expression levels for some of
the other up-regulated proteins identified by IPA analysis
upon eIF6 over-expression showed a real variation, suggesting, in this case, an indirect control of their expression
by eIF6 (Figure 3B).
Moreover, in order to demonstrate that the changed
levels of cdc42 protein did not arise from a differential
control of its stability, we treated A2780 cells with cycloheximide (CHX). To this regard, A2780 cells were transfected with pcDNA3.1/eIF6 and de novo protein synthesis
was blocked 24 h later with the translation inhibitor.
Previous studies showed that the half-life of cdc42 was
approximately 15 h [22]. For this reason, we extended the
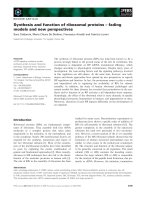
Figure 2 eIF6 over-expression induces increased cdc42 protein levels in transiently transfected ovarian cancer cells. cdc42 and eIF6
expression was analyzed by western blotting on the whole cell extracts of A2780 ovarian cancer cells. The bands were quantified by
densitometry using the ImageJ software and the intensity of the protein bands was quantified relative to β-tubulin. The results represented in the
histograms are shown as the mean ± S.D. and are the average of three independent experiments.
Pinzaglia et al. BMC Cancer (2015) 15:131
Page 9 of 15
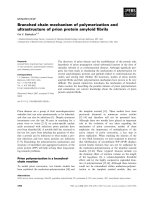
Figure 3 The control of the increased cdc42 protein expression does not occur at the level of transcription or altered protein stability.
Analysis of differentially expressed mRNAs after increased eIF6 expression was performed on different target genes in A2780 ovarian cancer cells.
A) qPCR of cdc42 mRNA was performed analysing 2 μg of total RNA reverse-transcribed into cDNA and comparing its expression between A2780
ovarian cancer cells over-expressing eIF6 with respect the control. The bar graphs represent the relative fold changes of cdc42 mRNA presented
as mean ± S.D. and relative to that of GAPDH. The results are the average of three independent experiments. B) qPCR of synd-1, hax1 and hgf
mRNA was performed analysing 1μg of total RNA reverse-transcribed into cDNA and comparing its expression between A2780 ovarian cancer
cells over-expressing eIF6 with respect the control. The bar graphs represent the relative fold changes of target mRNAs presented as mean ± S.D.
and relative to that of GAPDH. The results are the average of three independent experiments. The statistical analysis was performed with the t-test
and the P-values were < 0.02 (**) and < 0.001 (*), respectively. C-D) To examine the stability of cdc42 protein, A2780 cells over-expressing eIF6
and the corresponding control were treated 24 hours after their transfection with 15 μM of the protein synthesis inhibitor CHX for the next 15
hours. Successively, endogenous cdc42 protein expression was detected by western blot analysis with an anti-cdc42 antibody and the intensity
of the bands was normalized with respect the endogenous levels of β-tubulin. The expression levels of Cdc42 were determined by densitometry
using ImageJ software. Results are shown for two of three independent experiments and are presented as mean ± S.D.
treatment of cells with CHX for the next 24 h after
transfection. The results showed a turnover rate of cdc42
similar to the control (Figure 3C-D), suggesting that the
increased expression of eIF6 does not induce a decreased
protein turnover of cdc42 protein.
Successively, in order to demonstrate that eIF6 overexpression influences translation of cdc42 mRNA, we measured the recruitment of cdc42 mRNA on polysomes by
qRT–PCR. Indeed, as shown in Figure 4 eIF6 overexpression increased polysome loading of cdc42 mRNA
with respect the total amount of rRNA, thereby suggesting that eIF6 impacts primarily on cdc42 translation.
The enhanced levels of eIF6 induce cdc42 activation
which in turn is accountable for increased cell migration
cdc42 is a small GTPase belonging to the Rho family
that play major roles in regulating the actin cytoskeleton
as well as key cellular functions such as differentiation,
cell cycle progression, transformation, apoptosis, motility
and adhesion. The activated form of cdc42 (cdc42-GTP)
transmits signals by recruiting different proteins. Among
these effectors are the p21-activated kinases (Paks) and
serine/threonine kinases that also induce actin organization during cell adhesion and migration [23]. Moreover,
ovarian cancer is characteristically metastatic and cdc42
Pinzaglia et al. BMC Cancer (2015) 15:131
Page 10 of 15
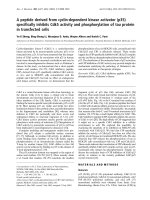
Figure 4 eIF6 over-expression increased polysome loading of cdc42 mRNA. The polysomal profiles of A2780/eIF6 and control cells were
analysed by density gradient centrifugation. The sucrose gradient fractions were pooled together on the basis of the presence/absence of
ribosomes, detected by ethidium bromide staining on agarose gels (upper panel). The total RNA of each polyribosomal fraction was extracted.
Successively, cdc42 mRNA was measured in both fractions by RT-qPCR (bottom panel). The amount of cdc42 mRNA in the polysomal fractions
was normalized using rRNA as the standard, while for ribosome-free fractions we used GAPDH mRNA levels. We also analysed GAPDH mRNA
levels in the polysomal fractions normalizing with respect rRNA levels. The mean value is representative of three independent experiments with a
P-value < 0.05 (**) and < 0.01 (*) respectively, calculated with the t-test.
has been speculated to be accountable for the migratory
phenotype [24].
Thus, we investigated whether eIF6 over-expression
could induce the activation of cdc42-Pak signalling in
A2780 ovarian cancer cells. Particularly, in order to detect the activation of cdc42 we used a recombinant
cdc42-binding domain of PAK (PBD) that specifically
binds and precipitates active GTP-bound cdc42. A2780
cells were lysed 24 h after their transfection with the
appropriate constructs and the activated form of cdc42
was precipitated by GST fusion proteins of PBD,
followed by Western blotting with an anti-cdc42 antibody (Cell Signalling). As shown in lane 3 of Figure 5A
the enhanced expression of eIF6 induces an increased
association and pull-down of active cdc42.
To further examine the role of the activated cdc42
form as an effector of increased cell migration in A2780
cells after eIF6 over-expression, we treated the cells with
the molecular probe ML 141, a potent and selective
inhibitor of cdc42 GTPase. It binds the guanine
nucleotide-associated cdc42 and induces ligand dissociation [25]. Previous studies demonstrated that ML
141 inhibits the migration of human ovarian carcinoma
cell lines OVCA429 and SKOV3 without exhibiting cytotoxicity [26]. However, since similar data for A2780 cells
were not available, we preliminary treated A2780 cells
with ML 141 in a dose-dependent manner. As shown in
Figure 5B, we assayed the chemical compound at 5 and 10
μM, obtaining effective cell migration inhibition, even
when using the smallest amount of the chemical. Moreover, ML 141 did not show cytotoxicity at the assayed
concentration of 10 μM (Figure 5C). Successively, in order
to verify whether the increased cell migration following
eIF6 over-expression was cdc42-dependent, we probed
the inhibitory effect of ML 141 in A2780 cells transfected
with the specific constructs. To this end, transwell
Pinzaglia et al. BMC Cancer (2015) 15:131
Page 11 of 15
A
B
C
D
Figure 5 Biochemical analysis of cdc42 activated form in A2780 ovarian cancer cells over-expressing eIF6. A) Measurement of cdc42
activity analyzed by GST-PAK1 p21-binding domain pull-down. The figure shows one of three independent experiments with similar results. B)
We treated A2780 cells (2.5 × 10⁵ per well) with the molecular probe ML 141 at the indicated concentrations for 72 hours. Mock treatments were
carried out treating the cells in the same medium with DMSO 0,1%. Cells migrated in the lower chamber were stained with crystal violet dye. In
the lower chamber, medium supplemented with 10% FBS was used as chemoattractant and also in this chamber the molecular probe was added
at the concentration used in the upper chamber. The histograms are plotted as mean ± S.D. They represent the averages of three independent
experiments with a P-value < 0.05 (**) calculated with the t-test. C) ML 141 did not show cytotoxicity in A2780 cell lines. The sensitivity was
determined counting the number of cell viability by Trypan Blue exclusion staining. A2780 cells were treated with ML 141 10 μM or DMSO 0,1%.
Cell viability was determined by trypan blue dye exclusion assay at the indicated time after ML 141 addition. The histograms represent the
average of unstained cells and they are presented as mean ± S.D. The results assess three independent experiments. D) Enhanced migration of
A2780 cells induced by eIF6 over-expression with respect the control cells was decreased in presence of cdc42 inhibitor ML 141. In particular,
both control (pcDNA3.1) and eIF6-overexpressing (pcDNA3.1-eIF6) cells were affected in their migratory capacity by ML 141. However, the effect
was more pronounced on A2780 cells over-expressing eIF6 for the synergistic effect of the inhibitor on both the intrinsic migratory capacity of
the cells (as shown by the control) and the eIF6-induced motility.
migration assays were performed with A2780 pCDNA3
control cells and A2780-eIF6 cells, in the presence of ML
141 inhibitor or its vehicle. As shown in Figure 5D, while
the eIF6 over-expressing cells showed an increase in
their capacity to pass through the matrigel layer, according to our previous data [16], the motility of both
the A2780-pcDNA3.1 and the A2780-eIF6 cells was partially inhibited in the presence of cdc42 inhibitor. Notably,
A2780-eIF6 cells showed a significantly more pronounced
decrease in their migratory activity with respect to the
control. Overall, these results suggest that cdc42 is clearly
implicated in the control of cell motility induced by eIF6,
although its inhibition is not sufficient to totally abrogate
the acquired increased motility.
eIF6 over-expression enhances cell migration, invasiveness
and cdc42 protein expression in melanoma cell lines
To test whether the results of eIF6 over-expression on
the migratory activity of the cells were generalizable to
other cell line models, we extended our analysis on
WM793 primary melanoma cell lines. Initially isolated
from a superficial spreading melanoma presenting an
Pinzaglia et al. BMC Cancer (2015) 15:131
Page 12 of 15
early vertical growth phase, WM793 were considered
poorly aggressive with a low metastatic potential with respect to the previously studied cell lines [27,28].
We transiently transformed WM793 melanoma cancer
cell lines with the plasmid expressing eIF6. As shown in
Figure 6A, the average expression of eIF6 did not exceed
2.5-fold its expression with respect to the control, similar to the previous results obtained with the A2780 cells.
Moreover, we probed the same lysate samples with anticdc42 antibodies. The results confirmed an up-regulation
of the protein to a similar extent of that observed in
A2780 cells. Also in this case, the changed levels of cdc42
A
protein did not arise from a differential transcriptional
control, as mRNA levels remained unchanged (Figure 6B).
According to our purpose, we tested whether eIF6
over-expression had any impact on the migratory and
invasive capabilities of the WM793 cells. To this end,
transwell migration and invasion assays were performed
on WM793 transiently transfected with pcDNA3.1/eIF6
plasmid and the empty vector used as the control. As
shown in Figure 6(C), the WM793/eIF6 cells displayed
about a 4-fold increase in migratory capacity with respect to the WM793 cells transfected with the control.
The most pronounced effects were obtained when the
B
C
D
Figure 6 eIF6 is implicated in the control of cell motility/invasiveness in WM793 melanoma cancer cells inducing an increased
expression of cdc42 protein. The results of eIF6 over-expression on the migratory activity of the cells were generalizable to other cell line
models. A) eIF6 and cdc42 expression in WM793 primary melanoma cell lines transiently transfected either with the pcDNA3.1-eIF6 or control
plasmid was analyzed by western blotting. B) qPCR of cdc42 mRNA was performed analysing 2 μg of total RNA reverse-transcribed into cDNA
and comparing its expression between WM793 primary melanoma cell lines over-expressing eIF6 with respect the control. The bar graphs
represent the relative fold changes of cdc42 mRNA presented as mean ± S.D. and relative to that of GAPDH. The results are the average of three
independent experiments C) Migration assay: WM793/eIF6 and control cells were seeded in the upper side of migration chambers. The cells
migrated to the lower chamber after 48 h of incubation were stained with crystal violet dye. D) Invasivity assay: cells were seeded in the upper
side of invasion chambers. After 48 h cells migrated in the lower chamber were stained with crystal violet dye. The total stained area in the lower
chambers was estimated using the Image-J software. The cell images in C and D are representative of three independent experiments. The
histograms in B, C and D represent the average of three independent experiments. The P-values were calculated with the t-test using the
symbols (**) and (*) corresponding to < 0.05 and < 0.01, respectively.
Pinzaglia et al. BMC Cancer (2015) 15:131
invasive capacity was tested by transwell/matrigel assays
(Figure 6D). In this case the increased activity of invasion was about 6-fold higher than the control. This difference was greater with respect to the previous results
obtained on A2780 cells [16], probably due to the poor
basal invasive capacity of the WM793 cell lines rendering the eIF6-induced invasion activity more pronounced.
Overall, the outcome of these experiments confirmed
and extended the previous results observed in ovarian
cancer cell lines, i.e. that eIF6 is implicated in the control of cell motility/invasiveness, also in different cellular
contexts.
Discussion
There is increasing evidence in the literature linking regulation of protein synthesis to cell transformation. For
instance, it is well known that the altered expression of
the translation initiation factor eIF4E contributes to cancer progression by enabling the translation of a limited
pool of mRNAs encoding key proteins involved in cellular
malignancy [7,29,30]. Similarly, the increased activity of
translational initiation factors involved in the correct positioning of the pre-initiation complex (PIC) 43S on the first
translatable codon AUG may cause the deregulation of
signaling pathways causative of tumor progression.
Recently, the protein eIF6 has been added to the group
of translation factors which are under the control of signal pathways sensing the nutrient levels of the surrounding environment. Specifically, the RACK1-PKC complex
represents the last step of the Ras-PKC cascade, where
phosphorylating eIF6 on Ser235 inhibits its association
with 60S subunits. Moreover, eIF6 haploinsufficient mice
are less susceptible to Myc and growth factor-induced
tumors, suggesting that this protein is rate limiting for
translation, cell growth and transformation [10].
In a previous work we observed that eIF6 overexpression in A2780 ovarian cancer cells stimulated their
motility and invasiveness [16]. Here, we performed a
proteomic analysis of membrane-associated proteins differentially expressed in cells transiently over-expressing
eIF6. We focused our attention on the analysis of the
membrane-bound proteins as those most likely to be
affected by the pathways controlling cell motility and
migration. In this regard, our analysis represents the
first comprehensive overview of the impact of eIF6
over-expression on cellular membrane-bound proteins.
Strikingly, we found that eIF6 over-expression in turn upregulates a set of proteins participating in a functional network known to control tumor cell motility. Among these
proteins, the most prominent were cdc42, syndecan-1,
HCLS1-associated protein X-1 (also called HAX1) and the
hepatocyte growth factor (HGF).
To confirm the validity of the proteomic analysis, we
have further investigated the involvement in eIF6-induced
Page 13 of 15
motility of cdc42, a member of the Rho GTPase subfamily,
known to be involved in actin cytoskeletal reorganization,
cell adhesion, cell migration, invasion, and control of cell
cycle progression. We found that besides up-regulating
the levels of cdc42, eIF6 over-expression increased
the amount of active cdc42 forms (GTP-bound), thereby
stimulating the cdc42-Pak signalling. Moreover, we
demonstrated that the use of the specific cdc42 inhibitor ML-141 decreased eIF6 induced cell migration.
Finally, over-expression of eIF6 in primary melanoma
cell lines (WM793) induced cdc42 up-regulation and
increased motility and invasiveness, thus demonstrating that the tumor-promoting ability of this initiation
factor is not restricted to the A2780 cell line. Notably, both eIF6 and cdc42 have been reported to be
up-regulated in cells over-expressing PRL-1, a putative
oncogene involved in the control of a number of diverse biological processes, including migration and
invasion [31]. Our results could suggest a possible
mechanism of regulation in which eIF6 act as a mediator of the cdc42 expression at the translational level,
although additional experiments are needed to elucidate
this issue.
However, besides cdc42, further investigation is required to gain deep insights on the molecular mechanisms by which eIF6 overexpression promotes cell
migration. In this regard, both the precise role of the
other membrane-associated main targets of eIF6 (syndecan-1, HCLS1-associated protein X-1, HGF) and the
extension of the proteomic analysis on soluble proteins
need to be defined. The importance of this analysis is
also indicated by the fact that some of the proteins upregulated upon eIF6 over-expression had altered steady
state mRNA levels, suggesting, in this case, an indirect
control of their expression by eIF6, possibly via the
translational modulation of some transcription factor.
eIF6 was originally described as a ribosome antiassociation factor, and indeed it has a dose-dependent
inhibitory effect on in vitro translation [32,33]. In vivo,
variations in eIF6 abundance do not seem to grossly
affect global protein synthesis [16,12]. However, it must
be borne in mind that viable transformed cells displayed,
at most, a two-three-fold over-expression of the protein,
thus suggesting that high amounts of eIF6 are lethal. In
the light of these data, the most probable hypothesis is
that eIF6 overabundance alters the rate/efficiency at which
certain mRNAs are translated, favouring up-regulation of
motility-promoting proteins that are normally poorly
translated.
The main difficulty in comprehending the mechanism
whereby this alteration of the translational landscape
may take place is that the function of eIF6 in translation
is not completely understood. A number of data indicate
that the factor may participate in ribosome recycling
Pinzaglia et al. BMC Cancer (2015) 15:131
[34]. If this is true, an excess of eIF6 may increase recycling, perhaps making more ribosomes available for the
translation of certain mRNAs. There is also evidence
that eIF6 is involved in ribosome biogenesis [35,36]. In
this capacity, an excess of the factor may produce altered
ribosomes that may bind certain mRNA classes preferentially. Some evidence in support of the latter idea
comes from our quantitative proteomic analysis, which
showed that eIF6 over-expression also affects the abundance of certain RPs in membrane-associated ribosomes
(Additional file 2: Table S1). Strikingly, some of these
RPs are located on 60S subunits mapping in the vicinity
of the eIF6 binding site (RPL13a, RPL24 and RPL35a),
suggesting a common functional activity. The idea that
perturbations in ribosome structure may deregulate translation of mRNAs encoding cancer-promoting proteins is
supported by published data, as illustrated by X-linked
dyskeratosis congenita [37] or from research performed
on single mutated genes coding for RPs, as RPL38 or
RPL10 [38,39].
Conclusion
In conclusion, our results contribute to shed light on the
role of eIF6 in the onset and progression of cell transformation, thus suggesting a molecular platform for developing new anti-cancer strategies.
Additional files
Additonal file 1: Figure S1. Analysis of transfected cells.
Additional file 2: Table S1. Membrane associated proteins expression
levels in A2780/eIF6 vs A2780/pcDNA3.1 cells, as identified by nanoLC-MS/MS
analysis. Significant (p≤0,05) differentially expressed proteins with fold
change higher then 1,5 are reported.
Abbreviations
SILAC: Stable isotope labeling by/with amino acids in cell culture; Paks:
p21-activated kinases; IPA: Ingenuity pathway analysis; CHX: Cycloheximide.
Competing interests
The authors declare that they have no competing interests.
Authors’ contributions
MP, ClM and DP performed the majority of experiments, analyzed and
interpreted data. DB and CaM designed the research, contributed to the
conception, analyzed and interpreted data, and wrote the manuscript. PL, MT
and ALT contributed to the conception, analyzed and interpreted data. SM and
DP performed and analyzed the experiments. All authors reviewed and
accepted the manuscript. All authors read and approved the final manuscript.
Acknowledgments
We are deeply grateful to Ms. Andrea Baker (INMI Rome, Italy) for the
editing. This work was supported by grants to PL from the Istituto
Pasteur-Fondazione Cenci Bolognetti project “Detecting and characterizing
specialized ribosomes translating specific classes of mRNAs in Archaea” and
by funds from the Roma Sapienza University to PL for the project 2013
“Functional analysis of the translational factor eIF6, a tumor-promoter that
enhances cell motility and invasiveness”; MIUR Ministero dell’Università e
Ricerca Scientifica (FIRB 2012, codice progetto RBFR12NSCF); Ministero della
Salute (Ricerca Corrente) and Associazione Italiana per la Ricerca sul Cancro
(IG 14114).
Page 14 of 15
Statement of originality
The authors confirm that this manuscript contains original material.
Author details
1
Istituto Pasteur-Fondazione Cenci Bolognetti and Department of Cellular
Biotechnologies and Haematology, Sapienza University of Rome, Via Regina
Elena 324, 00161 Rome, Italy. 2L. Spallanzani National Institute for Infectious
Diseases, IRCCS, Via Portuense 292, 00149 Rome, Italy. 3European Molecular
Biology Laboratory, Meyerhofstrasse 1, Heidelberg 69117, Germany.
4
Department of Life and Environmental Science, Polytechnic University of
Marche, Via Brecce Bianche, 60131 Ancona, Italy.
Received: 17 November 2014 Accepted: 20 February 2015
References
1. Conlon I, Raff M. Size control in animal development. Cell. 1999;96:235–44.
2. Derenzini M, Ploton D. Interphase nucleolar organizer regions in cancer
cells. Int Rev Exp Pathol. 1991;32:149–92.
3. Spriggs KA, Bushell M, Willis AE. Translational regulation of gene expression
during conditions of cell stress. Mol Cell. 2010;40(2):228–37.
4. Mayer C, Grummt I. Ribosome biogenesis and cell growth: mTOR
coordinates transcription by all three classes of nuclear RNA polymerases.
Oncogene. 2006;25:6384–91.
5. Rajasekhar VK, Holland EC. Postgenomic global analysis of translational
control induced by oncogenic signalling. Oncogene. 2004;23:3248–64.
6. Graff JR, Konicek BW, Lynch RL, Dumstorf CA, Dowless MS, McNulty AM,
et al. eIF4E activation is commonly elevated in advanced human prostate
cancers and significantly related to reduced patient survival. Cancer Res.
2009;69:3866–73.
7. Graff JR, Zimmer SG. Translational control and metastatic progression:
enhanced activity of the mRNA cap-binding protein eIF-4E selectively
enhances translation of metastasis-related mRNAs. Clin Exp Metastasis.
2003;20(3):265–73.
8. De Benedetti A, Graff JR. eIF-4E expression and its role in malignancies and
metastases. Oncogene. 2004;23:3189–99.
9. Freed EF, Bleichert F, Dutca LM, Baserga SJ. When ribosomes go bad:
diseases of ribosome biogenesis. Mol Biosyst. 2010;6(3):481–93.
10. Gandin V, Miluzio A, Barbieri AM, Beugnet A, Kiyokawa H, Marchisio PC,
et al. Eukaryotic initiation factor 6 is rate-limiting in translation, growth and
transformation. Nature. 2008;455(7213):684–8.
11. Rosso P, Cortesina G, Sanvito F, Donadini A, Di Benedetto B, Biffo S, et al.
Overexpression of p27BBP in head and neck carcinomas and their lymph
node metastases. Head Neck. 2004;26(5):408–17.
12. Miluzio A, Beugnet A, Grosso S, Brina D, Mancino M, Campaner S, et al.
Impairment of cytoplasmic eIF6 activity restricts lymphomagenesis and
tumor progression without affecting normal growth. Cancer Cell.
2011;19(6):765–75.
13. Groft CM, Beckmann R, Sali A, Burley SK. Crystal structures of ribosome
anti-association factor IF6. Nat Struct Biol. 2000;7(12):1156–64.
14. Russell DW, Spremulli LL. Purification and characterization of a ribosome
dissociation factor (eukaryotic initiation factor 6) from wheat germ. J Biol
Chem. 1979;254:8796–800.
15. Basu U, Si K, Warner JR, Maitra U. The Saccharomyces cerevisiae TIF6 gene
encoding translation initiation factor 6 is required for 60S ribosomal subunit
biogenesis. Mol Cell Biol. 2001;21:1453–62.
16. Benelli D, Cialfi S, Pinzaglia M, Talora C, Londei P. The translation factor eIF6
is a notch-dependent regulator of cell migration and invasion. PLoS One.
2012;7(2):e32047.
17. Talora C, Campese AF, Bellavia D, Felli MP, Vacca A, Gulino A, et al. Notch
signaling and diseases: an evolutionary journey from a simple beginning to
complex outcomes. Biochim Biophys Acta. 2008;1782:489–97.
18. Hsieh AC, Liu Y, Edlind MP, Ingolia NT, Janes MR, Sher A, et al. The
translational landscape of mTOR signalling steers cancer initiation and
metastasis. Nature. 2012;485(7396):55–61.
19. Zhu LJ, Altmann SW. mRNA and 18S-RNA coapplication-reverse
transcription for quantitative gene expression analysis. Anal Biochem.
2005;345(1):102–9.
20. Yamazaki D, Kurisu S, Takenawa T. Regulation of cancer cell motility through
actin reorganization. Cancer Sci. 2005;96(7):379–86.
Pinzaglia et al. BMC Cancer (2015) 15:131
Page 15 of 15
21. Bray K, Gillette M, Young J, Loughran E, Hwang M, Sears JC, et al. Cdc42
overexpression induces hyperbranching in the developing mammary gland
by enhancing cell migration. Breast Cancer Res. 2013;15(5):R91.
22. Backlund Jr PS. Post-translational processing of RhoA carboxyl methylation
of the carboxyl-terminal prenylcysteine increases the half-life of Rhoa. J Biol
Chem. 1997;272(52):33175–80.
23. Kiosses WB, Daniels RH, Otey C, Bokoch GM, Schwartz MA. A role for
p21-activated kinase in endothelial cell migration. J Cell Biol.
1999;147(4):831–44.
24. Ip CK, Cheung AN, Ngan HY, Wong AS. p70 S6 kinase in the control of actin
cytoskeleton dynamics and directed migration of ovarian cancer cells.
Oncogene. 2011;30(21):2420–32.
25. Surviladze Z, Waller A, Strouse JJ, Bologa C, Ursu O, Salas V, et al. A Potent
and Selective Inhibitor of Cdc42 GTPase. Probe Reports from the NIH
Molecular Libraries Program. Bethesda (MD): National Center for
Biotechnology Information (US); 2010.
26. Hong L, Kenney SR, Phillips GK, Simpson D, Schroeder CE, Nöth J, et al.
Characterization of a Cdc42 protein inhibitor and its use as a molecular
probe. J Biol Chem. 2013;288(12):8531–43.
27. Hsu MY, Elder DE, Herlyn M. Melanoma: The Wistar (WM) Melanoma Cell
Lines. In: Masters JRW, Palsson B, editors. Human Cell Culture, vol.
1999. 1999. p. 259–74.
28. Kobayashi H, Man S, MacDougall JR, Graham CH, Lu C, Kerbel RS. Variant
sublines of early-stage human melanomas selected for tumorigenicity in
nude mice express a multicytokine-resistant phenotype. Am J Pathol.
1994;144:776–86.
29. Gallagher WM, Bergin OE, Raffertyy M, Kellyy ZD, Nolan IM, Fox E, et al.
Multiple markers for melanoma progression regulated by DNA methylation:
insights from transcriptomic studies. Carcinogenesis. 2005;26(11):1856–67.
30. Mamane Y, Petroulakis E, Rong L, Yoshida K, Wee Ler L, Sonenberg N.
eIF4E – from translation to transformation. Oncogene. 2004;23:3172–9.
31. Dumaual CM, Steere BA, Walls CD, Wang M, Zhang ZY, Randall SK.
Integrated analysis of global mRNA and protein expression data in HEK293
cells overexpressing PRL-1. PLoS One. 2013;8(9):e72977.
32. Stumpf CR, Ruggero D. The cancerous translation apparatus. Curr Opin
Genet Dev. 2011;21(4):474–83.
33. Dario Benelli D, Marzi S, Mancone C, Alonzi T, La Teana A, Londei P.
Function and ribosomal localization of aIF6, a translational regulator shared
by archaea and eukarya. Nucleic Acids Res. 2009;37(1):256–67.
34. Ceci M, Gaviraghi C, Gorrini C, Sala LA, Offenhäuser N, Marchisio PC, et al.
Release of eIF6 (p27BBP) from the 60S subunit allows 80S ribosome
assembly. Nature. 2003;426(6966):579–84.
35. Pisarev AV, Skabkin MA, Pisareva VP, Skabkina OV, Rakotondrafara AM,
Hentze MW, et al. The role of ABCE1 in eukaryotic post-termination
ribosomal recycling. Mol Cell. 2010;37(2):196–210.
36. Wong CC, Traynor D, Basse N, Kay RR, Warren AJ. Defective ribosome
assembly in Shwachman-Diamond syndrome. Blood. 2011;118(16):4305–12.
37. Yoon A, Peng G, Brandenburger Y, Zollo O, Xu W, Rego E, et al. Impaired
control of IRES-mediated translation in X-linked dyskeratosis congenita.
Science. 2006;312(5775):902–6.
38. Kondrashov N, Pusic A, Stumpf CR, Shimizu K, Hsieh AC, Xue S, et al.
Ribosome-mediated specificity in Hox mRNA translation and vertebrate
tissue patterning. Cell. 2011;145(3):383–97.
39. Sulima SO, Patchett S, Advani VM, De Keersmaecker K, Johnson AW,
Dinman JD. Bypass of the pre-60S ribosomal quality control as a pathway to
oncogenesis. Proc Natl Acad Sci U S A. 2014;111(15):5640–5.
Submit your next manuscript to BioMed Central
and take full advantage of:
• Convenient online submission
• Thorough peer review
• No space constraints or color figure charges
• Immediate publication on acceptance
• Inclusion in PubMed, CAS, Scopus and Google Scholar
• Research which is freely available for redistribution
Submit your manuscript at
www.biomedcentral.com/submit