ADAM12-L is a direct target of the miR-29 and miR-200 families in breast cancer
Bạn đang xem bản rút gọn của tài liệu. Xem và tải ngay bản đầy đủ của tài liệu tại đây (2.02 MB, 13 trang )
Duhachek-Muggy and Zolkiewska BMC Cancer (2015) 15:93
DOI 10.1186/s12885-015-1108-1
RESEARCH ARTICLE
Open Access
ADAM12-L is a direct target of the miR-29 and
miR-200 families in breast cancer
Sara Duhachek-Muggy and Anna Zolkiewska*
Abstract
Background: ADAM12-L and ADAM12-S represent two major splice variants of human metalloproteinase-disintegrin
12 mRNA, which differ in their 3′-untranslated regions (3′UTRs). ADAM12-L, but not ADAM12-S, has prognostic and
chemopredictive values in breast cancer. Expression levels of the two ADAM12 splice variants in clinical samples are
highly discordant, suggesting post-transcriptional regulation of the ADAM12 gene. The miR-29, miR-30, and miR-200
families have potential target sites in the ADAM12-L 3′UTR and they may negatively regulate ADAM12-L expression.
Methods: miR-29b/c, miR-30b/d, miR-200b/c, or control miRNA mimics were transfected into SUM159PT, BT549,
SUM1315MO2, or Hs578T breast cancer cells. ADAM12-L and ADAM12-S mRNA levels were measured by qRT-PCR,
and ADAM12-L protein was detected by Western blotting. Direct targeting of the ADAM12-L 3′UTR by miRNAs was
tested using an ADAM12-L 3′UTR luciferase reporter. The rate of ADAM12-L translation was evaluated by metabolic
labeling of cells with 35S cysteine/methionine. The roles of endogenous miR-29b and miR-200c were tested by
transfecting cells with miRNA hairpin inhibitors.
Results: Transfection of miR-29b/c mimics strongly decreased ADAM12-L mRNA levels in SUM159PT and BT549 cells,
whereas ADAM12-S levels were not changed. ADAM12-L, but not ADAM12-S, levels were also significantly diminished by
miR-200b/c in SUM1315MO2 cells. In Hs578T cells, miR-200b/c mimics impeded translation of ADAM12-L mRNA.
Importantly, both miR-29b/c and miR-200b/c strongly decreased steady state levels of ADAM12-L protein in all
breast cancer cell lines tested. miR-29b/c and miR-200b/c also significantly decreased the activity of an ADAM12-L
3′UTR reporter, and this effect was abolished when miR-29b/c and miR-200b/c target sequences were mutated. In
contrast, miR-30b/d did not elicit consistent and significant effects on ADAM12-L expression. Analysis of a publicly
available gene expression dataset for 100 breast tumors revealed a statistically significant negative correlation between
ADAM12-L and both miR-29b and miR-200c. Inhibition of endogenous miR-29b and miR-200c in SUM149PT and
SUM102PT cells led to increased ADAM12-L expression.
Conclusions: The ADAM12-L 3′UTR is a direct target of miR-29 and miR-200 family members. Since the miR-29 and
miR-200 families play important roles in breast cancer progression, these results may help explain the different
prognostic and chemopredictive values of ADAM12-L and ADAM12-S in breast cancer.
Keywords: Metalloproteinase, Disintegrin, Alternative splicing, microRNA, Post-transcriptional gene regulation, Breast
cancer, Claudin-low tumors, Epithelial-to-mesenchymal transition
Background
Deregulated expression and activity of ADAM12 (A Disintegrin And Metalloproteinase 12) have been frequently
observed in human breast cancer [1,2]. Overexpression
of ADAM12 in the Polyoma virus middle T antigen
(PyMT) mouse model of breast cancer accelerates tumor
* Correspondence:
Department of Biochemistry and Molecular Biophysics, Kansas State
University, 141 Chalmers Hall, Manhattan, KS 66506, USA
progression, and ADAM12 deficiency delays PyMTinduced mammary tumorigenesis [3,4]. The human
ADAM12 gene is the most frequently somatically mutated ADAM in breast cancer, and four missense mutations, D301H, G479E, T596A, and G668A, have a
significant impact on protein functionality in cancer
cells [5-7].
Human ADAM12 mRNA is alternatively spliced, with
several different transcript variants giving rise to distinct
© 2015 Duhachek-Muggy and Zolkiewska; licensee BioMed Central. This is an Open Access article distributed under the terms
of the Creative Commons Attribution License ( which permits unrestricted use,
distribution, and reproduction in any medium, provided the original work is properly credited. The Creative Commons Public
Domain Dedication waiver ( applies to the data made available in this
article, unless otherwise stated.
Duhachek-Muggy and Zolkiewska BMC Cancer (2015) 15:93
ADAM12 protein isoforms. Transcript variant 1 (exons
1-18 and 20-24, ~ 8,000 nt, RefSeq NM_003474) encodes a long, transmembrane protein isoform ADAM12L. Transcript variant 2 (exons 1-19, ~3,400 nt, RefSeq
NM_021641) gives rise to a short, secreted protein isoform ADAM12-S [8]. ADAM12-L and ADAM12-S
mRNAs contain entirely different 3′ untranslated regions
(3′UTRs) and are readily distinguishable by variantspecific probe-sets in several microarray platforms. Each
of these two variants can further exist as an “a” or “b”
form, which differ by a 9-nt extension at the end of exon
4. The “a” and “b” variants are not distinguishable in
microarray profiling experiments [9].
There is a striking difference in the prognostic value
of ADAM12-L and ADAM12-S, and the expression
levels of these two ADAM12 splice variants in clinical
samples are highly discordant. ADAM12-L, but not
ADAM12-S, is significantly elevated in the claudin-low
molecular subtype of breast cancer, which has features
of epithelial-mesenchymal transition (EMT), high expression of immune and endothelial genes, and gene
expression signature reminiscent of mammary stem
cells [10-13]. ADAM12-L is also induced during EMT
in mammary epithelial cells [12,14-17], is enriched in
mammary epithelial cells or breast cancer cells grown
in suspension as mammospheres [12,18,19], is upregulated in residual tumors remaining after endocrine
therapy for estrogen receptor (ER)-positive disease
[12,19,20], and the level of ADAM12-L expression predicts
resistance to chemotherapy in ER-negative breast tumors
[12,21-23]. In patients with lymph node-negative breast tumors who did not receive systemic treatment, ADAM12-L
expression level is significantly associated with decreased distant metastasis-free survival times [24-27].
In contrast, ADAM12-S is not related to any of these
characteristics [12,27].
The discrepancy between expression patterns of
ADAM12-L and ADAM12-S in breast cancer clinical samples suggests that ADAM12-L expression may be regulated
at the post-transcriptional level, through microRNAs targeting the unique 3′UTR present in this variant. Of particular interest are the miR-200, miR-29, and miR-30
families, which all have been linked to the mesenchymal
phenotype, invasion, or metastasis in breast cancer
[28,29], and which all have predicted target sites in the
ADAM12-L 3′UTR, but not in the ADAM12-S 3′UTR.
The miR-200 family, by forming a double-negative
feedback loop with transcription factors of ZEB1 and
ZEB2, is a key negative regulator of EMT and is downregulated in breast cancer stem-like cells and in normal
mammary stem/progenitor cells [29-33]. The miR-29
family, in particular miR-29b, is enriched in luminal
breast cancers and inhibits metastasis by repressing
regulators of angiogenesis, collagen remodeling, and
Page 2 of 13
tumor microenvironment [34]. Loss of miR-29b promotes a mesenchymal phenotype and increases metastasis. Furthermore, the miR-29 family members directly
target Krüppel-like factor 4 (KLF4), a transcription factor required for the maintenance of breast cancer stem
cells, and down-regulation of miR-29 family members
results in increased stem-like properties in vitro and
in vivo [35]. The miR-30 family appears to modulate
the stem-like properties of breast cancer cells as well.
Reduction of miR-30 levels was reported to promote
self-renewal and to inhibit apoptosis in breast tumorinitiating cells [36]. Down-regulation of miR-30 family
members was observed in non-adherent mammospheres compared to breast cancer cells under adherent
conditions [37].
In this report, we asked whether ADAM12-L expression in breast cancer cells is regulated by members of
the miR-200, miR-29, and miR-30 families. We established that transfection of miR-29b/c and miR-200b/c
mimics strongly decreased the level of ADAM12-L protein in claudin-low SUM159PT, BT549, SUM1315MO2,
and Hs578T cells, while miR-30b/d mimics had a more
modest effect. Down-regulation of ADAM12-L by miR29b/c and miR-200b/c occurred at the post-transcriptional
level and was mediated through direct targeting of the
ADAM12-L 3′UTR, resulting in either target mRNA degradation or decreased translation, depending upon the cell
line studied. Importantly, we found a significant negative
correlation between ADAM12-L and both miR-29b and
miR-200c in breast invasive carcinomas. Inhibition of the
endogenous miR-29b and miR-200c with miRNA hairpin
inhibitors increased the level of ADAM12-L mRNA in
SUM149PT and SUM102PT cell lines. These results
underscore a novel post-transcriptional mode of regulation of ADAM12 expression and help explain the different
prognostic and chemopredictive value of ADAM12-L and
ADAM12-S in breast cancer.
Methods
Approvals
The Institutional Biosafety Committee at Kansas State
University approved all experiments performed in this
project (IBC Protocol #942). We did not perform any
human or animal studies. Our analysis of human data
resulted from mining previously published datasets.
Reagents
MiRIDIAN microRNA mimics, mimic negative control,
microRNA hairpin inhibitors, and hairpin inhibitor
negative control were obtained from Dharmacon. The
ADAM12-L 3′UTR luciferase reporter construct containing nt 3097-6065 from the ADAM12-L transcript was obtained from Origene. Anti-ADAM12-L rabbit polyclonal
antibody (#3394), raised against the cytoplasmic domain
Duhachek-Muggy and Zolkiewska BMC Cancer (2015) 15:93
of human ADAM12-L, was generated in our laboratory,
as previously described [27]. This antibody was used for
immunoblotting at a 1:10,000 dilution, with overnight
incubation. Anti-α-tubulin mouse monoclonal antibody
was obtained from Sigma (clone DM1A) and used at a
1:200,000 dilution.
Cell culture
SUM149PT, SUM159PT, and SUM1315MO2 cell lines
were obtained from Asterand (Detroit, MI). BT549 and
Hs578T cells were obtained from American Type Culture
Collection (Manassas, VA). SUM102PT cells were a gift
from Dr. Fariba Behbod (University of Kansas Medical
Center). SUM149PT and SUM159PT cells were cultured
in Ham’s F-12 medium supplemented with 5% fetal bovine
serum (FBS), 10 mM HEPES, 5 μg/ml insulin, and 1 μg/
ml hydrocortisone. SUM1315MO2 cells were cultured in
Ham’s F-12 medium supplemented with 5% FBS, 10 mM
HEPES, 10 ng/ml epidermal growth factor, and 5 μg/ml
insulin. BT549 cells were cultured in RPMI-1640 medium
supplemented with 10% FBS, 1 mM pyruvate, and 0.8 μg/
ml insulin. Hs578T cells were cultured in Dulbecco’s
Modified Eagle Medium (DMEM) supplemented with
10% FBS and 10 μg/ml insulin. SUM102PT were culture
in Ham’s F-12 medium supplemented with 5% FBS, 1 μg/
ml hydrocortisone, 5 μg/ml insulin and 1% penicillin/
streptomycin/Fungizone. Cells were maintained at 37°C
under humidified atmosphere containing 5% CO2.
Cell transfections
Cells were seeded onto new plates one day prior to transfection. MicroRNA mimics and hairpin inhibitors were resuspended in 1× siRNA buffer (Dharmacon) and
transfected at a final concentration of 50 nM and 100 nM,
respectively, using DharmaFECT 1 transfection reagent
(Dharmacon). Transfection complexes were removed after
24 hours, and cells were analyzed 48-72 hours later.
Plasmid transfection was performed using X-tremeGENE
HP transfection reagent (Roche) and 0.1 μg DNA per well
in 24-well plates, at a 2:1 reagent:DNA ratio. For cells
transfected with both miRNA and plasmid DNA, the
transfections were performed sequentially, with the
miRNA mimics introduced first and the plasmid introduced the following day. Targeted down-regulation of
ZEB1 by miR-200b/c was used as positive control. The
transfection conditions used throughout the paper to target ADAM12-L caused ZEB1 protein knock-down to undetectable levels by miR-200b/c mimics in SUM159PT,
SUM1315MO2, and Hs578T cells, and decreased the
ZEB1 3′UTR reporter in SUM159PT cells by 50%.
Western blotting
Cells were treated with lysis buffer (50 mM Tris-HCl pH
7.4, 150 mM NaCl, 1% Triton X-100, 0.5% sodium
Page 3 of 13
deoxycholate, 0.1% sodium dodecylsulfate, 5 mM EDTA,
1 mM 4-(2-Aminoethyl) benzenesulfonyl fluoride hydrochloride (AEBSF), 5 μg/ml pepstatin, 5 μg/ml leupeptin,
5 μg/ml aprotinin, and 10 mM 1,10-phenanthroline). Extracts were centrifuged for 15 minutes at 16,000g at 4°C.
After centrifugation, the supernatants were directly analyzed by Western blotting using anti-tubulin antibody or
incubated with concanavalin A agarose (Sigma; 50 μl
resin per 1 ml cell lysate) for 2 hours at 4°C to enrich
for glycoproteins. The resin was washed three times and
the glycoproteins were eluted with 3× SDS gel loading
buffer. Proteins were resolved using SDS-PAGE (8% gel)
and were transferred to a nitrocellulose membrane. The
membrane was stained with Ponceau S and an image
was saved. The membrane was blocked using 5% milk
and 0.3% Tween-20 in Dulbecco’s Phosphate Buffered
Saline (DPBS). Primary antibody was diluted in blocking
buffer and incubated with the membrane. Horseradish
peroxidase-conjugated anti-rabbit or anti-mouse antibody was used as a secondary antibody. Detection was
performed using the SuperSignal West Pico Chemiluminescent Substrate (Pierce). Each experiment was repeated independently at least two times; representative
blot images are shown.
3′UTR luciferase reporter assays
Cells were sequentially transfected with miRNA mimics
and the 3′UTR reporter plasmids, as described above. A
Renilla luciferase vector, pRL-TK (Promega) was cotransfected with the reporter plasmid as a transfection
control. Forty eight hours after vector transfection, the
cells were washed with DPBS containing calcium and
magnesium and then lysed using 1× Passive Lysis Buffer
(Promega), according to the manufacturer’s instructions.
The lysates were analyzed for firefly and Renilla luciferase activities using the Dual Luciferase Reporter Assay
System (Promega).
Mutagenesis
The predicted miR-29, miR-30, and two miR-200 target
sites in the ADAM12-L 3′UTR reporter plasmid were mutated by site-directed mutagenesis. The primers to mutate
the miR-29 site were: 5′-TGC TGT GCT GTG CTA CTT
TGC TCT GTC TAC TTG C-3′ (F) and the reverse complement. The primers to mutate the miR-30 site were: 5′TAT ACT ATT AAA AAG TCC TAC AGA ATT TTA
TGG-3′ (F) and the reverse complement. The primers
used to mutate the first miR-200 site were: 5′-TTC CCT
TAC AAT ATG GAT CTT ATT AAT CCT TCC AAG A3′ (F) and the reverse complement. The primers used to
mutate the second miR-200 site were: 5′-TTA ATC CTT
CCA AGA TGT CTT ATT TAT CAA GTG AAG C-3′
(F) and the reverse complement. The italicized portions
Duhachek-Muggy and Zolkiewska BMC Cancer (2015) 15:93
represent the mutated bases. The presence of mutations
was confirmed by DNA sequencing.
Page 4 of 13
Statistics
Correlation and t test analyses were performed using the
GraphPad Prism 6.0 software.
35
S metabolic labeling of cells
Hs578T cells were transfected with microRNA mimics
or mimic control, as described above. Two days after
transfection, cells were washed and incubated in labeling
media (9 parts DMEM without cysteine and methione: 1
part complete DMEM), containing 80 μCi/ml EasyTag
EXPRESS35S Protein labeling mix (PerkinElmer). After
labeling for the indicated times, cell lysates were prepared and ADAM12-L was immunoprecipitated using
antibody #3394 and Protein G Sepharose. Pre-immune
serum was used as a control. The immunocomplexes
were analyzed by SDS-PAGE and autoradiography. The
experiment was repeated independently two times.
cDNA preparation and qRT-PCR analysis
Total RNA was extracted using the Qiagen RNeasy kit
and was subjected to on-column digestion with deoxyribonuclease I (Qiagen). One microgram of the total RNA
was reverse-transcribed using the SuperScript III First
Strand Synthesis System (Life Technologies) and oligo
(dT) primers. Real time quantitative PCR (qRT-PCR) was
performed using 15 μl volumes in a 96-well format on a
CFX96 cycler. The final reaction mixture contained 7.5 μl
iQ SYBRgreen Supermix (BioRad), 6 μl diluted cDNA
(1:10 for ADAM12 analysis and 1:100 for ACTIN analysis)
and 0.5 μM primers. The primers used for ADAM12-L
analysis were 5′-AGC CAC ACC AGG ATA GAG AC-3′
(F) and 5′-CGC CTT GAG TGA CAC TAC AG-3′ (R).
The primers used for the ADAM12-S analysis were 5′TCC ATC CAA GCA AAC TGA AT-3′ (F) and 5′-GTT
GGT GAC TCT GTG GGT TC-3′ (R). The primers used
for ACTIN analysis were 5′-TTG CCG ACA GGA TGC
AGA A-3′ (F) and 5′-GCC GAT CCA CAC GGA GTA
CT-3′ (R). The PCR conditions were: 95°C, 10 s; 60°C, 15
s; 72°C, 30 s. At the conclusion of each run, a melt curve
analysis was performed to ensure that a single product
had been synthesized. The relative expression of
ADAM12, normalized to ACTIN, was calculated using
the 2-ΔΔCt method.
Data mining
ADAM12-L and ADAM12-S expression data for a panel
of breast cancer cell lines were retrieved from Gene Expression Omnibus (GEO) ( />geo/) and ArrayExpress ( The microRNA expression data for a panel of
breast cancer cell lines were obtained from the online
supplemental material from Riaz et al. [38]. ADAM12-L
and miRNA expression data for a cohort of 100 human
breast tumors were retrieved from GEO. Expression
values were log2-transformed and median-centered.
Results
Our previous analysis of a number of gene expression
profiles of human breast cancers revealed significant discrepancies between ADAM12-L and ADAM12-S expression levels [12]. Here, we examined ADAM12-L and
ADAM12-S levels in a panel of breast cancer cell lines,
which were previously profiled using two different
microarray platforms: an Agilent 4×44K platform (ref.
[39], Figure 1A) or an Affymetrix HG-U133A platform
(ref. [40], Figure 1B). In both cases, ADAM12-L was
strongly up-regulated in claudin-low cell lines, whereas
the level of ADAM12-S in claudin-low cells did not significantly differ from the rest of the cell lines. This expression pattern of ADAM12-L and ADAM12-S in cell
lines mirrored their expression patterns in clinical tumor
samples [12].
Selective up-regulation of ADAM12-L in claudin-low
samples raised the possibility that ADAM12-L expression might be repressed by one or more miRNAs, which
are down-regulated in claudin-low tumors/cell lines and
which could directly target the sites present in the
ADAM12-L 3′UTR. We focused on the miR-29, miR-30,
and miR-200 families, which act as tumor suppressors in
breast cancer. The miR-29 family consists of three members with the same seed sequence, miR-29a-c. The miR30 family is made up of 5 members, miR-30a-e. The
miR-200 family consists of five members: miR-200a-c,
miR-141 and miR-429. We have selected to study two
representative miRNAs from each family: miR-29b (a
potent inhibitor of breast tumor metastasis [34]) and
miR-29c (associated with a significantly reduced risk of
dying from breast cancer [41]), miR-30b and miR-30d
(both significantly down-regulated in ER-negative and
progesterone receptor (PR)-negative breast tumors [42]),
and miR-200b and miR-200c (both representing key
negative regulators of EMT and anoikis resistance
[30-32]). The 3′UTR of human ADAM12-L contains well
conserved potential target sites for miR-29b/c, miR-30b/d,
and two poorly conserved potential sites for miR-200b/c
(Figure 1C). miRNA profiling of 51 breast cancer cell lines
has previously established that miR-29b/c, miR-30d, and
miR-200b/c are under-expressed in claudin-low breast
cancer cell lines (ref. [38], Figure 1D; miR-30b was not
measured in the referenced study).
To determine whether low levels of miR-29b/c are required for high expression of ADAM12-L in claudin-low
cell lines, we utilized SUM159PT and BT549 cells, two
representative claudin-low cell lines with low endogenous levels of miR-29b/c (see Figure 1D). Cells were
transfected with miR-29b/c or control miRNA mimics,
Duhachek-Muggy and Zolkiewska BMC Cancer (2015) 15:93
Figure 1 (See legend on next page.)
Page 5 of 13
Duhachek-Muggy and Zolkiewska BMC Cancer (2015) 15:93
Page 6 of 13
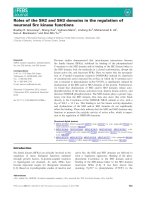
(See figure on previous page.)
Figure 1 Pattern of expression of ADAM12-L, ADAM12-S, and miRNAs in breast cancer cell lines. (A) Discrepancy between ADAM12-L and
ADAM12-S levels in a panel of human breast cancer cells profiled with the Agilent 4×44K UNC custom microarray platform, based on ref. [39]. The
expression data were retrieved from GEO:GSE50470. Expression values of ADAM12-L were calculated as the average readouts for three probes
(A_23_P202327, NM_003474_2_4965, and NM_003474_2_4854). Expression values of ADAM12-S are based on the A_23_P350512 probe. (B)
Discrepancy between ADAM12-L and ADAM12-S expression levels in a panel of human breast cancer cells profiled with the Affymetrix HG-U133A
platform, based on ref. [40]. The expression data were retrieved from ArrayExpress, accession number E-TABM-157. (C) Predicted miR-29b/c, miR-30b/d,
and miR-200b/c target sites in the human ADAM12-L 3′UTR, based on TargetScan Release 6.2. (D) miR-29b, miR-29c, miR-30d, miR-200b, and miR-200c
levels in a panel of breast cancer cell lines, based on ref. [38]. Expression data for miR-30b were not available. Downloaded data were log2-transformed,
median-centered and Z scores were calculated. In A, B, and D, each colored square in the heatmaps represents the relative transcript abundance, in
log2 space. Expression values were median-centered across all cell lines.
and the levels of ADAM12-L and ADAM12-S mRNAs
were measured three days later by qRT-PCR. We found
that miR-29b/c mimics decreased the level of ADAM12-L
by ~70%, and that this effect was statistically significant
(Figure 2A). ADAM12-S expression was not significantly
altered by transfection with miR-29b/c mimics. In parallel
experiments, we examined the effects of miR-29b/c on
ADAM12-L protein expression by immunoblotting. We
observed that both miR-29b and miR-29c strongly diminished the level of ADAM12-L protein in both cell lines
(Figure 2B). Testing the effect of miRNAs on the expression level of the ADAM12-S isoform was not possible because specific antibodies against ADAM12-S are
not currently available. Decreased ADAM12-L protein
and mRNA levels after transfection of miR-29b/c suggested that these miRNAs might be directly targeting
the ADAM12-L 3′UTR. To examine this possibility, we
performed a miRNA target reporter luciferase assay
using the pMirTarget reporter vector comprising a ~3kb region of the ADAM12-L 3′UTR down-stream of
the firefly luciferase gene. An approximately 50-60% reduction in the luciferase activity was observed in miR29b/c mimic-transfected SUM159PT cells compared to
control mimic-transfected cells (Figure 2C). Disruption
of the predicted miR-29 target site by site-directed mutagenesis largely diminished the effects of miR-29b/c.
Similarly, we assessed whether miR-30b/d potentially
target ADAM12-L. We transfected miR-30b/d or control
mimic into SUM159PT and SUM1315MO2 cells, two
claudin-low cell lines with low to moderate endogenous
miR-30b/d expression (Figure 1D), and measured the
level of ADAM12-L and ADAM12-S mRNA by qRT-PCR.
miR-30d exerted a ~30%, statistically significant, downregulation of ADAM12-L expression in SUM159PT
cells and no apparent inhibition of ADAM12-L expression in SUM1315MO2 cells. miR-30b did not diminish
ADAM12-L levels in either cell line and neither miRNA
mimic affected ADAM12-S expression (Figure 3A). miR30b/d had a modest effect on ADAM12-L protein in
both cell lines (Figure 3B). To test whether miR-30b
or miR-30d directly targets the ADAM12-L 3′UTR, we
used the luciferase reporter in SUM159PT cells.
Transfection of miR-30b mimic elicited a significant
decrease in luciferase activity but miR-30d mimic did
not (Figure 3C). Destruction of the potential miR-30
target site by mutagenesis eliminated the effect of
miR-30b mimic.
To study the effects of miR-200b/c mimics, we selected
SUM159PT, SUM1315MO2, and Hs578T cells, which all
express low levels of endogenous miR-200b/c (Figure 1D).
Transfecting miR-200b/c diminished ADAM12-L expression by ~20-30% in SUM159PT and SUM1315MO2 cells.
This effect was statistically significant in SUM1315MO2
cells, but it did not reach statistical significance in
SUM159PT cells (Figure 4A). Strikingly, Hs578T cells
showed no change in ADAM12-L levels after transfection
of miR-200b/c mimics. ADAM12-S levels were unchanged
in all three cell lines (Figure 4A). Interestingly, ADAM12L protein levels in SUM159PT, SUM1315MO2, or
HS578T cells were strongly down-regulated after transfection of miR-200b/c mimics (Figure 4B), despite modest or
negligible effects of these mimics on ADAM12-L mRNA
levels. Targeting the 3′UTR of ADAM12-L by miR-200b/c
was further assessed by luciferase reporter assays in
SUM159PT cells. Both miR-200b and miR-200c mimics
elicited a statistically significant, ~50% decrease in the luciferase activity, which was abolished when the two putative miR-200b/c target sites were destroyed (Figure 4C).
MiRNAs can reduce protein expression by inducing
mRNA degradation or by reducing the rate of mRNA
translation [43]. Since miR-200b/c mimics had no detectable effect on ADAM12-L mRNA level but they
strongly reduced ADAM12-L protein in Hs578T cells,
we asked whether miR-200b/c might have reduced the
rate of ADAM12-L translation in Hs578T cells. Cells
were transfected with miR-200b/c mimics (or control
mimic) and, three days later, we performed metabolic
cell labeling with 35S cysteine/methionine. After the
indicated periods of time, the cell lysates were subjected
to immunoprecipitation with an ADAM12-L antibody
or pre-immune serum, followed by SDS-PAGE and autoradiography. We observed that the amount of 35S-labeled
nascent form of ADAM12-L protein in miR-200b/c
mimic-transfected cells was substantially lower than the
amount of 35S-labeled ADAM12-L in control mimictreated cells (Figure 4D). These results suggest that the
Duhachek-Muggy and Zolkiewska BMC Cancer (2015) 15:93
Page 7 of 13
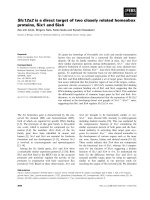
Figure 2 ADAM12-L, but not ADAM12-S, is a target for miR-29b/c. (A,B) SUM159PT and BT549 cells were transfected with miR-29b mimic, miR-29c
mimic, or mimic control. (A) ADAM12-L and ADAM12-S mRNA levels were measured by qRT-PCR and normalized to β-ACTIN. Fold changes in
miRNA-transfected cells versus control cells were calculated. Graphs represent average values obtained in three independent experiments ± SEM. Statistical
significance was determined by one-sample t tests. **P < 0.01, ***P < 0.001, ****P < 0.0001. (B) Cell lysates were enriched for glycoproteins and analyzed by
Western blotting using an anti-ADAM12-L antibody. The nascent, full-length form and the mature, processed form are indicated. A Ponceau S-stained band
in the glycoprotein-enriched fraction and tubulin in total cell lysates were used as loading controls. (C) Upper SUM159PT cells were transfected with
miR-29b, miR-29c mimics, or mimic control and then with the indicated ADAM12-L 3′UTR reporter or an empty vector and a Renilla luciferase control
vector. The firefly luciferase activity was measured after 48 h and was normalized to Renilla luciferase activity and to the empty vector. Graph shows the
average values for at least two independent experiments ± SEM. Significance was determined by one-sample t tests. ****P < 0.0001. Lower Three
nucleotides in the putative miRNA target site (shown in bold) were mutated to destroy the site. The mutated residues are shown in red above
the wild-type sequence. The position in the ADAM12-L 3′UTR relative to the stop codon is indicated.
main mechanism by which miR-200b/c reduced ADAM12-L
expression in Hs578T cells was most likely through the
inhibition of ADAM12-L mRNA translation.
To determine whether miR-29b/c, miR-30b/d, or miR200b/c might regulate ADAM12-L expression in breast
cancer patients in vivo, we examined the relationship between these miRNAs and ADAM12-L mRNA in a cohort
of 100 breast cancer patients for which mRNA/miRNA
expression data were publicly available (GEO: GSE19536)
[44]. Importantly, the microarray platform used in the referenced study contained an oligoprobe mapping uniquely
to the ADAM12-L transcript, without contribution of the
ADAM12-S splice variant. There was a significant negative
correlation between miR-29b and ADAM12-L (P =
0.0001), between miR-200c and ADAM12-L (P = 0.0002),
and a weaker but significant correlation between miR200b and ADAM12-L (P = 0.0464) (Figure 5A). These results are consistent with a role of miR-29b and miR-200c
(and possibly miR-200b) in the regulation of ADAM12-L
expression in breast tumors. To further test this hypothesis, we asked whether inhibition of the endogenous miR29b or miR-200c in SUM102PT and SUM149PT, two
basal cell lines with low to moderate expression of miR29b and miR-200c (see Figure 1D), is sufficient to increase
the level of ADAM12-L. We transfected these cells with
miRNA hairpin inhibitors to miR-29b and miR-200c (or
with control hairpin inhibitor) and assessed the level of
ADAM12-L mRNA by qRT-PCR. In SUM102PT cells,
miR-29b inhibitor increased the ADAM12-L level by
~80%, and this effect was significant. miR-200b/c inhibitor
Duhachek-Muggy and Zolkiewska BMC Cancer (2015) 15:93
Page 8 of 13
Figure 3 ADAM12-L is a poor target for miR-30b/d. (A,B) SUM159PT and SUM1315MO2 cells were transfected with miR-30b mimic, miR-30d mimic,
or mimic control. (A) ADAM12-L and ADAM12-S mRNA levels were measured by qRT-PCR and normalized to β-ACTIN. Fold changes in miRNA-transfected
cells versus control cells were calculated. Graphs represent average values obtained in three (for SUM159PT) or two (for SUM1315MO2)
independent experiments ± SEM. Statistical significance was determined by one-sample t tests. *P < 0.05. (B) Cell lysates were enriched for
glycoproteins and analyzed by Western blotting using an anti-ADAM12-L antibody. The nascent, full-length form and the mature, processed form are
indicated. A Ponceau S-stained band in the glycoprotein-enriched fraction and tubulin in total cell lysates were used as loading controls. (C) Upper
SUM159PT cells were transfected with miR-30b, miR-30d mimics, or mimic control and then with the indicated ADAM12-L 3′UTR reporter or an empty
vector and a Renilla luciferase control vector. The firefly luciferase activity was measured after 48 h and was normalized to Renilla luciferase activity and
to the empty vector. Graph shows the average values for at least two independent experiments ± SEM. Significance was determined by one-sample t
tests. ***P < 0.001. Lower Three nucleotides in the putative miRNA target site (shown in bold) were mutated to destroy the site. The mutated residues
are shown in red above the wild-type sequence. The position in the ADAM12-L 3′UTR relative to the stop codon is indicated.
increased ADAM12-L by ~20%, but this effect did not
reach the level of statistical significance (Figure 5B). In
SUM149PT cells, miR-29b and miR-200c inhibitors increased ADAM12-L levels by ~50% and ~30%, respectively, and these effects were statistically significant
(Figure 5B).
Discussion
In this report, we examined whether three miRNA families, miR-29, miR-30, and miR-200, directly target the
ADAM12-L 3′UTR in human breast cancer cells. Since
the ADAM12-S 3′UTR lacks predicted target sites for
these miRNA families and since miR-29, miR-30, or
miR-200 levels are highly variable in breast cancer, selective targeting of the ADAM12-L 3′UTR by these miRNAs might explain why ADAM12-L and ADAM12-S
expression patterns in breast tumors in vivo and in response to experimental manipulations in vitro often differ significantly.
Among the three miRNA families tested, miR-30
elicited the least consistent effects. While miR-30b diminished the ADAM12-L 3′UTR reporter activity, the
level of ADAM12-L mRNA in SUM159PT and
SUM1315MO2 cells was not affected upon transfection of miR-30b. In contrast, miR-30d seemed to
down-regulate ADAM12-L in SUM159PT cells, but
this effect was not reproduced in SUM1315MO2 cells,
and the ADAM12-L 3′UTR reporter activity was not
diminished in response to miR-30d. Both miR-30b and
miR-30d had only minor effects on ADAM12-L protein levels in SUM159PT and SUM1315MO2 cells. We
conclude that the miR-30 family does not contribute
Duhachek-Muggy and Zolkiewska BMC Cancer (2015) 15:93
Page 9 of 13
Figure 4 ADAM12-L, but not ADAM12-S, is a target for miR-200b/c. (A,B) SUM159PT, SUM1315MO2 and Hs578T cells were transfected with miR200b mimic, miR-200c mimic, or mimic control. (A) ADAM12-L and ADAM12-S mRNA levels were measured by qRT-PCR and normalized to β-ACTIN.
Fold changes in miRNA-transfected cells versus control cells were calculated. Graphs represent average values obtained in three independent
experiments ± SEM. Statistical significance was determined by one-sample t tests. *P < 0.05. (B) Cell lysates were enriched for glycoproteins
and analyzed by Western blotting using an anti-ADAM12-L antibody. The nascent, full-length form and the mature, processed form are indicated. A
Ponceau S-stained band in the glycoprotein-enriched fraction and tubulin in total cell lysates were used as loading controls. (C) Upper SUM159PT cells
were transfected with miR-200b, miR-200c mimics, or mimic control and then with the indicated ADAM12-L 3′UTR reporter or an empty vector and a
Renilla luciferase control vector. The firefly luciferase activity was measured after 48 h and was normalized to Renilla luciferase activity and to the empty
vector. Graph shows the average values for at least three independent experiments ± SEM. Significance was determined by one-sample t tests. ***P <
0.001. Lower Three nucleotides in each putative miRNA target site (shown in bold) were mutated to destroy the site. The mutated residues are shown
in red above the wild-type sequences. The positions in the ADAM12-L 3′UTR relative to the stop codon are indicated. (D) Hs578T cells were transfected
with miR-200b mimic, miR-200c mimic, or mimic control. Forty-eight hours after transfection, cells were treated with 35S methionine/cysteine for the
indicated periods of time, followed by immunoprecipitation with anti-ADAM12-L antibody or pre-immune serum, SDS-PAGE and autoradiography. The
nascent, full-length form of ADAM12-L (~120 kDa) is shown.
significantly to the regulation of ADAM12-L expression in the two cell lines examined here.
In contrast, miR-29b/c consistently produced strong
down-regulation of ADAM12-L expression at the
mRNA and protein levels in both SUM159PT and
BT549 cell lines, and they decreased the ADAM12-L 3′
UTR reporter activity in SUM159PT cells. Mutation of
the single miR-29 target site in the ADAM12-L 3′UTR
blunted the effect of miR-29b/c on the reporter activity,
confirming direct targeting of the ADAM12-L 3′UTR
region by miR-29b/c. The levels of the ADAM12-S
splice variant were not changed by miR-29b/c, consistent with the lack of any predicted miR-29 target sites in
the ADAM12-S 3′UTR.
The miR-29 family was reported previously to target
the Adam12 transcript in NIH3T3 cells [45]. miR-29 has
Duhachek-Muggy and Zolkiewska BMC Cancer (2015) 15:93
Figure 5 (See legend on next page.)
Page 10 of 13
Duhachek-Muggy and Zolkiewska BMC Cancer (2015) 15:93
Page 11 of 13
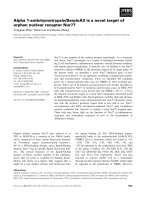
(See figure on previous page.)
Figure 5 Relationship between endogenous miR-29b, miR-200c, and ADAM12-L in breast tumors and breast cancer cell lines. (A) Correlation
between ADAM12-L and miRNA levels in a set of 100 human breast tumors profiled with the Agilent Whole Human Genome Microarray 4×44K G4112F
and the Agilent Human miRNA Microarray 2.0 G4470B, based on ref. [44]. The expression data were retrieved from GEO:GSE19536. Expression values of
ADAM12-L were based on the A_23_P202327 probe. The expression values were median-centered for all tumors. Pearson r and P values are shown for
each comparison. (B) SUM102PT and SUM149PT cells were transfected with miRNA hairpin inhibitors targeting miR-29b or miR-200c, or with hairpin
inhibitor control. ADAM12-L mRNA levels were measured by qRT-PCR and normalized to β-ACTIN. Fold changes in miRNA inhibitor-transfected cells versus
control cells were calculated. Graphs represent average values obtained in three independent experiments ± SEM. Statistical significance determined by
one-sample t tests. *P < 0.05, **P < 0.01.
been also implicated in the regulation of Adam12 expression in response to transforming growth factor β
(TGFβ) in experimental renal fibrosis in mice [46].
Adam12 is the only splice variant known to exist in mice
and, similar to human ADAM12-L, it contains a miR-29
target site. In humans, ADAM12-L was identified as one
of the direct targets of miR-29b in trabecular meshwork
cells, and increased expression of ADAM12-L in response to oxidative stress-induced down-regulation of
miR-29b may contribute to the elevation of intra-ocular
pressure in glaucoma [47]. In the context of breast cancer, miR-29b has been recently identified as a part of a
GATA3-miR-29b axis, which regulates the tumor microenvironment and inhibits metastasis [34]. Downregulation of miR-29 members also results in increased
expression of the transcription factor KLF4 and expansion of stem-like cell populations in vitro and in vivo
[35]. The miR-29 family is down-regulated in claudinlow cell lines and tumors, in which ADAM12-L, but not
ADAM12-S, is strongly elevated. Thus, increased expression of ADAM12-L in claudin-low cell lines and tumors
could be facilitated, at least in part, by low levels of miR29 family members.
The third miRNA family tested here, miR-200, has not
been previously reported to regulate ADAM12 expression. We have found that two members of this family,
miR-200b and miR-200c, strongly diminished ADAM12L protein in SUM159PT, SUM1315MO2, and Hs578T
cells. The decrease in ADAM12-L mRNA was, however,
more modest or, in the case of Hs578T cells, no change
in ADAM12-L was detected in miR-200b/c-transfected
cells. This apparent discrepancy between the effects of
miR-200b/c on ADAM12-L protein and mRNA levels
led us to investigate whether miR-200b/c might block
translation of ADAM12-L mRNA, as miRNA are known
to regulate mRNA stability and/or translation [43]. Indeed, we observed a slower rate of ADAM12-L protein
synthesis in Hs578T cells treated with miR-200b/c mimics
than in cells treated with control miRNA mimics. The
question of why the inhibition of ADAM12-L by miR200b/c expression in some cells (such as Hs578T) occurs
at the translational level, and why in other cells (such as
SUM159PT and SUM1315MO2) involves a decrease in
steady-state ADAM12-L mRNA levels, remains open.
Finally, the ADAM12-L 3′UTR reporter activity was significantly reduced by miR-200b/c, despite the fact that the
two predicted miR-200 target sites present in the
ADAM12-L 3′UTR are not well conserved between species. Mutations within these two miR-200 target sites
abolished the effect of transfected miR-200b/c mimics,
suggesting direct interaction between miR-200b/c and the
ADAM12-L 3′UTR. Similar to miR-29, the miR-200 family is down-regulated in claudin-low tumors and cell lines.
Thus, low expression levels of miR-200 family members,
together with low expression of miR-29, may create permissive conditions for high expression of ADAM12-L in
claudin-low tumors and cell lines.
To assess the clinical relevance of our results on the
regulation of ADAM12-L expression in breast cancer cell
lines, we analyzed publicly available expression data for a
cohort of 100 breast cancer patients and found negative
correlations between ADAM12-L mRNA and miR-29b,
miR-200b, and miR-200c. Among these three miRNAs,
miR-29b and miR-200c appear to be the most strongly
correlated with ADAM12-L in breast tumors. Importantly,
inhibition of endogenous miR-29b, and to a lesser extent
miR-200c, in two different cell lines representing the basal
subtype of breast cancer, SUM102PT and SUM149PT, led
to increased expression of ADAM12-L. These findings
support a role for the endogenous miR-29b and/or miR200c in the regulation of ADAM12-L gene expression at
the post-transcriptional level via targeting of the unique 3′
UTRs of ADAM12-L. Since the translation product of
ADAM12-L differs from the protein product of ADAM12S in its biochemical properties, cellular localization, and
most likely substrate specificity and function, better understanding of the mechanisms controlling expression of
each splice variant is an important step in the research on
ADAM12 in breast cancer.
Conclusions
The ADAM12-L 3′UTR is a direct target of miR-29 and
miR-200 family members. Since the miR-29 and miR200 families play important roles in breast cancer progression, these results may help explain the different
prognostic and chemopredictive values of ADAM12-L
and ADAM12-S in breast cancer.
Duhachek-Muggy and Zolkiewska BMC Cancer (2015) 15:93
Abbreviations
ADAM12: a disintegrin and metalloproteinase 12; miRNA: microRNA; 3′UTR: 3′
untranslated region; EMT: epithelial-to-mesenchymal transition; ER: estrogen
receptor; PR: progesterone receptor; TGFβ: transforming growth factor β;
PyMT: Polyoma virus middle T antigen; SDS-PAGE: sodium dodecyl sulfate
polyacrylamide gel electrophoresis; qRT-PCR: real-time quantitative reverse
transcription polymerase chain reaction; FBS: fetal bovine serum;
DPBS: Dulbecco’s phosphate buffered saline; DMEM: Dulbecco’s Modified
Eagle Medium; AEBSF: 4-(2-Aminoethyl) benzenesulfonyl fluoride
hydrochloride; HEPES: 2-(4-(2-hydroxyethyl)piperazin-1-yl)ethanesulfonic acid;
Tris: 2-Amino-2-hydroxymethyl-propane-1,3-diol.
Page 12 of 13
15.
16.
17.
18.
Competing interests
The authors declare that they have no competing interests.
Authors’ contributions
SDM participated in the design of the study, performed the experiments,
performed the statistical analyses, and helped draft the manuscript. AZ
conceived the study, participated in its design, and drafted the manuscript.
Both authors read and approved the final manuscript.
Acknowledgements
This work was supported by NIH grant R01CA172222 and Innovative
Research Award from Terry C. Johnson Center for Basic Cancer Research at
KSU. This is contribution 15-073-J from Kansas Agricultural Experiment
Station.
19.
20.
21.
22.
23.
Received: 2 September 2014 Accepted: 20 February 2015
24.
References
1. Kveiborg M, Albrechtsen R, Couchman JR, Wewer UM. Cellular roles of
ADAM12 in health and disease. Int J Biochem Cell Biol. 2008;40:1685–702.
2. Nyren-Erickson EK, Jones JM, Srivastava DK, Mallik S. A disintegrin and
metalloproteinase-12 (ADAM12): function, roles in disease progression, and
clinical implications. Biochim Biophys Acta. 1830;2013:4445–55.
3. Kveiborg M, Frohlich C, Albrechtsen R, Tischler V, Dietrich N, Holck P, et al. A
role for ADAM12 in breast tumor progression and stromal cell apoptosis.
Cancer Res. 2005;65:4754–61.
4. Frohlich C, Nehammer C, Albrechtsen R, Kronqvist P, Kveiborg M, SeharaFujisawa A, et al. ADAM12 produced by tumor cells rather than stromal cells
accelerates breast tumor progression. Mol Cancer Res. 2011;9:1449–61.
5. Dyczynska E, Syta E, Sun D, Zolkiewska A. Breast cancer-associated mutations in
metalloprotease disintegrin ADAM12 interfere with the intracellular trafficking
and processing of the protein. Int J Cancer. 2008;122:2634–40.
6. Stautz D, Wewer UM, Kveiborg M. Functional analysis of a breast cancerassociated mutation in the intracellular domain of the metalloprotease
ADAM12. PLoS One. 2012;7:e37628.
7. Qi Y, Duhachek-Muggy S, Li H, Zolkiewska A. Phenotypic diversity of breast
cancer-related mutations in metalloproteinase-disintegrin ADAM12. PLoS
One. 2014;9:e92536.
8. Jacobsen J, Wewer UM. Targeting ADAM12 in human disease: head, body
or tail? Curr Pharm Des. 2009;15:2300–10.
9. Duhachek-Muggy S, Li H, Qi Y, Zolkiewska A. Alternative mRNA splicing
generates two distinct ADAM12 prodomain variants. PLoS One.
2013;8:e75730.
10. Prat A, Parker JS, Karginova O, Fan C, Livasy C, Herschkowitz JI, et al.
Phenotypic and molecular characterization of the claudin-low intrinsic
subtype of breast cancer. Breast Cancer Res. 2010;12:R68.
11. Harrell JC, Pfefferle AD, Zalles N, Prat A, Fan C, Khramtsov A, et al.
Endothelial-like properties of claudin-low breast cancer cells promote tumor
vascular permeability and metastasis. Clin Exp Metastasis. 2014;31:33–45.
12. Li H, Duhachek-Muggy S, Dubnicka S, Zolkiewska A. Metalloproteinasedisintegrin ADAM12 is associated with a breast tumor-initiating cell
phenotype. Breast Cancer Res Treat. 2013;139:691–703.
13. Sabatier R, Finetti P, Guille A, Adelaide J, Chaffanet M, Viens P, et al. Claudinlow breast cancers: clinical, pathological, molecular and prognostic
characterization. Mol Cancer. 2014;13:228.
14. Taube JH, Herschkowitz JI, Komurov K, Zhou AY, Gupta S, Yang J, et al. Core
epithelial-to-mesenchymal transition interactome gene-expression signature
25.
26.
27.
28.
29.
30.
31.
32.
33.
34.
35.
36.
37.
is associated with claudin-low and metaplastic breast cancer subtypes. Proc
Natl Acad Sci U S A. 2010;107:15449–54.
Gupta PB, Onder TT, Jiang G, Tao K, Kuperwasser C, Weinberg RA, et al.
Identification of selective inhibitors of cancer stem cells by high-throughput
screening. Cell. 2009;138:645–59.
Onder TT, Gupta PB, Mani SA, Yang J, Lander ES, Weinberg RA. Loss of Ecadherin promotes metastasis via multiple downstream transcriptional
pathways. Cancer Res. 2008;68:3645–54.
Scheel C, Eaton EN, Li SH, Chaffer CL, Reinhardt F, Kah KJ, et al. Paracrine
and autocrine signals induce and maintain mesenchymal and stem cell
states in the breast. Cell. 2011;145:926–40.
Dontu G, Abdallah WM, Foley JM, Jackson KW, Clarke MF, Kawamura MJ,
et al. In vitro propagation and transcriptional profiling of human mammary
stem/progenitor cells. Genes Dev. 2003;17:1253–70.
Creighton CJ, Li X, Landis M, Dixon JM, Neumeister VM, Sjolund A, et al.
Residual breast cancers after conventional therapy display mesenchymal as
well as tumor-initiating features. Proc Natl Acad Sci U S A. 2009;106:13820–5.
Miller WR, Larionov AA, Renshaw L, Anderson TJ, White S, Murray J, et al.
Changes in breast cancer transcriptional profiles after treatment with the
aromatase inhibitor, letrozole. Pharmacogenet Genomics. 2007;17:813–26.
Farmer P, Bonnefoi H, Anderle P, Cameron D, Wirapati P, Becette V, et al. A
stroma-related gene signature predicts resistance to neoadjuvant
chemotherapy in breast cancer. Nat Med. 2009;15:68–74.
Ayers M, Symmans WF, Stec J, Damokosh AI, Clark E, Hess K, et al. Gene
expression profiles predict complete pathologic response to neoadjuvant
paclitaxel and fluorouracil, doxorubicin, and cyclophosphamide
chemotherapy in breast cancer. J Clin Oncol. 2004;22:2284–93.
Popovici V, Chen W, Gallas BG, Hatzis C, Shi W, Samuelson FW, et al. Effect
of training-sample size and classification difficulty on the accuracy of
genomic predictors. Breast Cancer Res. 2010;12:R5.
Wang Y, Klijn JG, Zhang Y, Sieuwerts AM, Look MP, Yang F, et al. Geneexpression profiles to predict distant metastasis of lymph-node-negative
primary breast cancer. Lancet. 2005;365:671–9.
Minn AJ, Gupta GP, Padua D, Bos P, Nguyen DX, Nuyten D, et al. Lung
metastasis genes couple breast tumor size and metastatic spread. Proc Natl
Acad Sci U S A. 2007;104:6740–5.
Desmedt C, Piette F, Loi S, Wang Y, Lallemand F, Haibe-Kains B, et al. Strong
time dependence of the 76-gene prognostic signature for node-negative
breast cancer patients in the TRANSBIG multicenter independent validation
series. Clin Cancer Res. 2007;13:3207–14.
Li H, Duhachek-Muggy S, Qi Y, Hong Y, Behbod F, Zolkiewska A. An essential
role of metalloprotease-disintegrin ADAM12 in triple-negative breast cancer.
Breast Cancer Res Treat. 2012;135:759–69.
Schwarzenbacher D, Balic M, Pichler M. The role of microRNAs in breast
cancer stem cells. Int J Mol Sci. 2013;14:14712–23.
D’Amato NC, Howe EN, Richer JK. MicroRNA regulation of epithelial
plasticity in cancer. Cancer Lett. 2013;341:46–55.
Shimono Y, Zabala M, Cho RW, Lobo N, Dalerba P, Qian D, et al.
Downregulation of miRNA-200c links breast cancer stem cells with normal
stem cells. Cell. 2009;138:592–603.
Gregory PA, Bert AG, Paterson EL, Barry SC, Tsykin A, Farshid G, et al. The
miR-200 family and miR-205 regulate epithelial to mesenchymal transition
by targeting ZEB1 and SIP1. Nat Cell Biol. 2008;10:593–601.
Gregory PA, Bracken CP, Smith E, Bert AG, Wright JA, Roslan S, et al. An
autocrine TGF-beta/ZEB/miR-200 signaling network regulates establishment
and maintenance of epithelial-mesenchymal transition. Mol Biol Cell.
2011;22:1686–98.
Wright JA, Richer JK, Goodall GJ. microRNAs and EMT in mammary cells and
breast cancer. J Mammary Gland Biol Neoplasia. 2010;15:213–23.
Chou J, Lin JH, Brenot A, Kim JW, Provot S, Werb Z. GATA3 suppresses
metastasis and modulates the tumour microenvironment by regulating
microRNA-29b expression. Nat Cell Biol. 2013;15:201–13.
Cittelly DM, Finlay-Schultz J, Howe EN, Spoelstra NS, Axlund SD, Hendricks P,
et al. Progestin suppression of miR-29 potentiates dedifferentiation of breast
cancer cells via KLF4. Oncogene. 2013;32:2555–64.
Yu F, Deng H, Yao H, Liu Q, Su F, Song E. Mir-30 reduction maintains selfrenewal and inhibits apoptosis in breast tumor-initiating cells. Oncogene.
2010;29:4194–204.
Ouzounova M, Vuong T, Ancey PB, Ferrand M, Durand G, Le-Calvez Kelm F,
et al. MicroRNA miR-30 family regulates non-attachment growth of breast
cancer cells. BMC Genomics. 2013;14:139.
Duhachek-Muggy and Zolkiewska BMC Cancer (2015) 15:93
Page 13 of 13
38. Riaz M, van Jaarsveld MT, Hollestelle A, der Smissen WJ P-v, Heine AA,
Boersma AW, et al. miRNA expression profiling of 51 human breast cancer
cell lines reveals subtype and driver mutation-specific miRNAs. Breast Cancer
Res. 2013;15:R33.
39. Prat A, Karginova O, Parker JS, Fan C, He X, Bixby L, et al. Characterization of
cell lines derived from breast cancers and normal mammary tissues for the
study of the intrinsic molecular subtypes. Breast Cancer Res Treat.
2013;142:237–55.
40. Neve RM, Chin K, Fridlyand J, Yeh J, Baehner FL, Fevr T, et al. A collection of
breast cancer cell lines for the study of functionally distinct cancer subtypes.
Cancer Cell. 2006;10:515–27.
41. Nygren MK, Tekle C, Ingebrigtsen VA, Makela R, Krohn M, Aure MR, et al.
Identifying microRNAs regulating B7-H3 in breast cancer: the clinical impact
of microRNA-29c. Br J Cancer. 2014;110:2072–80.
42. Iorio MV, Ferracin M, Liu CG, Veronese A, Spizzo R, Sabbioni S, et al.
MicroRNA gene expression deregulation in human breast cancer. Cancer
Res. 2005;65:7065–70.
43. Fabian MR, Sonenberg N, Filipowicz W. Regulation of mRNA translation and
stability by microRNAs. Annu Rev Biochem. 2010;79:351–79.
44. Enerly E, Steinfeld I, Kleivi K, Leivonen SK, Aure MR, Russnes HG, et al.
miRNA-mRNA integrated analysis reveals roles for miRNAs in primary breast
tumors. PLoS One. 2011;6:e16915.
45. Li H, Solomon E, Duhachek Muggy S, Sun D, Zolkiewska A. Metalloproteasedisintegrin ADAM12 expression is regulated by Notch signaling via
microRNA-29. J Biol Chem. 2011;286:21500–10.
46. Ramdas V, McBride M, Denby L, Baker AH. Canonical transforming growth
factor-beta signaling regulates disintegrin metalloprotease expression in
experimental renal fibrosis via miR-29. Am J Pathol. 2013;183:1885–96.
47. Luna C, Li G, Qiu J, Epstein DL, Gonzalez P. Role of miR-29b on the
regulation of the extracellular matrix in human trabecular meshwork cells
under chronic oxidative stress. Mol Vis. 2009;15:2488–97.
Submit your next manuscript to BioMed Central
and take full advantage of:
• Convenient online submission
• Thorough peer review
• No space constraints or color figure charges
• Immediate publication on acceptance
• Inclusion in PubMed, CAS, Scopus and Google Scholar
• Research which is freely available for redistribution
Submit your manuscript at
www.biomedcentral.com/submit