International trends in primary liver cancer incidence from 1973 to 2007
Bạn đang xem bản rút gọn của tài liệu. Xem và tải ngay bản đầy đủ của tài liệu tại đây (865.3 KB, 11 trang )
Zhang et al. BMC Cancer (2015) 15:94
DOI 10.1186/s12885-015-1113-4
RESEARCH ARTICLE
Open Access
International trends in primary liver cancer
incidence from 1973 to 2007
Yue Zhang1, Jian-Song Ren1, Ju-Fang Shi1, Ni Li1, Yu-Ting Wang2, Chunfeng Qu2, Yawei Zhang1,3 and Min Dai1*
Abstract
Background: Primary liver cancer (PLC) is a common cancer worldwide, especially in developing countries. Several
previous studies using different datasets have summarized PLC incidence rates and trends in different populations.
However, with changes in exposure to risk factors and the implementation of preventive measures, the
epidemiology of PLC worldwide may have changed.
Methods: We extended the analyses using the latest data from Cancer Incidence in Five Continents over the
35-year period 1973–2007 from 24 populations in Americas, Asia, Europe and Oceania using Joinpoint regression
analysis. We examined age-standardized rates (ASRs) of PLC by histologic subtypes for both males and females in
24 populations during the period 2003–2007.
Results: We found that during the period 2003–2007, the highest ASRs for PLC were observed in some Asian
populations, ranging from 19.0 to 26.7 per 100,000 in males and 4.8 to 8.7 per 100,000 in females. The international
trends between 1973 and 2007 showed that ASRs for PLC were declining in several Asian populations. In contrast,
ASRs for PLC were increasing in some European, American and Oceanian populations.
Conclusions: Although the reasons were not fully clear for these trends, public health measures in Asian
populations and HCV transmission in European, American and Oceanian populations were likely to have
contributed to these patterns. Meanwhile, other possible risk factors such as the consumption of alcohol, obesity,
and nonalcoholic fatty liver disease should also be concerned for the burden of PLC.
Keywords: Liver neoplasms, Incidence, International trends, HBV, HCV
Background
It was estimated that for the year 2012, primary liver
cancer (PLC) incidence rates ranked fifth in men and
ninth in women worldwide [1]. The number of incident
cases of PLC was estimated to be 782,000 per year,
including 554,000 in men and 228,000 in women [1].
PLC mortality rates ranked the second in both sexes in
the world [1]. Five-year relative survival rate for USA
tends to be 16.6% based on data from the Surveillance,
Epidemiology, and End Results (SEER) (2004–2010)
Program of the US National Cancer Institute [2]. In
China, the age-standardized 5-year relative survival rate
for liver cancer was 10.1% [3]. PLC is the major type of
liver cancer, which is composed of several histologic
* Correspondence:
1
National Office for Cancer Prevention and Control, Cancer Institute &
Hospital, Chinese Academy of Medical Sciences/Peking Union Medical
College, Beijing 100021, China
Full list of author information is available at the end of the article
subtypes, including hepatocellular carcinoma (HCC),
cholangiocarcinoma (CC), and combined hepatocellular
carcinoma and cholangiocarcinoma (cHCC-CC) [4].
Most of the PLC cases (85%) are diagnosed in developing countries. The highest incidence rates have been
reported in the regions of Southeast Asia and subSaharan Africa [5]. In these high-incidence populations,
except for Japan, chronic infection with hepatitis B virus
(HBV) and aflatoxin exposure were recognized as major
risk factors for PLC. In low-incidence populations, however, PLC was mainly associated to the chronic hepatitis
C virus (HCV) infection. It was estimated that most
HCC cases (approximately 80%) were associated with
HBV and/or HCV infections [6]. Moreover, some recent
studies indicated that alcohol-related liver diseases,
smoking, immigration, and obesity were also possible
risk factors linking to PLC [7-9].
© 2015 Zhang et al.; licensee BioMed Central. This is an Open Access article distributed under the terms of the Creative
Commons Attribution License ( which permits unrestricted use, distribution, and
reproduction in any medium, provided the original work is properly credited. The Creative Commons Public Domain
Dedication waiver ( applies to the data made available in this article,
unless otherwise stated.
Zhang et al. BMC Cancer (2015) 15:94
Several previous studies [10-12] using different datasets had reported the international trends in PLC
incidence rates, one of which [12] reported the global
PLC incidence rates and trends for 1993–2002 (10-year
period). However, with changes in exposure to risk
factors and the implementation of protective measures,
the epidemiology of PLC worldwide may have changed.
To give a longer-term and more recent comprehensive
picture on the current status of PLC worldwide, we
extended the analyses for the 35-year period from 1973
to 2007 from 24 populations in Americas, Asia, Europe
and Oceania. This data may provide more useful evidence for evaluating the effect of previous measures of
PLC prevention and control, and may facilitate the
development of future measures.
Methods
Incidence data
To examine the changing trends in the incidence of PLC
over time, age-standardized (by Segi’s world standard
population [13]) incidence rates (ASRs) by sex were
obtained from Volumes 4–10 of Cancer Incidence in
Five Continents (CI5) from the website of the International Agency for Research on Cancer (IARC) [14-20]
in which all data is publicly available. Volumes 4–10 of
CI5 generally provided data by 5-year periods: 1973–
1977, 1978–1982, 1983–1987, 1988–1992, 1993–1997,
1998–2002 and 2003–2007. Incidence data from 2003 to
2007 by histologic subtypes (HCC, CC, other & unspecified carcinoma) were collected from 24 populations in
four continents from Vol. 10 of CI5. Classification of
PLC from Vols. 4, 5–8 and 9–10 of CI5 was coded according to the International Classification of Diseases
(ICD) 8th (155), 9th (155) and 10th (C22) revisions,
respectively.
Populations were chosen for inclusion in our study on
the basis of the following criteria: (1) incidence for time
periods at least as far back as 1983–1987; (2) an absence
of changes in population coverage or of warnings
regarding data quality reported in CI5 Vols. 4–10; and
(3) a sufficiently large number of registered cases in CI5
Vol. 10 to enable analyses of recent rates by histologic
subtypes (trends by histologic subtypes were not included
in our study). Only one registry from each country was
selected; if more than one registry met the basic criteria,
the registry with the largest population was included
in the analysis (expect for China which included
Hong Kong and Shanghai). Twenty four populations
were selected: four from the Americas (Canada, British
Columbia [BC]; Colombia, Cali; USA, SEER: (9 registries:
California: San Francisco; Connecticut; Georgia: Atlanta;
Hawaii; Iowa; Michigan: Detroit; New Mexico; Utah;
Washington: Seattle) Black/White), six from Asia (China,
Hong Kong; China, Shanghai; India, Mumbai; Israel: Jews;
Page 2 of 11
Japan, Osaka Prefecture; Singapore: Chinese), five from
Northern Europe (Denmark; Finland; Norway; Sweden;
UK, England, North Western Region [NWR]), three from
Western Europe (France, Bas-Rhin; Germany, Saarland;
Switzerland, Geneva), four from elsewhere in Europe
[21] (Southern and Central & Eastern Europe including
Italy, Varese Province; Poland, Cracow; Slovakia; Spain,
Navarra), and two from Oceania (Australia, New South
Wales [NSW]; New Zealand). No African populations
met all the inclusion criteria. However, four African
populations (Algeria, Setif Wilaya; Egypt, Gharbiah;
Uganda, Kyadondo; Zimbabwe, Harare: African) were
chosen to describe the PLC incidence rates in the last
time interval (2003–2007).
Incidence data for white and black populations in US
were not included in CI5 vol. four (1973–1977) and vol.
five (1978–1982), so we further referred to the US SEER
dataset [22]. The SEER program is a population-based
cancer registry system covering 18 registries and 28%
of the US population. Long-term data from 1973 to
2010 were available from nine registries that included
approximately 9.4% of the US population (based on
2010 census).
For New Zealand, we abstracted the data for 1983–1987
and 1988–2002 from CI5plus [23] which was part of CI5
databases and contained annual incidence data for a single
registry or a group of populations in one country. The
data for the last time period 2003–2007 were obtained
from CI5 vol. 10.
Data analysis
Incidence trends in ASRs of PLC were analyzed using
Joinpoint regression (Joinpoint regression software, Version
3.5.3-May 2012, available through the Surveillance Research
Program of the US National Cancer Institute). The permutation method was used for significance tests. Changes in
annual incidence rates from PLC were calculated as annual
percentage change (APC) in each segment. In the final
model, the Joinpoint analysis provided average annual
percentage change (AAPC). The significant test of APC
and AAPC to 0 was also conducted.
Age-standardized incidence rates of PLC by histologic
subtypes (HCC, CC and other & unspecified carcinoma)
and sex for selected populations during the period
2003–2007 were integrated and calculated. Secular trends
in ASRs were examined by registry and sex for every fiveyear period during 1973–2007. PLC trends from New
Zealand were described during five-year periods from
1983–1987 to 2003–2007. Figures displaying the incidence
trends were prepared using a semi-log scale to facilitate
the comparison of temporal trends as well as magnitude.
These data were plotted at the midpoint of each five-year
interval.
Zhang et al. BMC Cancer (2015) 15:94
Results
ASRs for PLC in 2003–2007 were highest in some populations of Asia (China, Hong Kong; Japan; China,
Shanghai; Singapore: Chinese) and Africa (Egypt and
Zimbabwe), and much lower in most populations in
Europe, Americas and Oceania (Tables 1 and 2). In
Asian populations, ASRs for PLC were ranging from
19.0 to 26.7 per 100,000 in males and 4.8 to 8.7 per
100,000 in females, except for India and Israel (Jews)
(5.2 and 3.1 per 100,000 in males, 2.4 and 1.4 per
100,000 in females, respectively). In most populations
in Americas, Europe and Oceania, PLC incidence rates
varied between 2.2-7.8 per 100,000 for males and 1.0-3.7
per 100,000 for females except for France (13.6 per
100,000 for males and 2.5 per 100,000 for females),
Switzerland (13.1 per 100,000 for males and 3.0 per
100,000 for females), Italy (12.6 per 100,000 for males and
3.7 per 100,000 for females), and USA, Black population
(11.6 per 100,000 for males and 3.1 per 100,000 for
females).
Tables 1 and 2 also showed the results of Joinpoint
analysis for ASRs in males and females for all ages,
respectively. The secular trends in PLC incidence among
24 populations from 1973 to 2007 were presented in
Figure 1. The increasing trends for both males and
females in PLC incidence rates were seen in most of
the populations in Europe, Americas, and Oceania. UK,
England, France, Germany, Switzerland, Italy, Canada,
Colombia, USA: Black, USA: White, Australia, and New
Zealand (1982–2007) showed a significant increasing
trend across all the periods (Tables 1 and 2 and Figure 1).
In males, ASRs for PLC in Germany, USA, Black, and
USA, White increased significantly from the period
1982–1987 (Table 1 and Figure 1A). PLC incidence rates
in France, Canada and Australia significantly increased
from 1973–1977, leveled off in the 1990s (Table 1 and
Figure 1A). ASRs for PLC in Spain significantly increased
by 28.9% per year from 1973–1977, significantly decreased
by 1.8% per year from 1982–1987, whereas ASRs for PLC
in Finland, Norway, Sweden, Poland and Slovakia leveled
off in all the period (Table 1 and Figure 1A). In females,
the pattern of PLC incidence in each population seemed
to be similar except for Denmark, Poland and Spain
(Table 2 and Figure 1B). ASRs for PLC in Poland significantly decreased by 3.1% per year from 1973–1977 to
2003–2007, whereas ASRs for PLC in Denmark and Spain
showed stable trends from 1973–1977 to 2003–2007.
However, in Asia, ASRs for PLC for both males and
females showed significant decreasing trends in two of
the six populations (China, Shanghai; Singapore: Chinese)
from 1973–1977 to 2003–2007 (Tables 1 and 2 and
Figure 1A and B). The stable trends among males and
females were seen in two of the six populations (China,
Hong Kong and Israel: Jews) from 1973–2007 to 2003–
Page 3 of 11
2007. ASRs for PLC in one of the six populations
(Japan) significantly increased by 23.0% in males and
23.5% in females from 1973–1977 and reached a plateau in 1990s (Tables 1 and 2 and Figure 1A and B).
Whereas ASRs for PLC for females in India significantly increased by 5.3% from 1973–1977 and leveled
off in 1980s (Table 2 and Figure 1B).
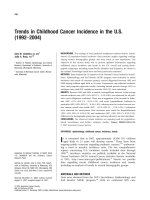
According to the ASRs of PLC by histologic subtypes
from 2003 to 2007, HCC was the leading histologic
subtype, followed by CC and other & unspecified carcinoma (Figure 2). The highest incidence rate of HCC was
observed in China, Hong Kong (8.5 per 100,000 in males
and 1.9 per 100,000 in females), and the lowest one was
shown in UK England (0.9 per 100,000 in males and 0.3
per 100,000 in females). The highest incidence of CC
was seen in France (2.0 per 100,000 in males and 0.7 per
100,000 in females), followed by other European countries including Spain (1.1 per 100,000 in males and 0.6
per 100,000 in females), Finland (1.0 per 100,000 in
males and 0.7 per 100,000 in females), and Italy (1.0 per
100,000 in males and 0.6 per 100,000 in females). China,
Hong Kong (0.9 per 100,000 in males and 0.7 per
100,000 in females) and Japan (0.9 per 100,000 in males
and 0.5 per 100,000 in females) had relatively higher
incidence of CC than other Asian countries.
Discussion
International trends in PLC incidence rates during the
period 1973–2007 showed that the PLC incidence rates
increased in most European, American and Oceanian
populations, although these age-standardized PLC incidence rates in 2003–2007 were much lower than these in
Asia. Meanwhile, PLC incidence rates decreased in Asian
populations, although their age-standardized PLC incidence rates in 2003–2007 were the highest in the world.
PLC is a common cancer, particularly in Asia countries
such as China, Japan and Singapore (Chinese). Among
these countries, PLC is closely associated with hepatitis
virus infection (HBV infection in China and Singapore,
HCV infection in Japan) and exposure to aflatoxin (in
China). In our study, the decreasing trends in China and
Singapore may be attributed to some public health measures [24-27]. HBV vaccination was incorporated into
the national childhood immunization program by China
and Singapore from the middle 1980s to the early 1990s.
The immunization coverage with three doses of HBV
vaccine was 70.7%-95.0% in 1999 [28,29]. Several studies
also reported the decreases in PLC incidence rates in
China, particularly in Shanghai and in younger age groups
[24,30]. Another study in Taiwan showed that the ageand sex- adjusted rate ratios for individuals aged 5 to
29 years decreased by more than 80% for HCC incidence
from 1977–1980 to 2001–2004 [25]. In Singapore, Chia
et al. [26] suggested that a general declining trend in liver
Populations
Period of registry
established
Mean
of MV%1
1973-1977
2003-2007
2
Joinpoint analyses (1973-2007)
2
Cases
Rate
Cases
Rate
Trend 1 Period
Trend 2 APC3 (%)
424
2.9
947
4.1
1975-2005
0.8#
0.8#
3.2
1,192
5.2
1975-2005
1.2
1.2
Period
APC3 (%)
AAPC4 (%)
Northern Europe
Denmark
1953-1957
88.0
Finland
1959-1961
88.3
Norway
1959-1961
85.7
230
1.6
421
2.2
1975-2005
0.8
0.8
Sweden
1959-1961
95.7
1,162
3.4
1,465
3.4
1975-2005
-0.7
-0.7
(1973-1976)
473
(1971-1976)
Zhang et al. BMC Cancer (2015) 15:94
Table 1 International variation in primary liver cancer incidence rates for males, from 1973–1977 to 2003-2007
(1971-1975)
UK, England, NWR
1973-1977
44.7
157
1.1
1,250
4.4
1975-1985
6.0#
1985-2005
3.9#
4.6#
1975-1977
64.1
76
4.9
547
13.6
1975-1990
6.4#
1990-2005
0.5
3.4#
2.4
394
7.5
1975-1985
4.6
1985-2005
3.6#
3.9#
Western Europe
France, Bas-Rhin
(1975-1977)
Germany, Saarland
1968-1972
a
64.5
86
1970-1972
70.3
100
9.7
214
13.1
1975-2005
0.9
0.9#
Italy, Varese Province
1976-1977
55.5
64
6.9
516
12.6
1975-2005
2.6#
2.6#
Poland, Cracow
1965-1966
42.3
89
5.9
103
4.8
1975-2005
-1.5
-1.5
Slovakia
1973-1977
55.1
183
3.1
1,052
6.4
1975-2005
2.6
Switzerland, Geneva
#
Europe, Other
(1976-1977)
(2003-2006)
Spain, Navarra
2.6
#
#
1973-1977
51.2
8
0.5
217
7.8
1975-1985
28.9
1985-2005
-1.8
7.5#
1969-1972
56.5
142
2.0
201
5.2
1975-1995
3.7#
1995-2005
2.3
3.3#
#
Americas
Canada, BC
Colombia, Cali
1967-1971
71.8
USA, SEER: Black
1973-1975
78.0b
USA, SEER: White
1973-1975
1973-1977
22
2.1#
1.9
178
4.2
1975-2005
2.1
154c
4.4
936
11.6
1975-1985
1.2
1985-2005
4.1#
3.1#
74.7b
1,009c
2.1
4,443
5.9
1975-1985
1.4
1985-2005
4.6#
3.5#
73.8
139
1.1
1,379
5.4
1975-1995
6.5#
1995-2005
4.4
5.8#
1985-2005
#
(1972-1976)
Oceania
New Zealand
1962-1966
d
61.1
-
-
738
5.2
3.3
3.3#
Page 4 of 11
Australia, NSW
Asia
China, Hong Kong
1974-1977
46.8
2,515
34.4
6,503
26.7
1975-2005
-0.8
-0.8
31.7
6,128
21.7
1975-2005
-1.4#
-1.4#
2.7
1,195
5.2
1975-2005
1.4
1.4
2.9
559
3.1
1975-2005
0.1
0.1
5.6
11,922
25.6
1975-1985
23.0#
#
(1974-1977)
China, Shanghai
1975
14.2
949
(1975)
India, Mumbai
1964-1966
60.3
145
(1973-1975)
Israel: Jews
1960-1966
65.7
226
Zhang et al. BMC Cancer (2015) 15:94
Table 1 International variation in primary liver cancer incidence rates for males, from 1973–1977 to 2003-2007 (Continued)
(1972-1976)
Japan, Osaka Prefecture
Singapore: Chinese
1966-1966
43.2
935
1968-1972
32.3
843
32.2
1,451
19.0
1975-2005
-1.8
1986-1989
9.8
-
-
48
1.9
-
-
1985-2005
-3.4
4.7#
-1.8#
Africa
Algeria, Setif Wilaya
-
-
-
Egypt, Gharbiah
2003-2007
24.7
-
-
1,806
24.8
-
-
-
-
-
Uganda, Kyadondo
2003-2007
29.9
-
-
177
11.4
-
-
-
-
-
Zimbabwe, Harare: African
2003-2006
12.1
-
-
199
16.7
-
-
-
-
-
(2003-2006)
1
Mean of MV% (Percentage of morphologically verified cases) was calculated from 1978 to 2007. 2Rate is age-standardized to the world population, per 100,000 person-years. 3APC, Annual Percent Change.4AAPC,
Average Annual Percent Change. #APC/AAPC is significantly different from 0 (two-side p<0.05).
a
Germany, Saarland (1983-2007); bUSA, SEER: Black/White (1988-2007); cThe data of USA, SEER: Black/White were from SEER 9 registries database. dNew Zealand (1993-2007).
Page 5 of 11
Populations
Period of registry
established
Mean
of MV%1
1973-1977
2003-2007
2
Joinpoint analyses (1973-2007)
2
Cases
Rate
Cases
Rate
Trend 1 Period
Trend 2 APC3 (%)
308
1.6
434
1.6
1975-2005
-0.4
-0.4
1.7
701
2.1
1975-2005
0.1
0.1
Period
APC3 (%)
AAPC4 (%)
Northern Europe
Denmark
1953-1957
82.8
Finland
1959-1961
82.1
Norway
1959-1961
78.2
117
0.6
240
1.0
1975-2005
1.0
1.0
Sweden
1959-1961
94.3
754
1.8
859
1.7
1975-2005
-1.1
-1.1
(1973-1976)
391
(1971-1976)
Zhang et al. BMC Cancer (2015) 15:94
Table 2 International variation in primary liver cancer incidence rates for females, from 1973–1977 to 2003-2007
(1971-1975)
UK, England, NWR
1973-1977
38.4
75
0.4
863
2.3
1975-2005
5.3#
5.3#
1975-1977
56.4
18
0.7
133
2.5
1975-2005
3.9#
3.9#
1.5
207
2.9
1975-2005
2.0#
2.0#
#
Western Europe
France, Bas-Rhin
(1975-1977)
Germany, Saarland
1968-1972
a
54.4
77
1970-1972
66.9
23
1.3
66
3.0
1975-2005
2.4
2.4#
Italy, Varese Province
1976-1977
48.9
37
2.7
224
3.7
1975-2005
1.0#
1.0#
Poland, Cracow
1965-1966
32.2
116
4.3
70
2.4
1975-2005
-3.1#
-3.1#
Slovakia
1973-1977
52.2
190
2.6
619
2.4
1975-2005
0.6
0.6
Spain, Navarra
1973-1977
38.1
11
0.6
89
2.2
1975-2005
1.4
1.4
1969-1972
52.6
87
1.1
97
1.7
1975-2005
1.2#
Switzerland, Geneva
Europe, Other
(1976-1977)
(2003-2006)
Americas
Canada, BC
1.2#
1.5
182
3.2
1975-1985
1.6
1985-2005
3.4
2.8#
68c
1.5
336
3.1
1975-1985
0.7
1985-2005
3.2#
2.4#
71.0b
613c
1.0
1,762
1.9
1975-1985
0.7
1985-2005
3.0#
2.2#
71.7
56
0.4
634
1.9
1975-1990
3.6
1990-2005
7.7#
5.6#
Colombia, Cali
1967-1971
72.5
USA, SEER: Black
1973-1975
72.1b
USA, SEER: White
1973-1975
1973-1977
19
#
(1972-1976)
Oceania
New Zealand
1962-1966
d
55.2
-
-
328
1.9
1985-2005
#
2.8
2.8#
Page 6 of 11
Australia, NSW
Asia
China, Hong Kong
1974-1977
44.0
741
8.9
2,001
6.9
1975-2005
-0.6
-0.6
9.1
2,419
7.1
1975-1985
1.5
1985-2005
-2.2#
-1.0#
1.0
567
2.4
1975-1985
5.3#
1985-2005
0.4
2.0#
1.3
341
1.4
1975-2005
0.1
1.2
5,689
8.7
1975-1985
23.5#
(1974-1977)
China, Shanghai
1975
13.1
278
(1975)
India, Mumbai
1964-1966
54.3
43
(1973-1975)
Israel: Jews
1960-1966
55.9
102
0.1
Zhang et al. BMC Cancer (2015) 15:94
Table 2 International variation in primary liver cancer incidence rates for females, from 1973–1977 to 2003-2007 (Continued)
(1972-1976)
Japan, Osaka Prefecture
Singapore: Chinese
1966-1966
39.3
249
1985-2005
-1.6
#
6.2#
1968-1972
30.1
231
7.1
471
4.8
1975-1985
-0.8
1985-2005
-1.9
-1.5#
1986-1989
92.5
-
-
40
1.6
-
-
-
-
-
Africa
Algeria, Setif Wilaya
Egypt, Gharbiah
2003-2007
24.2
-
-
433
6.2
-
-
-
-
-
Uganda, Kyadondo
2003-2007
29.0
-
-
131
8.7
-
-
-
-
-
Zimbabwe, Harare: African
2003-2006
13.9
-
-
101
13.9
-
-
-
-
-
(2003-2006)
1
Mean of MV% (Percentage of morphologically verified cases) was calculated from 1978 to 2007. 2Rate is age-standardized to the world population, per 100,000 person-years. 3APC, Annual Percent Change.4AAPC,
Average Annual Percent Change. #APC/AAPC is significantly different from 0 (two-side p<0.05).
a
Germany, Saarland (1983-2007); bUSA, SEER: Black/White (1988-2007); cThe data of USA, SEER: Black/White were from SEER 9 registries database. dNew Zealand (1993-2007).
Page 7 of 11
Zhang et al. BMC Cancer (2015) 15:94
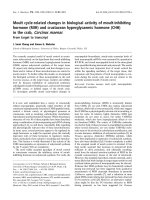
Page 8 of 11
Figure 1 Trends in age-standardized primary liver cancer incidence rates by continent and area for the time period 1973–2007: A.
Males B. Females.
cancer incidence was especially notable in local-born
Chinese. Although the measure had no an effect on
general population, we expect it will play an important
role in the reduction of PLC incidence rates in the
coming decades. Moreover, dietary aflatoxin exposure
declined in the high-incidence areas of PLC seemed to
have contributed to the decrease in PLC incidence in
China [31]. A study in Qidong, China [31], where aflatoxin exposures were common, had reported that the
decreasing liver cancer incidence in population over
25 years could mainly be attributable to the reduction
of exposure to aflatoxin from 1980 to 2008.
In Japan, there were different trends between 1973–
1992 and 1988–2007. The increasing trends started in
1973–1977 and reached peak in 1988–1992. This was
thought to be in part due to the spread of HCV infection, which began in the 1920s and increase after World
War II with an explosion in parenteral amphetamine use
and paid blood donation [32,33]. Although APC did not
significantly decrease during 1988–2007, the decline in
PLC incidence had been continuously seen from 1988–
1992 in our analysis. Stiffening of legal penalties against
amphetamine use starting in 1954 and conversion from
paid to voluntary blood donation in late 1960s might
have reduced HCV transmission [34]. After the discovery of HCV RNA, HCV screening tests for first- and
second-generation HCV antibodies started in 1989 and
1992, respectively [35]. These tests were adopted by the
Red Cross Blood Center for screening blood, which further decreased the risk of post-transfusion hepatitis. The
Japanese government has taken urgent comprehensive
countermeasures against hepatitis (HBV and HCV) and
HCC since 2002 [33]. Therefore, these measures would
provide a significant contribution to decrease the number of patients suffering from HCV-related liver diseases
including PLC.
In contrast, PLC was not a very common cancer in
European, American and Oceanian countries where there
were no epidemic regions of HBV infection. However, an
increasing trend of PLC incidence rates was seen in most
of these populations which were partly due to the widespread HCV infection associated with drug use, exposure
to contaminated blood transfusion and/or needles used
for medical purposes [36]. The natural history of PLC
indicated that the time between exposure to HCV and
development of HCC is about 30 years [37]. HCV infections were found in 30-50% of HCC patients in the United
States and 44-66% of HCC patients in Italy [38]. Both of
Zhang et al. BMC Cancer (2015) 15:94
Page 9 of 11
Figure 2 Age-standardized primary liver cancer incidence rates by histologic subtypes for selected populations for the time period
2003–2007.
these countries had the highest PLC incidence rates in
their own continent. The different peak years of HCV
infection prevalence for each country were likely responsible for the respective peaks in PLC incidence rates. The
increasing trends in PLC incidence rates in the United
States could be attributed to increased HCV exposures by
contact with contaminated blood and injection drug use
during the 1960s and 1970s [39]. In Italy, the upsurge of
liver cancer incidence after 1970s was in part attributable
to HCV infection caused by the re-use of disposable
syringes among intravenous drug users without proper
disinfection [40]. Meanwhile, in several studies conducted
in Western countries, 30 to 40% of patients with HCC did
not have chronic infection with HBV or HCV, suggesting
alternative causes [5]. Other factors including alcohol
[41,42], obesity [43,44], and non-alcoholic fatty liver disease (NAFLD) [5] might be contributed to the increasing
trend. In population-based cohort studies in the United
States and Scandinavia [44-46], HCC was 1.5 to 2.0 times
as likely to develop in obese persons as in those who were
not obese. NAFLD, which is present in up to 90% of all
obese persons and up to 70% of persons with type 2
diabetes, has been proposed as a possible risk factor for
HCC [47]. Although there were still some difficult
problems in the latency period from exposure to these
factors and PLC development, more emphasis should
be recommended to control these factors.
The advent of precise diagnostic tests may increase
recognition of the disease, which accounts for a rising
incidence, rather than a true increase in its occurrence
[48]. Ultrasonography, measurement of serum alphafetoprotein, and computed tomography scanning have
been routinely used since the early 1980s, which should
lead to an increase in the number of hepatic biopsies
conducted. However, the percentage of histologically
confirmed PLC has not increased significantly during the
study period in these countries which had an increasing
trend in PLC incidence rates. In addition, females in
Zhang et al. BMC Cancer (2015) 15:94
Poland (from 1973–1977 to 2003–2007) and males in
Spain (from 1982–1987 to 2003–2007) also exhibited a
decreasing trend of PLC incidence rates. The reasons for
this decreasing trend remain unclear.
This study has several strengths. The data were abstracted from large, well-established registries throughout
the world. For the first time, data covering 35 years were
analyzed to describe the variation of international trends
in PLC incidence rates, which may stimulate further etiologic research. In addition, incidence rates for particular
histologic subtypes of PLC in different populations were
examined separately. One limitation of this study was that
trends by histologic subtypes were not examined. The
variation of ICD coding might influence the interpretation
of our results. In our study, ICD coding contained ICD-8
(Malignant neoplasm of liver and intrahepatic bile ducts,
specified as primary), ICD-9 (Malignant neoplasm of liver,
specified as primary) and ICD-10 (Malignant neoplasm of
liver and intrahepatic bile ducts, specified as primary). CC
was not included in ICD-9 (period from 1978–1982 to
1993–1997). Therefore, the changes in PLC rates mainly
reflect changes of HCC. Our study was also limited by the
lack of nationwide cancer registries in some countries,
thus registration data might not accurately reflect the true
patterns in the respective countries.
Page 10 of 11
change; AAPC: Average annual percentage change; HBsAg: Hepatitis B surface
antigen; NAFLD: Nonalcoholic fatty liver disease.
Competing interests
The authors declare that they have no competing interests.
Authors’ contributions
YZ participated in acquisition of data, analysis and interpretation of data and
drafted the manuscript. JSR participated in acquisition of data, analysis and
interpretation of data and revised the manuscript. MD participated in the design
of study, acquisition of data, analysis and interpretation of data and revised the
manuscript. JFS, NL, YTW, CFQ and YWZ gave some substantial comments to
draft the manuscript. All authors read and approved the final manuscript.
Acknowledgements
We are very grateful to Rong-Shou Zheng and Si-Wei Zhang from National Office
for Cancer Prevention and Control, Cancer Institute & Hospital, Chinese Academy
of Medical Sciences for providing us with valuable opinions and suggestions for
data collection. We sincerely thank Ms. Catherine Lerro (Yale School of Public
Health) for language proof reading. This study was funded by the State Key
Projects Specialized for Infectious Diseases (No. 2008ZX10002008-001) and the
Research Special Fund for Public Welfare Industry of Health (No. 201402003).
The grant sponsors had no role in the study design, data collection, data
analysis, data interpretation, or the writing of the manuscript.
Author details
1
National Office for Cancer Prevention and Control, Cancer Institute &
Hospital, Chinese Academy of Medical Sciences/Peking Union Medical
College, Beijing 100021, China. 2State Key Laboratory of Molecular Oncology,
Cancer Institute & Hospital, Chinese Academy of Medical Sciences, Beijing
100021, China. 3Yale School of Public Health, Yale School of Medicine, Yale
Cancer Center, New Haven, CT 06510, USA.
Received: 14 May 2014 Accepted: 23 February 2015
Conclusions
Our analysis on CI5 data suggested that ASRs for PLC
were declining in several Asian countries where the
highest incidence rates were still seen between 1973 to
1977 and 2003 to 2007. On the contrary, ASRs for PLC
were increasing in some American, European and Oceanian
countries. HBV vaccination programs and screening tests
might play an important role in deceasing trends in Asia.
Although the reasons of the increasing trends in American,
European and Oceanian populations were not fully clear,
the variation was likely to be due to in part the increasing
prevalence of HCV infection. While a vaccine for HBV is
widely available in most developed and developing countries, there is currently no vaccine available for HCV.
Therefore, it is a critical for HCV infection prevention that
blood donations are screened, safe injection practices are
used at all times, and unnecessary injections are avoided.
Additionally, controlling other risk factors such as alcohol
consumption, obesity, and NAFLD may help to reduce
PLC incidence rates.
Abbreviations
PLC: Primary liver cancer; SEER: Surveillance, Epidemiology, and End Results;
HCC: Hepatocellular carcinoma; CC: Cholangiocarcinoma; cHCC-CC: Combined
hepatocellular carcinoma and cholangiocarcinoma; ASRs: Age-standardized
incidence rates; HBV: Hepatitis B virus; HCV: Hepatitis C virus; CI5: Cancer
Incidence in Five Continents; IARC: International Agency for Research on
Cancer; ICD: International Classification of Diseases; BC: British Columbia;
NWR: North Western Region; NSW: New South Wales; APC: Annual percentage
References
1. Ferlay J, Soerjomataram I, Ervik M, Dikshit R, Eser S, Mathers C, Rebelo M,
Parkin DM, Forman D, Bray F. GLOBOCAN 2012 v1.0, Cancer Incidence and
Mortality Worldwide: IARC CancerBase No. 11 [Internet]. Lyon, France:
International Agency for Research on Cancer; 2013. Available from:
, accessed on 20/01/2014.
2. National Cancer Institute. Surveillance, Epidemiology, and End Results Program
(accessed on 28/10/2014).
3. Zeng H, Zheng R, Guo Y, Zhang S, Zou X, Wang N, et al. Cancer survival in
China, 2003–2005: A population-based study. Int J Cancer. 2015;136(8):1921–30.
4. Tang D, Nagano H, Nakamura M, Wada H, Marubashi S, Miyamoto A, et al.
Clinical and pathological features of Allen’s type C classification of resected
combined hepatocellular and cholangiocarcinoma: a comparative study with
hepatocellular carcinoma and cholangiocellular carcinoma. J Gastrointest Surg.
2006;10(7):987–98.
5. El-Serag HB. Hepatocellular Carcinoma. N Engl J Med. 2011;365:1118–27.
6. El-Serag HB. Epidemiology of viral hepatitis and hepatocellular carcinoma.
Gastroenterology. 2012;142(6):1264–73.
7. Shih WL, Chang HC, Liaw YF, Lin SM, Lee SD, Chen PJ, et al. Influences of
tobacco and alcohol use on hepatocellular carcinoma survival. Int J Cancer.
2012;131(11):2612–21.
8. Ezzati M, Riboli E. Behavioral and dietary risk factors for noncommunicable
diseases. N Engl J Med. 2013;369(10):954–64.
9. Chuang SC, La Vecchia C, Boffetta P. Liver cancer: descriptive epidemiology and
risk factors other than HBV and HCV infection. Cancer Lett. 2009;286(1):9–14.
10. Nordenstedt H, White DL, El-Serag HB. The changing pattern of epidemiology
in hepatocellular carcinoma. Dig Liver Dis. 2010;42:S206–14.
11. McGlynn KA, Tsao L, Hsing AW, Devesa SS, Fraumeni JFJ. International
trends and patterns of primary liver cancer. Int J Cancer. 2001;94(2):290–6.
12. Center MM, Jemal A. International trends in liver cancer incidence rates.
Cancer Epidemiol Biomarkers Prev. 2011;20(11):2362–8.
13. Segi M. Cancer mortality for selected sites in 24 countries (1950–57). Sendai:
Tohuku University School of Public Health; 1960.
14. Waterhouse J, Muir CS, Shanmugaratnam K, Powell J. Cancer Incidence in
Five Continents, Vol. IV.IARC Scientific Publications No. 42, Lyon, IARC. 1982.
Zhang et al. BMC Cancer (2015) 15:94
15. Muir CS, Waterhouse J, Mack T, Powell J, Whelan SL. Cancer Incidence in
Five Continents, Vol. V. IARC Scientific Publications No. 88, Lyon, IARC. 1987.
16. Parkin DM, Muir CS, Whelan SL, Gao Y-T, Ferlay J, Powell J. Cancer Incidence in
Five Continents, Vol. VI. IARC Scientific Publications No. 120, Lyon, IARC. 1992.
17. Parkin DM, Whelan SL, Ferlay J, Raymond L, Young J. Cancer Incidence in Five
Continents, Vol. VII. IARC Scientific Publications No. 143, Lyon, IARC. 1997.
18. Parkin DM, Whelan SL, Ferlay J, Teppo L, Thomas DB. Cancer Incidence in Five
Continents, Vol. VIII. IARC Scientific Publications No. 155, Lyon, IARC. 2002.
19. Curado MP, Edwards B, Shin HR, Storm H, Ferlay J, Heanue M, et al. Cancer
Incidence in Five Continents, Vol. IX. IARC Scientific Publications No. 160,
Lyon, IARC. 2007.
20. Forman D, Bray F, Brewster DH, Gombe Mbalawa C, Kohler B, Piñeros M,
et al. Cancer Incidence in Five Continents, Vol. X (electronic version). Lyon,
IARC. last accessed on [28/10/2013]. 2013.
21. Lortet-Tieulent J, Renteria E, Sharp L, Weiderpass E, Comber H, Baas P, et al.
Convergence of decreasing male and increasing female incidence rates in
major tobacco-related cancers in Europe in 1988–2010. Eur J Cancer. 2013;
/>22. Surveillance, Epidemilology, and End Results (SEER) Program (November
2012 submission). Public use database (1973–1982). Surveillance Research
Program, National Cancer Institute SEER*Stat software (seer.cancer.gov/
seerstat) version < Version 8.0.4>, Released April 15, 2013.
23. Ferlay J, Parkin DM, Curado MP, Bray F, Edwards B, Shin HR, et al. Cancer
Incidence in Five Continents, Volumes I to IX: IARC CancerBase No. 9
[Internet]. International Agency for Research on Cancer: Lyon, France; 2010.
Available from: .
24. Jin F, Devesa SS, Chow WH, Zheng W, Ji BT, Fraumeni JF, et al. Cancer
incidence trends in urban Shanghai, 1972–1994: an update. Int J Cancer.
1999;83(4):435–40.
25. Chiang CJ, Yang YW, You SL, Lai MS, Chen CJ. Thirty-Year Outcomes of the
National Hepatitis B Immunization Program in Taiwan. JAMA. 2013;310(9):974–6.
26. Chia KS, Lee HP, Lee J. Incidence of primary liver cancer in Singapore,
1968–1982. Ann Acad Med Singapore. 1989;18(3):313–6.
27. Lu W, Zheng Y. Prevalence and prevention measure of cancer in Shanghai.
China Cancer. 2009;18:90–1.
28. Liang X, Bi S, Yang W, Wang L, Cui G, Cui F, et al. Epidemiological
serosurvey of hepatitis B in China–declining HBV prevalence due to
hepatitis B vaccination. Vaccine. 2009;27(47):6550–7.
29. Ang LW, Cutter J, James L, Goh KT. Seroepidemiology of hepatitis B virus
infection among adults in Singapore: a 12-year review. Vaccine.
2013;32(1):103–10.
30. Gao S, Yang WS, Bray F, Va P, Zhang W, Gao J, et al. Declining rates of
hepatocellular carcinoma in urban Shanghai: incidence trends in 1976–2005.
Eur J Epidemiol. 2012;27(1):39–46.
31. Sun Z, Chen T, Thorgeirsson SS, Zhan Q, Chen J, Park JH, et al. Dramatic
reduction of liver cancer incidence in young adults: 28 year follow-up of
etiological interventions in an endemic area of China. Carcinogenesis.
2013;34(8):1800–5.
32. Yoshizawa H. Hepatocellular carcinoma associated with hepatitis C virus
infection in Japan: projection to other countries in the foreseeable future.
Oncology. 2002;62 Suppl 1:8–17.
33. Tsukuma H. Liver cancer and its prevention. Asian Pac J Cancer Prev.
2005;6:244–50.
34. Hideo T, Yasuharu I, Naoki H, Yuri I, Kazuho I, Masahide O, et al. Declining
Incidence of Hepatocellular Carcinoma in Osaka, Japan, from 1990 to 2003.
Ann Intern Med. 2008;148:820–6.
35. Chung H, Ueda T, Kudo M. Changing trends in hepatitis C infection over
the past 50 years in Japan. Intervirology. 2010;53(1):39–43.
36. Jemal A, Center MM, DeSantis C, Ward EM. Global patterns of cancer
incidence and mortality rates and trends. Cancer Epidemiol Biomarkers Prev.
2010;19(8):1893–907.
37. Kiyosawa K, Sodeyama T, Tanaka E, Gibo Y, Yoshizawa K, Nakano Y, et al.
Interrelationship of blood transfusion, non-A, non-B hepatitis and
hepatocellular carcinoma: analysis by detection of antibody to hepatitis C
virus. Hepatology. 1990;12:671–5.
38. El-Serag HB, Rudolph KL. Hepatocellular carcinoma: epidemiology and
molecular carcinogenesis. Gastroenterology. 2007;132(7):2557–76.
39. Bosch FX, Ribes J, Díaz M, Cléries R. Primary liver cancer: Worldwide
incidence and trends. Gastroenterology. 2004;127(5):S5–16.
Page 11 of 11
40. Maso LD, Lise M, Zambon P, Crocetti E, Serraino D, Ricceri F, et al.
Incidence of primary liver cancer in Italy between 1988 and 2002:
an age-period-cohort analysis. Eur J Cancer. 2008;44(2):285–92.
41. Donato F, Tagger A, Gelatti U, Parrinello G, Boffetta P, Albertini A, et al. Alcohol
and hepatocellular carcinoma: the effect of lifetime intake and hepatitis virus
infections in men and women. Am J Epidemiol. 2002;155(4):323–31.
42. Carlo LV. Alcohol and liver cancer. Eur J Cancer Prev. 2007;16(6):495–7.
43. Larsson SC, Wolk A. Overweight, obesity and risk of liver cancer: a metaanalysis of cohort studies. Brit J Cancer. 2007;97(7):1005–8.
44. Calle EE, Rodriguez C, Walker-Thurmond K, Thun MJ. Overweight, obesity,
and mortality from cancer in a prospectively studied cohort of U.S. adults.
N Engl J Med. 2003;348(17):1625–38.
45. Wolk A, Gridley G, Svensson M, Nyren O, McLaughlin JK, Fraumeni JF, et al.
A prospective study of obesity and cancer risk (Sweden). Cancer Causes
Control. 2001;12(1):13–21.
46. Møller H, Mellemgaard A, Lindvig K, Olsen JH. Obesity and cancer risk: a
Danish record-linkage study. Eur J Cancer. 1994;30A:344–50.
47. Neuschwander-Tetri BA, Caldwell SH. Nonalcoholic steatohepatitis: Summary
of an AASLD Single Topic Conference. Hepatology. 2003;37(5):1202–19.
48. El-Serag HB, Mason AC. Rising incidence of hepatocellular carcinoma in the
United States. N Engl J Med. 1999;340:745–50.
Submit your next manuscript to BioMed Central
and take full advantage of:
• Convenient online submission
• Thorough peer review
• No space constraints or color figure charges
• Immediate publication on acceptance
• Inclusion in PubMed, CAS, Scopus and Google Scholar
• Research which is freely available for redistribution
Submit your manuscript at
www.biomedcentral.com/submit