Metabolic characterization of triple negative breast cancer
Bạn đang xem bản rút gọn của tài liệu. Xem và tải ngay bản đầy đủ của tài liệu tại đây (1.76 MB, 12 trang )
Cao et al. BMC Cancer 2014, 14:941
/>
RESEARCH ARTICLE
Open Access
Metabolic characterization of triple negative
breast cancer
Maria D Cao1,2*, Santosh Lamichhane1, Steinar Lundgren3,4, Anna Bofin5, Hans Fjøsne3,6,
Guro F Giskeødegård1,2 and Tone F Bathen1
Abstract
Background: The aims of this study were to characterize the metabolite profiles of triple negative breast cancer
(TNBC) and to investigate the metabolite profiles associated with human epidermal growth factor receptor-2/neu
(HER-2) overexpression using ex vivo high resolution magic angle spinning magnetic resonance spectroscopy (HR
MAS MRS). Metabolic alterations caused by the different estrogen receptor (ER), progesterone receptor (PgR) and
HER-2 receptor statuses were also examined. To investigate the metabolic differences between two distinct receptor
groups, TNBC tumors were compared to tumors with ERpos/PgRpos/HER-2pos status which for the sake of simplicity
is called triple positive breast cancer (TPBC).
Methods: The study included 75 breast cancer patients without known distant metastases. HR MAS MRS was
performed for identification and quantification of the metabolite content in the tumors. Multivariate partial least
squares discriminant analysis (PLS-DA) modeling and relative metabolite quantification were used to analyze the MR
data.
Results: Choline levels were found to be higher in TNBC compared to TPBC tumors, possibly related to cell
proliferation and oncogenic signaling. In addition, TNBC tumors contain a lower level of Glutamine and a higher
level of Glutamate compared to TPBC tumors, which indicate an increase in glutaminolysis metabolism. The
development of glutamine dependent cell growth or “Glutamine addiction” has been suggested as a new
therapeutic target in cancer. Our results show that the metabolite profiles associated with HER-2 overexpression
may affect the metabolic characterization of TNBC. High Glycine levels were found in HER-2pos tumors, which
support Glycine as potential marker for tumor aggressiveness.
Conclusions: Metabolic alterations caused by the individual and combined receptors involved in breast cancer
progression can provide a better understanding of the biochemical changes underlying the different breast cancer
subtypes. Studies are needed to validate the potential of metabolic markers as targets for personalized treatment of
breast cancer subtypes.
Keywords: Metabolomics, HR MAS MRS, Estrogen receptor, Progesterone receptor, HER-2 receptor, Triple negative
breast cancer, Choline phospholipid metabolism, Glycolysis, Glutaminolysis
* Correspondence:
1
Department of Circulation and Medical Imaging, Norwegian University of
Science and Technology (NTNU), Trondheim, Norway
2
St. Olavs Hospital, Trondheim University Hospital, Trondheim, Norway
Full list of author information is available at the end of the article
© 2014 Cao et al.; licensee BioMed Central Ltd. This is an Open Access article distributed under the terms of the Creative
Commons Attribution License ( which permits unrestricted use, distribution, and
reproduction in any medium, provided the original work is properly credited. The Creative Commons Public Domain
Dedication waiver ( applies to the data made available in this article,
unless otherwise stated.
Cao et al. BMC Cancer 2014, 14:941
/>
Background
Triple negative breast cancer (TNBC) is a heterogeneous
subgroup of breast cancer characterized by the absence
of expression of estrogen receptor (ER), progesterone receptor (PgR) and human epidermal growth factor
receptor-2/neu (HER-2). TNBC represents approximately 15-20% of all breast cancer cases and is generally
considered as the most severe subgroup of breast cancer.
Patients diagnosed with TNBC are largely unresponsive
to currently available targeted therapies, such as Tamoxifen and Trastuzumab, in addition to having a higher risk
of relapse and a higher mortality rate compared to other
breast cancer subtypes [1]. Treatment with protein inhibitors against PI3KCA and HSP90 have shown to be
efficient in only a subset of TNBC [2]. Therefore, there
is an urgent need to identify new molecular targets for
treatment of TNBC to improve treatment care and survival of this breast cancer subgroup.
Classification of breast cancer according to molecular
subtypes is highly relevant and may provide significant
prognostic information related to patient outcome. Several studies have investigated the underlying genomic
and transcriptomic characteristics of TNBC [3-5]. The
results suggest the existence of a variety of TNBC subtypes including basal and non-basal, p53 mutated and
high genomic instability, among others [3]. For example,
five distinct subtypes of TNBC have been suggested
based on gene expression profiles [5]. In a recent study,
TNBC was subdivided into basal or 5-negative phenotype dependent on the expressions of assorted basal
markers, including cytokeratin 5 (CK5) and epithelial
growth factor receptor (EGFR) using immunohistochemistry (IHC) and in situ hybridization [6]. The validation
of reliable markers for breast cancer sub-classification is
still ongoing.
Altered energy metabolism is a new emerging hallmark of cancer [7]. Increasing evidence suggests that alterations in cancer metabolism, especially choline
phospholipid and amino acid metabolism may provide
potential targets for treatment of breast cancer. To our
knowledge, the metabolite profiles of TNBC and the
metabolic influences of HER-2 overexpression have not
yet been investigated in detail. Metabolomics, defined as
a systematic study of the metabolism, has proven to be
an important tool for the identification of new biomarkers for targeted treatment, treatment evaluation
and prediction of cancer survival [8-11]. Previous studies
have shown the potential and benefit of combining the
different OMICS approaches, e.g. transcriptomics and
metabolomics, for better molecular characterization and
stratification of breast cancer [12-15].
Ex vivo high resolution magic angle spinning magnetic
resonance spectroscopy (HR MAS MRS) can be used for
the identification and quantification of the metabolite
Page 2 of 12
content in a biological tissue sample. HR MAS MRS is a
non-destructive technique meaning that the tissue remains intact after examination and can be used for
other OMICS approaches, thus allowing for a comprehensive and detailed study of the molecular composition of the tissue. By using HR MAS MRS, more than
30 metabolites can be detected and assigned simultaneously in breast cancer tissue [16]. HR MAS MRS has
been widely used to study cancer related pathways,
including choline phospholipid metabolism, glycolysis
(the Warburg effect), amino acids, lipids and polyamines,
among others [17-19]. The metabolite profiles acquired by
HR MAS MRS have shown to correlate to hormone receptor status, treatment response and survival in breast
cancer [20-24].
Analysis of HR MAS MRS spectra can be challenging
due to the high number of collinear variables (exceeding
tens of thousands of data points per sample). Multivariate data analysis is a suitable method for analyzing the
complex and high dimensional MRS data. Partial least
squares discriminant analysis (PLS-DA) can be used to
identify metabolic differences between distinct classes by
finding linear relationships between the spectral data
and class variables, e.g. receptor status [25]. In addition
to multivariate modeling, quantification of the individual
metabolites can be achieved by calculating the area
under the peak signal.
Most studies have compared TNBC with non-triple
negative breast cancer, most commonly ERpos/PgRpos
breast cancer subtype, in those studies the effects of
HER-2 overexpression were not considered. In this
study, we have investigated the metabolic differences between TNBC tumors and tumors with ERpos/PgRpos/
HER-2pos status, which for the sake of simplicity is called
triple positive breast cancer (TPBC). We have also examined the influences of ER, PgR and HER-2 receptors
status individually on breast cancer metabolism and explored the metabolite profiles associated with HER-2
overexpression. Metabolic alterations caused by the individual and combined hormone and growth receptors
may help identify potential targets for treatment of
breast cancer subtypes.
Methods
Patients and tumor receptor status
Included in this study were patients (n = 75) aged 34 to
90 diagnosed with breast cancer without known distant
metastasis. The patients did not receive any pre-surgical
therapy for their cancer disease. The biopsies were extracted immediately after surgical removal of the tumor.
Parts of the tumor were used for routine analyses, including tumor grade, ER, PgR and HER-2 status
(Table 1). Tumors were considered positive for ER and
PgR when more than 10% of tumor cells showed positive
Cao et al. BMC Cancer 2014, 14:941
/>
Page 3 of 12
Table 1 Patient characteristics n = 75 patients
Age (avg ± SD)
Grade
Lymph node status
ER
PgR
HER-2/neu
64 ± 19
I
6
II
22
III
30
NA
17
Pos
47
Neg
25
NA
3
Pos
44
Neg
31
Pos
32
Neg
43
Pos
30
Neg
45
TNBC
20
TPBC
11
NA: not available, ER: estrogen receptor, PgR: progesterone receptor, HER-2/
neu: human epidermal growth factor receptor-2, TNBC: triple negative breast
cancer, TPBC: triple positive breast cancer.
staining by IHC. The samples were tested for HER-2
gene expression using a validated dual probe fluorescence in situ hybridization (FISH) assay (HER-2 IQFISH
pharmDx/HER-2FISHpharm Dx) or for protein overexpression using a validated IHC assay (HercepTest, DAKO).
The HER-2 gene was considered amplified if the gene to
chromosome 17 ratio was larger than 2.0 analyzed by
FISH or evidence of protein overexpression by IHC score
3+. Another part of the tumor was snap frozen immediately during surgery and stored in liquid nitrogen for MRS
analysis. All patients have signed a written informed consent, and the study was approved by the Regional Ethics
Committee, Central Norway.
Imprint cytology
Cytological imprint was performed to confirm the presence of tumor cells in the sample before HR MAS MRS
and was used as an inclusion criterion and not as a
quantitative measurement [26]. This technique is fast
and requires minimal preparation. In brief, the tissue
was gently pressed on a glass slide and air-dried for approximately 10 minutes. The imprints were fixed in
ethanol and stained with May-Grünwald-Giemsa stain
(Color-Rapid, Med-Kjemi, Norway). All imprints were
reviewed by a well-trained pathologist. Samples with absence of tumor cells were excluded from further
analysis.
High resolution magic angle spinning
To minimize the effect of tissue degradation on the metabolite profiles, the samples were prepared on ice block
and within a short period (5 ± 1 min). The biopsies
(13 ± 3 mg) were cut to fit 30 μl disposable inserts
filled with 3 μl phosphate buffered saline (PBS) in
D2O containing 1.0 mM TSP for chemical shift referencing and 1.0 mM Format for shimming. The HR
MAS spectra were acquired on a Bruker Avance DRX600
spectrometer equipped with a 1H/13C MAS probe with
gradient (Bruker Biospin GmbH, Germany) using the
following parameters; 5 kHz spin rate, 4°C probe
temperature, cpmgpr1D sequence (Bruker Biospin GmbH,
Germany) with 273.5 ms total echo time, a spectral width
of 20 ppm (−5 to 15 ppm) and 256 scans (NS). For some
patients, more than one biopsy (taken from different
places in the tumor) were prepared and analyzed by HR
MAS MRS.
Data analysis
Following acquisition, the spectra were Fourier transformed into 65.5 k after 0.3 Hz line broadening and TSP
was calibrated to 0.00 ppm (Topspin 3.1, Bruker Biospin
GmbH, Germany). The following spectral preprocessing
steps were carried out using Matlab R2009a (The
Mathworks, Inc., USA). Spectral regions containing signals from chemical contaminations (e.g. ethanol), water,
and lipids were removed before multivariate data analysis.
Baseline offset was corrected by setting the lowest point of
each spectrum to zero. The spectra were normalized to
equal total area to account for differences in sample size.
Furthermore, the spectra were peak aligned using icoshift
[27]. The spectral region between 1.5 – 4.7 ppm, containing the majority of low-molecular weight metabolites, was
used as the final input for the multivariate models.
PLS-DA and metabolite relative quantification were
performed to evaluate the metabolic differences between
the tested groups using Matlab and PLS_Toolbox 6.2.1
(Eigenvector Research, USA). The spectra were meancentered before the PLS-DA modeling. The classification
results were calculated using random cross validation
(20% for testing and 80% for training, repeated 20
times). In cases where there were multiple spectra from
the same patient, all of these spectra were either used
for training or testing. The number of latent variables
(LVs) used for all repetitions was chosen by leave one
patient out cross-validation of the whole data set. Permutation testing, carried out by randomly assigning the
class labels, was performed to evaluate the statistical significance of the classification results [25]. The permuted
classification result was calculated as described for the
PLS-DA models and repeated 1000 times. Metabolites
importance in the PLS-DA loading were identified by
variable importance in the projection (VIP) scores [28].
Relative metabolite quantification was performed by
peak integration using mean normalized spectra after removal of water, lipids and contaminations. Statistical
Cao et al. BMC Cancer 2014, 14:941
/>
differences between the groups were tested by Wilcoxon
testing with Benjamini Hochberg correction for multiple
testing. P-values ≤ 0.05 were considered significant. The
p-values adjusted for multiple testing are given as qvalues. While P-values are used as an indicator of the
false positives in all tested values in the dataset, the qvalues are used to interpret the false discovery rate
(FDR) among significant p-values. To give a more accurate indication of the FDR both p- and q-values are listed
in the results. The quantification results are illustrated
by heat maps (Matlab R2009a).
Results
Spectra from biopsies with absence of tumor cells and
low spectral quality with high noise and severe chemical
contamination were excluded from further analysis
(n = 4). In total, 106 biopsies from 73 patients were
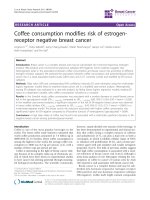
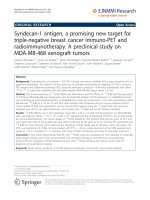
included in the data analyses. A representative metabolite
spectrum of breast cancer tissue obtained by HR MAS
MRS is shown in Figure 1. The metabolite data shows no
significant association with tumor grade and lymph node
status by PCA and PLS-DA modeling (data not shown).
The PLS-DA classification results of TNBC, ER, PgR and
HER-2 are summarized in Table 2.
TNBC versus TPBC
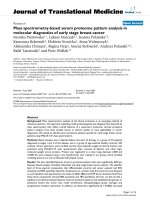
The PLS-DA shows the highest CV accuracy for separating TNBC and TPBC (77.7%, p = 0.001). The corresponding score and loading plots show a clear
separation between the two groups. TNBC is characterized with higher levels of Choline and Glycerophosphocholine (GPC), and a lower level of Creatine compared
to TPBC (Figure 2A). Based on the loadings, high levels
of PC and Glycine were observed in some tumors, but
their influence in the classification model are unclear.
Relative quantification shows consistently higher levels
of Choline (p = 0.008, q = 0.041) in TNBC tumors. Lower
Page 4 of 12
levels of Glutamine (p < 0.001, q = 0.001) and higher
levels of Glutamate (p = 0.002, q = 0.015) were also observed in TNBC compared to TPBC tumors (Figure 3A).
Creatine appears to be important for separating TNBC
and TPBC in the multivariate analysis identified by a
high value of VIP score. Lower levels of Creatine were
also found in TNBC compared to TPBC tumors by relative quantification, however, the q-value was not significant (p-value = 0.031, q-value = 0.109).
Hormone receptor status
PLS-DA models show clear separations between ERneg
and ERpos (72.2%, p < 0.001), and PgRneg and PgRpos
(67.8%, p < 0.001) tumors. ERneg tumors show higher
levels of Glycine, Choline, and Lactate compared to
ERpos tumors, as shown in the score and loading plots
(Figure 2B). According to the VIP scores, Glycine appears to be most important for the discrimination between ERneg and ERpos. Higher levels of Glycine (p =
0.002, q = 0.010), Choline (p = 0.021, q = 0.067), Lactate
(p < 0.000, q = 0.001), and Glutamate (p <0.001, q <0.001)
and lower level of Glutamine (p <0.001, q <0.001)
were observed in ERneg compared to ERpos tumors by
relative quantification (Figure 3B). PC levels appear to
be high in some tumors from both groups, and could
not be used to discriminate between ERneg and ERpos
tumors. PLS-DA classification and relative quantification of PgRneg and PgRpos tumors show similar metabolite profiles as ERneg and ERpos tumors (data not
shown).
HER-2 status
HER-2neg and HER-2pos tumors were discriminated by
PLS-DA with 69.1% CV accuracy (p < 0.001). Contrary
to ERneg and PgRneg, HER-2neg tumors have a lower level
of Glycine (p = 0.002, q = 0.012) compared to HER-2pos
tumors (Figures 2C and 3C). Similar to what was
Figure 1 Breast cancer metabolite spectrum and cytology image. (A) A representative metabolite profile of breast cancer tissue acquired
with HR MAS MRS. (B) Imprint cytology slide of breast cancer tissue stained with May-Grünwald-Giemsa staining. β-Glc: beta Glucose, Lac: Lactate,
Gly: Glycine, m-Ino: myo-Inositol, Tau: Taurine, s-Ino: scyllo-Inositol, GPC: Glycerophosphocholine, PC: Phosphocholine, Cho: free Choline, Cr:
Creatine, Gln: Glutamine, Glu: Glutamate, Ala: Alanine.
Cao et al. BMC Cancer 2014, 14:941
/>
Page 5 of 12
Table 2 PLS-DA classification results of TNBC, ER, PgR and HER-2 status
TNBC vs TPBC
Total b/p
NEG b/p
POS b/p
CV accuracy %
CV Sensitivity %
CV Specificity %
Permutation p-value
39/30
26/19
13/11
77.7
80.0
75.4
0.001
ERneg vs ERpos
106/73
41/30
65/43
72.2
76.0
68.5
<0.001
PgRneg vs PgRpos
106/73
59/42
47/31
67.8
74.0
61.6
<0.001
HER-2neg vs HER-2pos
106/73
66/43
40/30
69.1
70.2
68.0
<0.001
b = biopsies/p = patients. PLS-DA: partial least squares discriminant analysis, CV: cross validation.
observed for ERneg and PgRneg tumors, lower levels of
Glutamine (p = 0.003, q = 0.017) were observed in HER2neg compared to HER-2pos tumors detected by relative
quantification. In addition to the changes in Glycine and
Glutamine, HER-2neg tumors also display higher levels of
Alanine (p = 0.010, q = 0.039), and lower levels of Succinate (p = 0.001, q = 0.012) and Creatine (p = 0.024, q =
0.075) compared to HER-2pos tumors by relative quantification. In the loading plot, PC levels appear to be
higher in some HER-2neg compared to HER-2pos tumors.
However, the relative quantification result shows no significant difference in PC levels between the two groups.
HER-2 metabolite profiles in tumors with different ER and
PgR status
To investigate the metabolic influences of HER-2 status
independently of the hormone receptors status, the metabolite profiles associated with HER-2 status were examined within ERneg, ERpos, PgRneg, and PgRpos tumors
separately. The PLS-DA results are shown in Table 3.
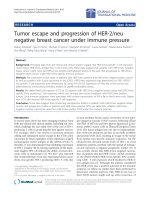
The scores and loadings of PLS-DA models show higher
levels of Glycine in HER-2pos compared to HER-2neg tumors irrespective of ER and PgR status (Figure 4A-D).
Glycine levels determined by relative quantification
showed a trend of higher levels in HER-2pos compared
to HER-2neg tumors in the different ER and PgR status
groups (p < 0.021 and q < 0.133). Glutamine also showed
a trend of higher level in HER-2pos compared to HER2neg tumors (p < 0.034 and q < 0.179). In the PLS-DA
models, PC appears to be high in some HER-2neg
tumors. However, PC level was not significantly different between HER-2pos and HER-2neg by relative
quantification.
Discussion
Triple negative breast cancer is characterized as being
estrogen receptor, progesterone receptor and HER-2/neu
receptor negative; it is a heterogeneous breast cancer
subtype that is difficult to treat and is associated with
high recurrence and poor outcome [1]. Several studies
have investigated the underlying genomic and gene expression patterns of TNBC [2-5] while the metabolite
profiles of TNBC have not yet been investigated in detail. Most studies have compared TNBC with ERpos/
PgRpos breast cancer subtype, which does not take into
consideration the influence of HER-2 status on breast
cancer molecular profiles. In this study we investigated
the metabolite profiles of patients with TNBC compared
to TPBC and showed that these two groups could be
successfully separated based on the metabolite profiles
of tissue biopsies. In accordance with previous studies,
altered metabolite profiles were observed in tumors with
different expression of ER and PgR [21]. Furthermore,
our results show that overexpression of HER-2 might
cause alterations to the metabolite profiles of breast cancer independent of hormone receptor status, thus affecting the differentiation between TNBC and TPBC.
The basal-like breast cancer subtype is defined through
gene expression profiling and is considered to be a more
aggressive breast cancer subtype compared to luminallike and HER-2 enriched gene expression subtypes. The
majority of basal-like tumors are TNBC, but not all
TNBC are defined as basal-like by gene expression. As
previously published, the discrepancy rate is approximately 20–30 % [29]. Furthermore, there exists a significant overlap between TNBC, basal-like and BRCA-1
breast cancer [30]. In our study, TNBC has significantly
higher Choline levels compared to TPBC, and this is in
accordance with previous findings where higher Choline
levels were detected in the more aggressive basal-like
xenografts and TNBC patients as compared to the less
aggressive luminal-like xenografts and ERpos/PgRpos
breast cancer patients [12]. In another study, a significantly higher total Choline (tCho = PC + GPC + Choline)
signal to noise ratio (tCho/SNR) was detected in TNBC
when compared to non-triple negative tumors using
in vivo MRS [31]. Choline-containing metabolites are
involved in cell signaling, lipid metabolism, and cell
membrane synthesis and degradation. The tCho level
detected by in vivo and ex vivo MRS has been suggested
as a biomarker for breast cancer diagnosis and response
to chemotherapy [19].
Patients with basal-like breast cancer have been shown
to be more sensitive to anthracycline-based neoadjuvant
chemotherapy than the luminal subtype and a higher
percentage of patients with a pathological complete response (pCR) to the treatment was achieved in the
basal-like compared to luminal subtypes [32]. However,
for patients with residual disease after chemotherapy,
the basal-like subtypes showed worse overall survival
Cao et al. BMC Cancer 2014, 14:941
/>
Page 6 of 12
Figure 2 PLS-DA score and loading plots of (A) TNBC versus TPBC, (B) ERneg versus ERpos, and (C) HER-2neg versus HER-2pos breast
cancer tumors. In the score plots (left), each symbol represents one sample. The score plots show the first and second latent variables (LV), and
are used for interpreting relations between samples, thus similar samples are located close to each other. In the loading plots (right), the symbols
represent metabolites that are significantly important for the discrimination between the groups. Variable importance in the projection (VIP)
scores are illustrated by the heat map. The majority of TNBC, ERneg and HER-2neg samples have positive score for LV1. The PLS-DA model of
TNBC versus TPBC shows best classification results, see Table 2. Gly: Glycine, Lac: Lactate, Cho: Choline, PC: Phosphocholine, Cr: Creatine,
Tau: Taurine.
Cao et al. BMC Cancer 2014, 14:941
/>
Page 7 of 12
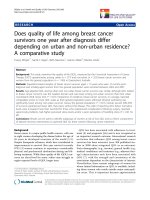
Figure 3 Relative metabolite quantification of 14 metabolites and ratio illustrated by heat map. The heat maps illustrate the metabolite
intensities calculated by peak integration. The arrows show metabolites with significantly higher (↑) or lower (↓) levels in (A) TNBC, (B) ERneg and
(C) HER-2neg tumors compared to TPBC, ERpos and HER-2pos tumors, respectively. Statistical differences between the groups were tested by
Wilcoxon testing with Benjamini Hochberg correction for multiple testing.
Table 3 PLS-DA classification results of HER-2 status in tumors with different ER and PgR status
Total b/p HER-2neg b/p HER-2pos b/p CV accuracy % CV Sensitivity % CV Specificity % Permutation p-value
HER-2neg vs HER-2pos
in ERneg
41/30
26/19
15/11
70.1
63.3
76.8
0.013
HER-2neg vs HER-2pos
in ERpos
65/43
40/24
25/19
66.1
67.9
64.3
0.017
HER-2neg vs HER-2pos
in PgRneg
59/42
33/24
26/18
68.8
65.3
72.3
0.006
HER-2neg vs HER-2pos
in PgRpos
47/31
33/19
14/12
70.1
68.3
71.8
0.014
b = biopsies/p = patients. PLS-DA: partial least squares discriminant analysis, CV: cross validation.
Cao et al. BMC Cancer 2014, 14:941
/>
Page 8 of 12
Figure 4 PLS-DA score and loading plots of HER-2neg versus HER-2pos status in (A) ERneg, (B) ERpos, (C) PgRneg, and (D) PgRpos tumors.
The score plots show the first and second latent variables (LV). In the loading plot, VIP scores are illustrated by heat map. The majority of
HER-2neg tumors show positive score for LV1, while most HER-2pos tumors show negative score for LV1. HER-2pos tumors contain higher Glycine
level compared to HER-2neg tumors. LV: latent variable, Gly: Glycine. PC: Phosphocholine.
than the luminal-like. These results indicate that chemotherapy alone is not sufficient to treat TNBC and that
more advanced targeted therapy is needed to improve
the prognosis of this patient subgroup. Moreover, assessment of clinical response (i.e. changes in tumor size)
alone might not be a good predictive measure for treatment, as it cannot give information about the molecular
state of the tumor. Interestingly, decreased levels of
choline-containing compounds in response to neoadjuvant chemotherapy have been detected in patients with
Cao et al. BMC Cancer 2014, 14:941
/>
better survival rate [22,23]. Targeting the genes and enzymes involved in the choline phospholipid metabolism
is currently under investigation, and so far the results
have been promising. Down-regulation of choline kinase
alpha (CHKA), the gene regulating the conversion of
Choline to PC, has been shown to decrease cell proliferation, and to increase the effect of chemotherapy in
ovarian [33] and breast cancers [34], whereas CHKA
overexpression increases drug resistance in breast cancer
cells [35]. The CHKA inhibitor is currently under phase
I clinical trial. Our results suggest that targeting the
genes/enzymes responsible for the choline phospholipid
metabolism may provide new molecular targets for treatment of TNBC.
Alterations in ER, PgR and HER-2 expression have
proven to play a major role in breast cancer progression,
with ERpos and PgRpos tumors having better prognosis,
while HER-2 overexpression is associated with a worse
prognosis. Thus metabolic alterations caused by these
hormone and growth receptors are highly relevant, especially because the molecular reasons behind their
overexpression/amplification remain largely unknown.
Similar metabolite profiles were observed in tumors
with ERneg and PgRneg , and ERpos and PgRpos status. In
accordance with previous findings, we found a higher
level of Glycine in patients with ERneg and PgRneg tumors
compared to ERpos and PgRpos, respectively [21]. Higher
levels of Choline and Lactate were also observed in
ERneg and PgRneg tumors, which suggest enhanced
glycolytic activity and tumor aggressiveness. ER status is
generally accepted as an independent prognostic and
predictive factor, while the significance of PgR status is
less clear [36].
Although TNBC is considered to be a more aggressive
breast cancer subgroup due to low response to available
treatment, the overexpression of HER-2 itself is associated with poorer prognosis compared to HER-2 negativity [37]. Patients identified with HER-2pos tumors are
often treated with Trastuzumab. Noticeably, it has been
reported that about 20-30% of HER-2pos patients fail to
respond to first time treatment with Trastuzumab and
about 15% of patients will develop resistance to this drug
[38,39]. Therefore, there is also a need to identify new
molecular targets for treatment of this breast cancer
subtype. In our study, we found high levels of Glycine
and Alanine to be associated with HER-2pos breast tumors. Alanine is involved in the synthesis of Glycine
from Pyruvate and Serine. High levels of Glycine have
previously been shown to correlate with poor prognosis
in breast cancer [23,40,41]. Glycine is an amino acid involved in the synthesis of proteins, nucleotides and glutathione. The potential role of Glycine as a tumor biomarker
has also been studied in human brain tumors, where it was
found to positively correlate with tumor grade [42,43].
Page 9 of 12
Moreover, the synthesis of Glycine from Glucose has been
shown to correlate with rapid cancer cell proliferation [44].
Interestingly, we found higher levels of Glycine to be
associated with HER-2 overexpression in the ERneg,
ERpos, PgRneg, and PgRpos tumors separately, which suggest Glycine to be a specific marker for HER-2 amplification regardless of the ER and PgR status. ERneg and
PgRneg tumors and ERpos and PgRpos tumors show comparable results. Tumors overexpressing HER-2 have
shown to acquire resistance to estrogen therapy which
suggests that there exists a crosstalk between ER and
HER-2 status [45]. The p-values for differences in Glycine relative concentration between HER-2pos and HER2neg were significant before multiple corrections, while
the adjusted p-values showed trends towards significance. However, the chance of false positive result as described by the false discovery rate was low. In our
cohort, we could not detect any differences in Glycine
between TNBC and TPBC, possibly due to the high level
of Glycine in ERneg and PgRneg and low level of Glycine
in HER-2neg tumors, which may cancel out the differences in Glycine between TNBC and TPBC. Based on
our results we suggest Glycine to be associated with
tumor aggressiveness in HER-2pos breast cancer. Recently, there has been an increasing interest in detecting
the circulating HER-2 protein in serum samples for use
as a complementary assay to IHC and FISH analysis for
diagnosis, but also for use as a prognostic marker for
breast cancer recurrence [46,47]. High throughput
screening of serum metabolites, including Glycine, is
feasible using MRS or other laboratory assays and
should be investigated further as a breast cancer prognostic marker.
Furthermore, significant changes in other amino acids
were also observed between the different breast cancer
subtypes. Tumors negative for ER and PgR, and TNBC
tumors contain lower levels of Glutamine and higher
levels of Glutamate compared to tumors with positive
receptor statuses which might result from increased glutaminolysis metabolism. Glutamine plays an important
role in nucleotide and protein synthesis and in mitochondrial energy metabolism. Increased uptake and metabolism of Glutamine through glutaminolysis can
provide a proliferating cell with significant amount of
NADPH requirement [48]. Some cancer cells develop
addiction to Glutamine and become dependent on Glutamine to support cell growth and activation of signaling
molecules, e.g. mTOR kinase [49]. Recent studies have
explored the potential of targeting amino-oxyacetic acid
(AOA) for inhibition of cell proliferation in breast cancer xenograft models [50]. In a recent study, the expression of glutamine-related proteins was found to be
highest in HER-2 subtypes compared to other breast
cancer subtypes [51]. In our study, we found a higher
Cao et al. BMC Cancer 2014, 14:941
/>
level of Glutamine in HER-2pos compared to HER-2neg
tumors. The role of Glutamine metabolism in breast
cancer prognosis and treatment is still under investigation. However, increasing evidence suggests that alterations in cancer metabolism, especially the choline
phospholipid and amino acid metabolisms may provide
potential targets for treatment of breast cancer.
In 2010, the American Society of Clinical Oncology
(ASCO) and College of American Pathologists (CAP) issued guidelines that recommended the threshold for determining ER and PgR positivity to be decreased from
10% to 1%, in order to standardize the determination of
hormone receptor status by IHC and also to increase the
number of patients eligible for hormone therapy. In this
study, the 10% cutoff value was used according to The
Norwegian Breast Cancer Group recommendation at the
time of inclusion. There is an ongoing debate about
whether the decrease in ER and PgR threshold has led to
a group of false ERpos tumors. Studies have shown that
the majority of low ERpos tumors (≥1 < 10%) were identified as basal-like or HER-2 enriched tumors with pathological features more similar to ERneg than ERpos tumors,
while only a minority of low ERneg tumors was classified
as luminal A subtype [52-54]. In a large breast cancer
study by Engstrøm et al., only 24 out of 909 cases (2.7%)
showed positive staining for ER in ≥1 < 10% of the tumor
cells and were classified as ERpos according to the new
guidelines [6]. The authors found little or no change in
the Kaplan–Meier and Cox results when comparing the
new 1% cut-off with the previously 10% cut-off in their
study.
In our cohort, we found no correlation between the
metabolite profiles and tumor grade and also no correlation between the metabolite profiles and lymph node
status. We have previously investigated nodal metastasis
using metabolite data from the primary tumor using
PLS-DA, and the results showed only a weak correlation
with nodal spread [21]. Based on our results, the differences in the metabolite profiles observed are indeed
resulting from the hormone and growth receptor status
and not dependent on tumor grade or nodal metastasis.
This study is restricted by some limitations including
the small number of samples in each subgroup and the
lack of normal control tissues. Most of the patients in
this study were recruited less than 5 years ago, long term
follow-up is thus yet not available, however this aspect
will be important in future studies. In addition, it would
be interesting to investigate if Ki67 overexpression is associated with adverse metabolic profiles; Ki67 was not
included, however, as part of the standard histochemical
staining at the time of patient recruitment in our study.
Statins are a class of drugs that reduce the production of
cholesterol by inhibiting the enzyme HMG-CoA reductase. In a recent study, treatment with Lovastatin was
Page 10 of 12
shown to decrease choline-containing phospholipids and
inhibit the proliferation in breast cancer cells in vitro
[55]. The effects of statins on the metabolite profiles
should also be investigated in more details.
Breast cancer tumor heterogeneity is a common challenge. To minimize the effect of heterogeneity, we have
chosen to include only tumors with T1/T2 stages (<5 cm
in diameter) without distant metastasis. In this study,
the effect of heterogeneity on the metabolic profile when
sampling multiple biopsies was tested by comparing the
average correlation of 35 random pairs repeated 1000
times versus 35 pairs of sample from the same patient.
Our results show that the variation between patients is
significantly higher than the variation within a patient
(p-value < 0.001).
Conclusion
The classification of TNBC and TPBC tumors were successfully separated based on the metabolite profiles.
Choline levels were found to be higher in TNBC compared to TPBC, possibly related to tumor proliferation
and oncogenic signaling. TNBC tumors had a lower
level of Glutamine and a higher level of Glutamate compared to TPBC tumors, which indicates an increase in
glutaminolysis metabolism and suggests the development of glutamine dependent cell growth. The classification of ER, PgR and HER-2 status were also successful.
We found significantly higher levels of Glycine in HER2pos breast cancer, which supports the potential of Glycine as a marker for tumor aggressiveness. Further studies are needed to validate the potential of metabolic
markers as targets for personalized treatment of breast
cancer subtypes.
Abbreviations
AOA: Amino-oxyacetic acid; CHKA: Choline kinase alpha; CK5: Cytokeratin 5;
EGFR: Epithelial growth factor receptor; ER: Estrogen receptor; FDR: False
discovery rate; FISH: Fluorescence in situ hybridization;
GPC: Glycerophosphocholine; HER-2: Human epidermal growth factor
receptor-2/neu; HR MAS MRS: High resolution magic angle spinning
magnetic resonance spectroscopy; LV: Latent variables; NS: Number of scans;
PBS: Phosphate buffered saline; PC: Phosphocholine; pCR: Pathological
complete response; PgR: Progesterone receptor; PLS-DA: Partial least squares
discriminant analysis; SNR: Signal to noise ratio; tCho: Total choline;
TNBC: Triple negative breast cancer; TPBC: Triple positive breast cancer;
VIP: Variable importance in the projection.
Competing interests
The authors declare that they have no competing interests.
Authors’ contributions
MDC carried out the analysis and interpretation of data and drafted the
manuscript. SanL carried out the HR MAS MRS and imprint cytology
experiments and helped to draft the manuscript. GFG performed the Matlab
programming and preprocessing of the spectral data and helped to draft
the manuscript. AB analyzed the imprint cytology samples. SteL and HF
recruited the patients and collected the tumor biopsies. TFB participated in
the design of the study and interpretation of the results. All authors have
read and helped to revise the manuscript. The final manuscript is approved
by all the authors.
Cao et al. BMC Cancer 2014, 14:941
/>
Acknowledgements
This study was funded by the Central Norway Regional Health Authority
(RHA).
Author details
1
Department of Circulation and Medical Imaging, Norwegian University of
Science and Technology (NTNU), Trondheim, Norway. 2St. Olavs Hospital,
Trondheim University Hospital, Trondheim, Norway. 3Department of Cancer
Research and Molecular Medicine, NTNU, Trondheim, Norway. 4Cancer Clinic,
St. Olavs Hospital, Trondheim University Hospital, Trondheim, Norway.
5
Department of Laboratory Medicine and Children’s and Women’s Health,
NTNU, Trondheim, Norway. 6Department of Surgery, St. Olavs Hospital,
Trondheim University Hospital, Trondheim, Norway.
Page 11 of 12
18.
19.
20.
21.
Received: 9 May 2014 Accepted: 25 November 2014
Published: 12 December 2014
22.
References
1. Kaplan HG, Malmgren JA: Impact of triple negative phenotype on breast
cancer prognosis. Breast J 2008, 14:456–463.
2. Hirshfield KM, Ganesan S: Triple-negative breast cancer: molecular
subtypes and targeted therapy. Curr Opin Obstet Gynecol 2013, 26:34–40.
3. Xu H, Eirew P, Mullaly SC, Aparicio S: The omics of triple-negative breast
cancers. Clin Chem 2014, 60:122–133.
4. Stevens KN, Vachon CM, Couch FJ: Genetic susceptibility to triple-negative
breast cancer. Cancer Res 2013, 73:2025–2030.
5. Kreike B, van Kouwenhove M, Horlings H, Weigelt B, Peterse H, Bartelink H,
van de Vijver MJ: Gene expression profiling and histopathological
characterization of triple-negative/basal-like breast carcinomas. Breast
Cancer Res 2007, 9:R65.
6. Engstrom MJ, Opdahl S, Hagen AI, Romundstad PR, Akslen LA, Haugen OA,
Vatten LJ, Bofin AM: Molecular subtypes, histopathological grade and
survival in a historic cohort of breast cancer patients. Breast Cancer Res
Treat 2013, 140:463–473.
7. Hanahan D, Weinberg Robert A: Hallmarks of cancer: the next generation.
Cell 2011, 144:646–674.
8. Nordstrom A, Lewensohn R: Metabolomics: moving to the clinic. J
Neuroimmune Pharmacol 2010, 5:4–17.
9. Bathen TF, Geurts B, Sitter B, Fjosne HE, Lundgren S, Buydens LM,
Gribbestad IS, Postma G, Giskeodegard GF: Feasibility of MR metabolomics
for immediate analysis of resection margins during breast cancer
surgery. PLoS One 2013, 8:e61578.
10. Claudino WM, Goncalves PH, di Leo A, Philip PA, Sarkar FH: Metabolomics
in cancer: a bench-to-bedside intersection. Crit Rev Oncol Hematol 2012,
84:1–7.
11. Aboud OA, Weiss RH: New opportunities from the cancer metabolome.
Clin Chem 2013, 59:138–146.
12. Moestue SA, Borgan E, Huuse EM, Lindholm EM, Sitter B, Borresen-Dale AL,
Engebraaten O, Maelandsmo GM, Gribbestad IS: Distinct choline metabolic
profiles are associated with differences in gene expression for basal-like
and luminal-like breast cancer xenograft models. BMC Cancer 2010,
10:433.
13. Borgan E, Sitter B, Lingjaerde OC, Johnsen H, Lundgren S, Bathen TF, Sorlie
T, Borresen-Dale AL, Gribbestad IS: Merging transcriptomics and metabolomics–advances in breast cancer profiling. BMC Cancer 2010, 10:628.
14. Cuperlovic-Culf M, Chute IC, Culf AS, Touaibia M, Ghosh A, Griffiths S, Tulpan
D, Leger S, Belkaid A, Surette ME, Ouellette RJ: 1H NMR metabolomics
combined with gene expression analysis for the determination of major
metabolic differences between subtypes of breast cell lines. Chem Sci
2011, 2:2263–2270.
15. Martinez-Outschoorn UE, Prisco M, Ertel A, Tsirigos A, Lin Z, Pavlides S,
Wang C, Flomenberg N, Knudsen ES, Howell A, Pestell RG, Sotgia F, Lisanti
MP: Ketones and lactate increase cancer cell “stemness”, driving
recurrence, metastasis and poor clinical outcome in breast cancer:
achieving personalized medicine via Metabolo-Genomics. Cell Cycle 2011,
10:1271–1286.
16. Sitter B, Sonnewald U, Spraul M, Fjosne HE, Gribbestad IS: High-resolution
magic angle spinning MRS of breast cancer tissue. NMR Biomed 2002,
15:327–337.
17. Bertilsson H, Tessem MB, Flatberg A, Viset T, Gribbestad I, Angelsen A,
Halgunset J: Changes in gene transcription underlying the aberrant
23.
24.
25.
26.
27.
28.
29.
30.
31.
32.
33.
34.
35.
36.
37.
38.
39.
citrate and choline metabolism in human prostate cancer samples. Clin
Cancer Res 2012, 18:3261–3269.
Giskeodegard GF, Bertilsson H, Selnaes KM, Wright AJ, Bathen TF, Viset T,
Halgunset J, Angelsen A, Gribbestad IS, Tessem MB: Spermine and citrate
as metabolic biomarkers for assessing prostate cancer aggressiveness.
PLoS One 2013, 8:e62375.
Glunde K, Bhujwalla ZM, Ronen SM: Choline metabolism in malignant
transformation. Nat Rev Cancer 2011, 11:835–848.
Bathen TF, Jensen LR, Sitter B, Fjosne HE, Halgunset J, Axelson DE,
Gribbestad IS, Lundgren S: MR-determined metabolic phenotype of breast
cancer in prediction of lymphatic spread, grade, and hormone status.
Breast Cancer Res Treat 2007, 104:181–189.
Giskeodegard GF, Grinde MT, Sitter B, Axelson DE, Lundgren S, Fjosne HE,
Dahl S, Gribbestad IS, Bathen TF: Multivariate modeling and prediction of
breast cancer prognostic factors using MR metabolomics. J Proteome Res
2010, 9:972–979.
Cao MD, Sitter B, Bathen TF, Bofin A, Lonning PE, Lundgren S, Gribbestad IS:
Predicting long-term survival and treatment response in breast cancer
patients receiving neoadjuvant chemotherapy by MR metabolic profiling. NMR Biomed 2011, 25:369–378.
Cao MD, Giskeodegard GF, Bathen TF, Sitter B, Bofin A, Lonning PE,
Lundgren S, Gribbestad IS: Prognostic value of metabolic response in
breast cancer patients receiving neoadjuvant chemotherapy. BMC Cancer
2012, 12:39.
Sitter B, Lundgren S, Bathen TF, Halgunset J, Fjosne HE, Gribbestad IS:
Comparison of HR MAS MR spectroscopic profiles of breast cancer tissue
with clinical parameters. NMR Biomed 2006, 19:30–40.
Westerhuis J, Hoefsloot H, Smit S, Vis D, Smilde A, van Velzen E, van
Duijnhoven J, van Dorsten F: Assessment of PLSDA cross validation.
Metabolomics 2008, 4:81–89.
Mangia A, Chiriatti A, Chiarappa P, Incalza MA, Antonaci G, Pilato B, Simone
G, Tommasi S, Paradiso A: Touch imprint cytology in tumor tissue banks
for the confirmation of neoplastic cellularity and for DNA extraction.
Arch Pathol Lab Med 2008, 132:974–978.
Savorani F, Tomasi G, Engelsen SB: icoshift: a versatile tool for the rapid
alignment of 1D NMR spectra. J Magn Reson 2010, 202:190–202.
Chong I-G, Jun C-H: Performance of some variable selection methods
when multicollinearity is present. Chemometr Intell Lab Syst 2005,
78:103–112.
Prat A, Perou CM: Deconstructing the molecular portraits of breast
cancer. Mol Oncol 2011, 5:5–23.
Oakman C, Viale G, Di Leo A: Management of triple negative breast
cancer. Breast 2010, 19:312–321.
Shin HJ, Baek HM, Cha JH, Kim HH: Evaluation of breast cancer using
proton MR spectroscopy: total choline peak integral and signal-to-noise
ratio as prognostic indicators. AJR Am J Roentgenol 2012, 198:W488–W497.
Carey LA, Dees EC, Sawyer L, Gatti L, Moore DT, Collichio F, Ollila DW, Sartor
CI, Graham ML, Perou CM: The triple negative paradox: primary tumor
chemosensitivity of breast cancer subtypes. Clin Cancer Res 2007,
13:2329–2334.
Granata A, Nicoletti R, Tinaglia V, De Cecco L, Pisanu ME, Ricci A, Podo F,
Canevari S, Iorio E, Bagnoli M, Mezzanzanica D: Choline kinase-alpha by
regulating cell aggressiveness and drug sensitivity is a potential druggable target for ovarian cancer. Br J Cancer 2013, 110:330–340.
Mori N, Glunde K, Takagi T, Raman V, Bhujwalla ZM: Choline kinase downregulation increases the effect of 5-fluorouracil in breast cancer cells.
Cancer Res 2007, 67:11284–11290.
Shah T, Wildes F, Penet MF, Winnard PT Jr, Glunde K, Artemov D, Ackerstaff
E, Gimi B, Kakkad S, Raman V, Bhujwalla ZM: Choline kinase overexpression
increases invasiveness and drug resistance of human breast cancer cells.
NMR Biomed 2010, 23:633–642.
Hefti MM, Hu R, Knoblauch NW, Collins LC, Haibe-Kains B, Tamimi RM,
Beck AH: Estrogen receptor negative/progesterone receptor positive
breast cancer is not a reproducible subtype. Breast Cancer Res 2013,
15:R68.
Rubin I, Yarden Y: The basic biology of HER2. Ann Oncol 2001, 12:S3–S8.
Spector NL, Blackwell KL: Understanding the mechanisms behind
trastuzumab therapy for human epidermal growth factor receptor
2-positive breast cancer. J Clin Oncol 2009, 27:5838–5847.
Nahta R, Shabaya S, Ozbay T, Rowe DL: Personalizing HER2-targeted
therapy in metastatic breast cancer beyond HER2 status: what we have
Cao et al. BMC Cancer 2014, 14:941
/>
40.
41.
42.
43.
44.
45.
46.
47.
48.
49.
50.
51.
52.
53.
54.
55.
learned from clinical specimens. Curr Pharmacogenomics Person Med 2009,
7:263–274.
Giskeodegard GF, Lundgren S, Sitter B, Fjosne HE, Postma G, Buydens LM,
Gribbestad IS, Bathen TF: Lactate and glycine-potential MR biomarkers of
prognosis in estrogen receptor-positive breast cancers. NMR Biomed
2012, 25:1271–1279.
Sitter B, Bathen TF, Singstad TE, Fjosne HE, Lundgren S, Halgunset J,
Gribbestad IS: Quantification of metabolites in breast cancer patients
with different clinical prognosis using HR MAS MR spectroscopy. NMR
Biomed 2010, 23:424–431.
Davies NP, Wilson M, Natarajan K, Sun Y, MacPherson L, Brundler MA,
Arvanitis TN, Grundy RG, Peet AC: Non-invasive detection of glycine as a
biomarker of malignancy in childhood brain tumours using in-vivo 1H
MRS at 1.5 tesla confirmed by ex-vivo high-resolution magic-angle
spinning NMR. NMR Biomed 2010, 23:80–87.
Righi V, Andronesi OC, Mintzopoulos D, Black PM, Tzika AA: High-resolution
magic angle spinning magnetic resonance spectroscopy detects glycine
as a biomarker in brain tumors. Int J Oncol 2010, 36:301–306.
Jain M, Nilsson R, Sharma S, Madhusudhan N, Kitami T, Souza AL, Kafri R,
Kirschner MW, Clish CB, Mootha VK: Metabolite profiling identifies a key
role for glycine in rapid cancer cell proliferation. Science 2012,
336:1040–1044.
Osborne CK, Shou J, Massarweh S, Schiff R: Crosstalk between estrogen
receptor and growth factor receptor pathways as a cause for endocrine
therapy resistance in breast cancer. Clin Cancer Res 2005, 11:865s–870s.
Esteva FJ, Cheli CD, Fritsche H, Fornier M, Slamon D, Thiel RP, Luftner D,
Ghani F: Clinical utility of serum HER2/neu in monitoring and prediction
of progression-free survival in metastatic breast cancer patients treated
with trastuzumab-based therapies. Breast Cancer Res 2005, 7:R436–R443.
Di Gioia D, Dresse M, Mayr D, Nagel D, Heinemann V, Kahlert S, Stieber P:
Serum HER2 supports HER2-testing in tissue at the time of primary
diagnosis of breast cancer. Clin Chim Acta 2014, 430:486–491.
Wise DR, Thompson CB: Glutamine addiction: a new therapeutic target in
cancer. Trends Biochem Sci 2010, 35:427–433.
Nicklin P, Bergman P, Zhang B, Triantafellow E, Wang H, Nyfeler B, Yang H,
Hild M, Kung C, Wilson C, Myer VE, MacKeigan JP, Porter JA, Wang YK,
Cantley LC, Finan PM, Murphy LO: Bidirectional transport of amino acids
regulates mTOR and autophagy. Cell 2009, 136:521–534.
Thornburg JM, Nelson KK, Clem BF, Lane AN, Arumugam S, Simmons A,
Eaton JW, Telang S, Chesney J: Targeting aspartate aminotransferase in
breast cancer. Breast Cancer Res 2008, 10:R84.
Kim S, Kim do H, Jung WH, Koo JS: Expression of glutamine metabolismrelated proteins according to molecular subtype of breast cancer. Endocr
Relat Cancer 2013, 20:339–348.
Prabhu JS, Korlimarla A, Desai K, Alexander A, Raghavan R, Anupama C,
Dendukuri N, Manjunath S, Correa M, Raman N, Kalamdani A, Prasad M,
Gopinath KS, Srinath BS, Sridhar TS: A majority of low (1-10%) ER positive
breast cancers behave like hormone receptor negative tumors. J Cancer
2014, 5:156–165.
Deyarmin B, Kane JL, Valente AL, van Laar R, Gallagher C, Shriver CD,
Ellsworth RE: Effect of ASCO/CAP guidelines for determining ER status on
molecular subtype. Ann Surg Oncol 2013, 20:87–93.
Iwamoto T, Booser D, Valero V, Murray JL, Koenig K, Esteva FJ, Ueno NT,
Zhang J, Shi W, Qi Y, Matsuoka J, Yang EJ, Hortobagyi GN, Hatzis C,
Symmans WF, Pusztai L: Estrogen receptor (ER) mRNA and ER-related
gene expression in breast cancers that are 1% to 10% ER-positive by
immunohistochemistry. J Clin Oncol 2012, 30:729–734.
Klawitter J, Shokati T, Moll V, Christians U, Klawitter J: Effects of lovastatin
on breast cancer cells: a proteo-metabonomic study. Breast Cancer Res
2010, 12:R16.
doi:10.1186/1471-2407-14-941
Cite this article as: Cao et al.: Metabolic characterization of triple
negative breast cancer. BMC Cancer 2014 14:941.
Page 12 of 12
Submit your next manuscript to BioMed Central
and take full advantage of:
• Convenient online submission
• Thorough peer review
• No space constraints or color figure charges
• Immediate publication on acceptance
• Inclusion in PubMed, CAS, Scopus and Google Scholar
• Research which is freely available for redistribution
Submit your manuscript at
www.biomedcentral.com/submit