Identification of a novel microRNA signature associated with intrahepatic cholangiocarcinoma (ICC) patient prognosis
Bạn đang xem bản rút gọn của tài liệu. Xem và tải ngay bản đầy đủ của tài liệu tại đây (693.79 KB, 8 trang )
Zhang et al. BMC Cancer (2015) 15:64
DOI 10.1186/s12885-015-1067-6
RESEARCH ARTICLE
Open Access
Identification of a novel microRNA signature
associated with intrahepatic cholangiocarcinoma
(ICC) patient prognosis
Mei-Yin Zhang1,2†, Shu-Hong Li1,2,3†, Guo-Liang Huang4, Guo-He Lin1,2, Ze-Yu Shuang1,2,3, Xiang-Ming Lao1,2,3,
Li Xu1,2,3, Xiao-Jun Lin1,2,3, Hui-Yun Wang1,2* and Sheng-Ping Li1,2,3*
Abstract
Background: The clinical significance of microRNAs (miRNAs) in intrahepatic cholangiocarcinoma (ICC) is unclear.
The objective of this study is to examine the miRNA expression profiles and identify a miRNA signature for the
prognosis of ICC.
Methods: Using a custom microarray containing 1,094 probes, the miRNA expression profiles of 63 human ICCs
and nine normal intrahepatic bile ducts (NIBD) were assessed. The miRNA signatures were established and their
clinical significances in ICC were analyzed. The expression levels of some miRNAs were verified by quantitative
real-time RT-PCR (qRT-PCR).
Results: Expression profile analysis showed 158 differentially expressed miRNAs between ICC and NIBD, with 77
up-regulated and 81 down-regulated miRNAs. From the 158 differentially expressed miRNAs, a 30-miRNA signature
consisting of 10 up-regulated and 20 down-regulated miRNAs in ICC was established for distinguishing ICC from
NIBD with 100% accuracy. A separate 3-miRNA signature was identified for predicting prognosis in ICC. Based on
the 3-miRNA signature, a formula was constructed to compute a risk score for each patient. The patients with
high-risk had significantly lower overall survival and disease-free survival than those with low-risk. The expression
level of these three miRNAs detected by microarray was verified by qRT-PCR. Multivariate analysis indicated that the
3-miRNA signature was an independent prognostic predictor.
Conclusions: In this study, a 30-miRNA signature for distinguishing ICC from NIBD, and a 3-miRNA signature for
evaluating prognosis of ICC were established, which might be able to serve as biomarkers for prognosis of ICC.
Further studies focusing on these miRNAs may shed light on the mechanisms associated with ICC pathogenesis
and progression.
Keywords: microRNA, Intrahepatic cholangiocarcinoma, Biomarker, Prognosis
Background
Intrahepatic cholangiocarcinoma (ICC) is a high-grade
malignant neoplasm originating from the small bile duct
epithelium in the liver [1], and is the second most common
intrahepatic primary tumor after hepatocellular carcinoma
(HCC). It comprises 5.4% of primary liver neoplasms [2]
* Correspondence: ;
†
Equal contributors
1
State Key Laboratory of Oncology in South China, Sun Yat-Sen University
Cancer Center, Guangzhou 510060, China
2
National Collaborative Innovation Center for Cancer Medicine, Sun Yat-Sen
University Cancer Center, Guangzhou 510060, China
Full list of author information is available at the end of the article
and its incidence is increasing [3,4]. Curative resection is
still considered to be the only effective treatment; however,
the 5-year survival rate of patients with ICC after surgery is
low, at only 25% to 35% in most studies [5] and the recurrence rate at 5 years is as high as 67.9% [6]. Furthermore,
there is no molecular marker for predicting the prognosis
of patients with ICC in clinical practice and studies on molecular makers in ICC patients are limited. Therefore, identifying molecular marker for prognosis of ICC patients is
an urgent need in clinical practice.
MicroRNAs (miRNAs) are small (18–25 nucleotides)
non-coding single-stranded RNA molecules that negatively
© 2015 Zhang et al.; licensee BioMed Central. This is an Open Access article distributed under the terms of the Creative
Commons Attribution License ( which permits unrestricted use, distribution, and
reproduction in any medium, provided the original work is properly credited. The Creative Commons Public Domain
Dedication waiver ( applies to the data made available in this article,
unless otherwise stated.
Zhang et al. BMC Cancer (2015) 15:64
regulate gene expression by base-pair matching with the 3′
UTRs of target mRNAs [7] and are reported to be involved
in a variety of physiological and pathological processes,
including development, differentiation, apoptosis, proliferation and carcinogenesis [7,8]. Previous studies have
shown that miRNAs are dysregulated in many cancers
and the aberrantly expressed miRNAs might serve as
diagnostic and prognostic biomarkers for various tumors [9-17]. To date, there have only been three studies
on miRNA expression profiles in ICC tissue samples:
the first identified a 38-miRNA signature in 27 ICC tissues for distinguishing ICC from normal tissue [18], the
second established a 23-miRNA signature associated
with tumor subtypes and prognosis in 23 ICCs and
combined hepatocellular-cholangiocarcinomas [19], and
the third found that different miRNA profiles correlated
with the histological grade and the subtype of 15 ICCs
induced by liver fluke Opisthorchis viverrini [20]. Although miRNA profile studies on ICC tissues are very
limited, there are a number of single miRNA expression
studies on ICC tissues and cell lines. For examples,
some miRNAs were identified to be involved in ICC cell
growth and apoptosis (miR-31) [21], migration or invasion (miR-376c and miR-214) [22,23], metastasis [24],
and epithelial to mesenchymal transition (EMT) (miR200c and miR-204) [19,25]. However, the clinical significance of miRNA signatures in ICC still needs to be
elucidated because of small sample sizes and very limited studies. In this study, we analyzed the miRNA expression profiles in 63 patients with ICC and nine
normal intrahepatic bile ducts (NIBD) using a custom
microarray containing probes for 1,094 miRNAs. The
aim of the present study was to identify miRNA signatures that could be used as a biomarker for prognosis in
patients with ICC and provided insight for further investigation into the mechanisms involved in ICC development and progression.
Methods
Patients
All 63 patients (44 men, 19 women) with ICC who
underwent resection in the Hepatobiliary Department,
Sun Yat-Sen University Cancer Center, between 1999
and 2010, were included in this study. The ICC was
pathologically diagnosed at surgery and confirmed by a
separate experienced pathologist in this study. None of
these patients had received anticancer therapy, such as
radiotherapy or chemotherapy, before surgery. After hepatectomy, the patients were not given any other therapies
except the regular liver protection treatment. If patients
had hepatitis B virus (HBV) infection, serum alanine aminotransferase (ALT) elevation (>40 U/L) and serum positive for hepatitis B surface antigen (HBsAg), hepatitis B
extracellular antigen (HBeAg) and HBV DNA, they would
Page 2 of 8
undergo antiviral therapy. The NIBD were collected as
normal control from nine patients with HCC who underwent hepatectomy at Sun Yat-Sen University Cancer
Center between June and July in 2011 and were confirmed histologically to be free of tumors. This study
was reviewed and approved by the Human Research Ethics
Committee at Sun Yat-Sen University Cancer Center, and
written informed consent was obtained from patients.
The clinicopathologic information was obtained from
chart review and is listed in Table 1. The histological grade
(I-III) of tumor was determined according to the grading
system proposed by Edmondson and Steiner. All of the
patients were staged according to the American Joint
Committee on Cancer Staging Manual (Seventh Edition).
Follow-up
The patients were followed monthly in the first 2–3
months after surgery, then every 2–3 months in the first
year and 3–6 months thereafter. When tumor recurrence or metastasis was suspected, further examinations
including magnetic resonance imaging (MRI), positron
emission tomography/computed tomography (PET/CT)
and biopsies were performed. Besides the clinic interview, specialized staff followed patients via telephone.
The follow-up data of each patient was regularly updated.
The median follow-up time of the 63 patients was
18.3 months (ranging from 1 to 67.9 months). The overall
survival (OS) was computed from the date of hepatectomy
to the date of death, and disease-free survival (DFS) was
computed from the date of hepatectomy to the first relapse, distant metastasis, or death. During this follow-up
period, all the deaths were cancer-related.
Generation of custom miRNA microarray
We conducted the probe design with the protocol as
described by Wang and colleagues [26]. All of 1,112
human mature miRNAs (release 16) in the miRBase
database were used for designing probes, but only 1,094
human miRNA probes were successfully designed because of the high homology between some miRNAs. The
miRNA microarray was made in-house according to the
protocols previously reported by us [15].
RNA extraction and microarray experiments
The paraffin-embedded tissues from the 63 patients with
ICC were obtained from the Department of Pathology,
Sun Yat-Sen University Cancer Center. We cut five sections
with 10 μm thickness from each patient, and mounted
them onto glass slides. Tumor areas (containing > 90%
tumor tissue) were scraped off with a scalpel under a
microscope and collected in nuclease-free microcentrifuge
tubes. The NIBDs were peeled off from the resected liver.
Total RNA was extracted from ICC and NIBD with an acid
phenol-chloroform extraction method, followed by ethanol
Zhang et al. BMC Cancer (2015) 15:64
Page 3 of 8
Table 1 Comparison of characteristics of patients with ICC in high- or low risk groups
Characteristics
Gender
Age (years)
ALT (U/L)
AST (U/L)
TBIL (mmol/L)
HBsAg
AFP (ng/mL)
CA199 (U/L)
CEA (ng/mL)
Cirrhosis
Histological grade
T stage
N stage
TNM stage
n (%)
P value
No. of patients (%)
High-risk group
Low-risk group
Male
44 (69.8)
19 (65.5)
25 (73.5)
Female
19 (30.2)
10 (34.5)
9 (26.5)
<50
23 (36.5)
12 (41.4)
11 (32.4)
≥50
40 (63.5)
17 (58.6)
23 (67.6)
≤40
48 (76.2)
24 (82.8)
24 (70.6)
>40
15 (23.8)
5 (17.2)
10 (29.4)
≤45
55 (87.3)
26 (89.7)
29 (85.3)
>45
8 (12.7)
3 (10.3)
5 (14.7)
≤20.5
54 (85.7)
27 (93.1)
27 (79.4)
>20.5
9 (14.3)
2 (6.9)
7 (20.6)
Negative
35 (55.6)
17 (58.6)
18 (52.9)
Positive
28 (44.4)
12 (41.4)
16 (47.1)
≤25
59 (93.7)
26 (89.7)
33 (97.1)
>25
4 (6.3)
3 (10.3)
1 (2.9)
≤35
27 (42.9)
11 (37.9)
16 (47.1)
>35
36 (57.1)
18 (62.1)
18 (52.9)
≤5
46 (73.0)
19 (65.5)
27 (79.4)
>5
17 (27.0)
10 (34.5)
7 (20.6)
Yes
20 (31.7)
10 (34.5)
10 (29.4)
No
43 (68.3)
19 (65.5)
24 (70.6)
I + II
26 (41.3)
12 (41.4)
14 (41.2)
III
37 (58.7)
17 (58.6)
20 (58.8)
T1
35 (55.6)
16 (55.2)
19 (55.9)
T2a
5 (7.9)
1 (3.4)
4 (11.8)
T2b
17 (27.0)
9 (31.0)
8 (23.5)
T3
6 (9.5)
3 (10.3)
3 (8.8)
N0
44 (69.8)
17 (58.6)
27 (79.4)
N1
19 (30.2)
12 (41.4)
7 (20.6)
I + II
38 (60.3)
14 (48.3)
24 (70.6)
III + IV
25 (39.7)
15 (51.7)
10 (29.4)
0.490
0.458
0.258
0.716
0.160
0.651
0.326
0.466
0.216
0.666
0.987
0.630
0.073
0.071
ALT, alanine aminotransferase; AST, aspartate aminotransferase; TBIL, total bilirubin; HBsAg, hepatitis B surface antigen; AFP, alpha-fetoprotein; CA19-9,
carbohydrate antigen 19–9; CEA, carcinoembryonic antigen.
precipitation, as described previously [27]. Quantity and
quality of RNA were measured by using a NanoDrop™ 1000
(Thermo Fisher Scientific, MA, USA) spectrophotometer.
Total RNA (2.5 μg) from each sample was used for labeling with pCp-DY647 (Dharmacon, Lafayette, CO, USA)
and hybridized in accordance with published protocols
[15]. After hybridization, the microarray was scanned with
a LuxScan 10 K Microarray Scanner (CapitalBio, Beijing,
China) and the scanned images were gridded by using
GenePix Pro 6.0 software (Axon Instruments, Foster City,
CA, USA).
Quantitative reverse transcription PCR (qRT-PCR)
The reverse transcription (RT) was carried out in a volume
of 12.5 μL containing 500 ng of total RNA, 5 nmol/L of
Bulge-Loop™ miRNA RT specific primers (RiboBio Co.,
Guangzhou, PR China), 0.2 mmol/L dNTP, 40 U RNase inhibitor and 20 U M-MLV reverse transcriptase (Promega,
Madison, WI, USA) at 42°C for 60 minutes. The quantitative PCR (qPCR) reaction was performed in 15 μL volume
with 3 μL of RT products, 500 nmol/L each of Bulge-Loop
miRNA forward specific primer and universal reverse
primer, and 6.75 μL of GoTaq qPCR Master Mix
Zhang et al. BMC Cancer (2015) 15:64
Reagent (Promega) on LightCycler480 instrument (Roche
Diagnostics, Penzberg, Germany). U6 snRNA was used as
the internal control. The PCR amplification was performed according to the manufacturer’s instruction.
The comparative Ct method (ΔΔCt) was used to quantify miRNA expression, and the relative quantification
was calculated as 2-ΔΔCt to represent expression changes
of miRNA between ICC and NIBD.
Data process and statistical analysis
The raw microarray data were normalized by using
Quantile Normalization Software and then processed by
log 2 transformation. The normalized microarray data are
available at National Center for Biotechnology Information
Gene Expression Omnibus (accession number GSE53870).
The differential expression of miRNA was analyzed by
Significance Analysis of Microarrays (SAM, Stanford
University, CA) and Student’s t test. Hierarchical clustering analysis (HCL) was performed to assess differential expressions of miRNAs between ICC and NIBD and
miRNAs of interest by using Multi Experiment Viewer
(MEV, version 4.2).
Univariate Cox regression analysis was applied to search
for miRNAs associated with overall survival (OS). Multivariate Cox regression analysis was carried out to establish
a signature and develop a formula for OS prediction with
miRNAs that had P < 0.05 in univariate analysis. The formula was used to calculate the risk score for each patient.
The risk score = sum of coefficient of each miRNA × expression level of corresponding miRNA in the signature.
The patients were thus divided into a high-risk group and
a low-risk group by using the median risk score as the
threshold value. Kaplan-Meier analysis and the log-rank
test were employed to assess OS and disease-free survival
(DFS) of the two groups. The chi-square test or Fisher’s
exact test were used to analyze the correlations between
clinical characteristics and miRNA signature. Finally,
multivariate Cox regression analysis was used to access
if the miRNA signature was an independent prognostic
factor for OS. The SPSS 16.0 (Inc., Chicago IL, USA)
and GraphPad Prism 5 (San Diego, CA, USA) programs
were used for statistical analysis and data plotting.
Page 4 of 8
than a 2-fold change and low P values were selected from
the 158 miRNAs by using the SAM program (FDR = 0)
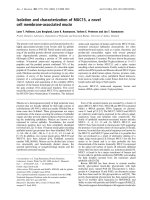
and t test. A 30-miRNA signature was developed by class
prediction and clustering, which reached the maximum
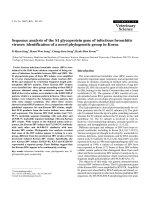
correct classification rate (100%) for ICC and NIBD tissues (Figure 1). Of the 30 miRNAs (Table 2), 10 were
up-regulated and 20 down-regulated in ICC. This result
suggested that the 30 miRNA for distinguishing ICC
from NIBD might be involved in ICC development and
progression.
Identification of novel 3-miRNA signature associated with
survival in ICC
To identify miRNAs whose expression pattern is significantly associated with the prognosis of ICC, the miRNAs
with expression in more than 10% of samples and displayed more than a 1.5-fold change in expression were
screened by univariate Cox regression analysis. Three
miRNAs (miR-675-5p, miR-652-3p and miR-338-3p) were
found to be significantly associated with OS (P < 0.05). Of
the three miRNAs, miR-675-5p was up-regulated and
negatively associated with OS (hazard ratio [HR]: 2.562,
confidence interval [CI]: 1.295-4.929), while the other two
(miR-652-3p and miR-338-3p) were down-regulated and
positively associated with OS (HR: 0.477, CI: 0.247-0.922;
HR: 0.498, CI: 0.257-0.966, respectively). To find the best
predictor for survival, we performed receiver operating
characteristic (ROC) analysis on single miRNAs, as well as
Results
Identification of a 30-miRNA signature to discriminate ICC
and NIBD
miRNA expression profiles of 63 ICCs and nine NIBD
were detected using our custom miRNA microarray.
SAM analysis (false discovery rate (FDR) was set to 0)
revealed that there were 158 miRNAs with differential
expression between ICC and NIBD samples. A total of 77
miRNAs were up-regulated and 81 were down-regulated
in ICC tissues, relative to NIBD samples. To identify a signature to distinguish ICC from NIBD, miRNA with more
Figure 1 Hierarchical clustering analysis of ICC and NIBD
samples with 30-miRNA signature. The 30-miRNA signature was
identified from 158 differentially expressed miRNAs between 63 ICCs
and nine NIBDs. Heat map representing the expression level of each
probe (rows) in the 30-miRNA signature (green color = low, and red
color = high) in each sample (columns). The 63 ICCs and nine NIBDs
were clustered into two groups by the 30-miRNA signature with
100% accuracy.
Zhang et al. BMC Cancer (2015) 15:64
Page 5 of 8
Table 2 Summary of 30 miRNAs associated with
distinguishing ICC from NIBD
No.
miRNA
Mean Int.
in ICC
Mean Int.
in NIBD
Ratio
(ICC/NIBD)
Expression
in ICC
1
miR-566
8177
1264
6.47
Up
2
miR-423-5p
7091
1906
3.72
Up
3
miR-612
4114
1129
3.64
Up
4
miR-765
7351
2074
3.54
Up
5
miR-625-3p
5218
1504
3.47
Up
6
miR-491-5p
2957
917
3.23
Up
7
miR-188-5p
5692
1819
3.13
Up
8
miR-92b-5p
5022
1686
2.98
Up
9
miR-675-5p
20464
8093
2.53
Up
10
miR-331-3p
2537
1045
2.43
Up
11
miR-141-3p
1162
2405
0.48
Down
12
miR-497-5p
897
1961
0.46
Down
13
miR-29a-3p
4118
9536
0.43
Down
14
let-7a-5p
3491
8203
0.43
Down
15
miR-19b-3p
1647
3883
0.42
Down
16
miR-103a-3p
1490
3532
0.42
Down
17
miR-130a-3p
981
2398
0.41
Down
18
let-7d-5p
1616
3997
0.40
Down
19
miR-100-5p
1343
3682
0.36
Down
20
miR-26b-5p
924
2558
0.36
Down
21
let-7e-5p
988
2819
0.35
Down
22
miR-24-3p
2737
7954
0.34
Down
23
miR-101-3p
580
1685
0.34
Down
24
let-7f-5p
1414
4140
0.34
Down
25
miR-99a-5p
1093
3314
0.33
Down
26
miR-338-3p
543
2095
0.26
Down
27
miR-29c-3p
1379
5357
0.26
Down
28
miR-26a-5p
3213
14510
0.22
Down
29
miR-451a
941
5163
0.18
Down
30
miR-143-3p
2842
23456
0.12
Down
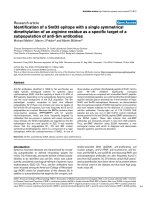
level of the three miRNAs, weighted by regression coefficient: Risk Score = (0.93 × expression level of miR-6755p) + (−0.726 × expression level of miR-652-3p) + (−0.688 ×
expression level of miR-338-3p). According to the risk
score, patients were divided into a high-risk group and a
low-risk group by the median signature risk score as the
cut-off point. Since five patients with the same median
risk score were designated into the low-risk group, there
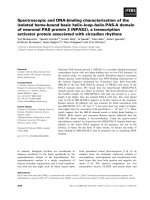
were 34 patients in the low-risk group and 29 in the highrisk group. Survival analysis showed that the patients in
the low-risk group had 1- and 2-year survival rates of
88.1% and 57.4%, respectively, while the patients in the
high-risk group had 1- and 2-year survival rates of 54.4%
and 41.4%, respectively. The median OS was 14 months
for the high-risk group compared with 26.5 months for
the low-risk group (P = 0.004; Figure 2A). In addition, the
median DFS was 4.4 months for the high-risk group and
17.3 months for the low-risk group (P =0.029; Figure 2B).
Kaplan-Meier survival analysis of the patients in the two
subgroups revealed that OS and DFS rates in the high-risk
Int., Intensity.
different combinations of the three miRNAs. In decreasing order of performance, the results showed that the predictive performance of the 3-miRNA signature is the best
(area under the curve (AUC): 0.747, P = 0.002), followed
by single miR-675-5p (AUC: 0.686, P = 0.021), the combination of miR-675-5p and miR-652-3p (AUC: 0.686, P =
0.021), the combination of miR-675-5p and miR-338-3p
(AUC: 0.686, P = 0.021), single miR-652-3p (AUC: 0.622,
p = 0.130), single miR-338-3p (AUC: 0.622, P = 0.130),
and the combination of miR-652-3p and miR-338-3p
(AUC: 0.587, P = 0.281). Next, a previously developed
strategy [15] was used to establish a formula to calculate
the risk score for every patient based on the expression
Figure 2 Survival analysis of ICC patients in high- or low-risk
groups. According to the risk score of the 3-miRNA signature, ICC
patients were divided into high- and low-risk groups. (A) Kaplan-Meier
curve analysis of overall survival (OS) of ICC patients in high- and
low-risk groups. (B) Kaplan-Meier curve analysis of disease-free survival
(DFS) of ICC patients in high- and low-risk groups.
Zhang et al. BMC Cancer (2015) 15:64
group were significantly lower than those in the low-risk
group (Figure 2).
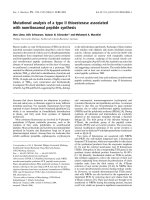
Expression levels of 3-miRNA signature validated by RT-PCR
To confirm the miRNA expression level detected by the
microarray, we carried out qRT-PCR for miR-675-5p,
miR-652-3p, and miR-338-3p in ICC samples and NIBD
tissues. The results showed that the expression levels of
the three miRNAs detected by microarray significantly
correlated with those measured by qRT-PCR (miR-675-5p,
R = 0.566, P = 0.0012; miR-652-3p, R = 0.761, P < 0.0001;
miR-338-3p, R = 0.623, P = 0.0009) (Figure 3). These results
show that miRNA levels detected by microarray are reliable and can be used for the further study.
Page 6 of 8
analyzed by Cox regression model. The univariate Cox
regression analysis indicated that the 3-miRNA signature, the alpha-fetoprotein (AFP), T stage, N stage and
TNM stage were significant predictors for OS (P = 0.006,
P = 0.047, P = 0.007, P = 0.001 and P < 0.001, respectively).
In the multivariate analysis, the 3-miRNA signature (HR:
2.13, 95% CI: 1.108 - 4.107; P = 0.023) and TNM stage
(HR: 3.37, 95% CI: 1.733 - 6.651; P < 0.001) were independent prognostic factors for OS (Table 3).
Univariate and multivariate Cox regression analysis of the
3-miRNA signature and clinical variables
Discussion
Using a custom microarray containing 1,094 probes for
human miRNAs, we detected microRNA profiles in 63
ICC patients, which is the largest sample size in such
studies of ICC so far. The relationships between microRNA expression levels and survival, as well as other clinical
features in these patients, were analyzed. Our data showed
that 158 miRNAs (77 up-regulated miRNAs and 81 downregulated) were differentially expressed in tumor tissues
compared with NIBD, and a 30-miRNA signature was
established for discriminating ICC from NIBD with 100%
accuracy. More important, we established a 3-miRNA signature that was an independent predictor for the survival
of patients with ICC.
Comparing the 3-mRNA signature with the 30-miRNA
signature, we found that miR-675-5p and miR-338-3p
were shared between the two signatures, while miR-652-
To further verify whether the signature was an independent prognostic factor, the signature and clinical
variables in all of the 63 patients with ICC were
Table 3 Univariate and multivariate analysis of clinical
features associated with overall survival
The relationship between 3-miRNA signature and
clinicopathological features
We next explored whether the 3-miRNA signature was
correlated with clinicopathological features of ICC (Table 1).
With the chi-square test, the 3-miRNA signature was
found to be marginally significantly with tumor-nodemetastasis (TNM) stage (P = 0.071), while no statistically
significant associations were observed between 3-miRNA
signature and other clinicopathological features (Table 1).
Characteristics
HR (95.0% CI)
P value
UNIVARIATE ANALYSIS
Figure 3 The expression levels of three miRNAs detected with
microarray were verified by qRT-PCR. Histogram plot indicating
that the expression levels of three miRNAs (miR-675-5p, miR-652-3p
and miR-338-3p) measured by microarray were concordant with
those by qRT-PCR, and Spearman correlation analysis showed the high
correlations (see the Results section for details) between the expression
levels of each miRNA detected by microarray and qRT-PCR.
3-miRNA signature (high-risk vs. low-risk)
2.49 (1.300-4.750)
0.006
Gender (M vs. F)
1.49 (0.699-3.153)
0.303
Age (≥50 vs. <50)
1.30 (0.665-2.557)
0.439
ALT (>40 vs. ≤40)
0.69 (0.302-1.572)
0.375
AST (>45 vs. ≤45)
0.63 (0.220-1.781)
0.38
TBIL (>20.5 vs. ≤20.5)
0.57 (0.222-1.469)
0.245
HBsAg (Positive vs. Negative)
0.90 (0.475-1.714)
0.755
AFP (≤25 vs. >25)
3.43 (1.014-11.574)
0.047
CA19-9 (>35 vs. ≤35)
1.91 (0.977-3.746)
0.058
CEA (>5 vs. ≤5)
1.81 (0.909-3.611)
0.091
Cirrhosis (Yes vs. No)
1.32 (0.669-2.613)
0.442
Edmondson Steiner grade (I + II vs. III)
1.02 (0.533-1.953)
0.951
T stage (T2b + T3 vs. T1 + T2a)
2.48 (1.282-4.780)
0.007
N stage (N1 vs. N0)
3.07 (1.587-5.920)
0.001
TNM stage (III + IV vs. I + II)
3.72 (1.933-7.177)
<0.001
3-miRNA signature (high-risk vs. low-risk)
2.13 (1.108-4.107)
0.023
TNM stage (III + IV vs. I + II)
3.37 (1.733-6.651)
<0.001
MULTIVARIATE ANALYSIS
Zhang et al. BMC Cancer (2015) 15:64
3p was not included in the 30-miRNA signature. The reason for this phenomenon was that miRNAs with more
than 2-fold change were selected for establishing the
signature for distinguishing ICC from NIBD, while those
with more than 1.5-fold change were chosen for constructing the prognostic signature. Consequently, miR652-3p (1.52-fold change) was not presented in the
30-miRNA signature.
In the literature, there are only a few studies on miRNA
profiles in human intrahepatic cholangiocarcinoma. In
2009, Chen et al. [18] identified a 38-miRNA signature by
PCR array (containing only 156 miRNAs), which could
discriminate ICC from normal cholangiocyte. When compared with the 38-miRNA signature, we found that our
30-miRNA signature only shared three miRNAs in common with the 38-miRNA signature. Specifically, miR-338
and let-7a were consistently reduced in ICC in the two
studies, while the miR-103 was up-regulated in Chen’s
study and downregulated in our study. The miRNA discrepancy between the two signatures might be caused by
the different number of miRNAs (1,094 versus 156) and
cases (63 versus 27), the different clinical features of patients, or the particular samples used in the two different
studies. In the same year, Selaru et al. [28] performed a
miRNA microarray (containing probes for 470 unique human miRNAs) on five pairs of primary cholangiocarcinoma (CCA) and normal bile duct specimens (NBDs),
and listed the top 10 up-regulated and 10 down-regulated
miRNAs. Not surprisingly, only one miRNA (hsa-miR513) was consistent with our differentially expressed miRNAs, suggesting that the biological characteristic of CCA
is different from ICC. In 2012, another study reported that
a 23-miRNA signature, identified in two subtypes of 23
ICCs, was associated with the survival of patients with hepatocellular carcinoma [19], demonstrating the shared
properties between ICC and HCC. In October of this
year, Plieskatt et al. reported a miRNA profiling study
on 15 ICCs caused by liver fluke Opisthorchis viverrini,
in which they focused on the relationship between
miRNA expression profiles and histological grades, as
well as subtypes of ICC, and compared the differential
miRNA expression profiles between ICC and liver tissues [20]. Despite the study’s similar investigation into
miRNAs in ICC, there was no comparability between
our study and Plieskatt’s study.
However, there have been no reports on a miRNA signature associated with survival of ICC patients to date. As
the survival-related miRNA signature may potentially help
clinicians identify patients at a higher risk or lower risk and
choose the appropriate treatment, it will be very important
in improving the prognosis and treatment of patients with
ICC. With the data from our custom microarray, we have
developed the first survival-related miRNA signature, consisting of three miRNAs, which is significantly associated
Page 7 of 8
with OS and DFS in 63 patients with ICC. The novel 3miRNA signature was statistically significant in both univariate and multivariate Cox regression analyses (Table 3),
which suggest that the 3-miRNA signature may be a useful
prognostic indicator for survival in patients with ICC and
may have clinical utility. Of the three miRNAs, miR-675
has been reported to be over expressed and correlates with
survival of pancreatic cancer patients [29], and miR-338-3p
was down-regulated and associated with prognosis of colorectal carcinoma [30], which supports a similar expression
pattern for these miRNAs in other cancers. However, miR338 has been reported to be over-expressed and linked to a
poor outcome in gastric cancer [31], which is inconsistent
with the pattern we observed for miR-338 in ICC. This discrepancy might be caused by the different kinds of cancers
in the two studies (ICC vs. gastric cancer). Considering that
the three miRNAs (miR-675-5p, miR-652-3p and miR-3383p) are highly dysregulated in ICC and other cancers, these
miRNAs may play an important role in ICC carcinogenesis. Therefore, we are conducting further studies on the
biological function and the regulation of miR-675-5p and
miR-652-3p expression in ICC cells.
With univariate Cox regression analysis, AFP concentration was found to be associated with overall survival.
Kaplan-Meier curve analysis also showed that patients
with high-level AFP had much poorer survival than those
with low-level AFP (P <0.05, data not shown). However,
no report has shown that high-level AFP is correlated with
overall survival of ICC patients. Moreover, we found that
all of the four patients with higher AFP concentration died
within 18 months after surgery. Therefore, we speculate
that this significant correlation might be caused by the
statistical bias because of the very limited sample size of
patient with high-level AFP.
Conclusions
In conclusion, we have established a 30-miRNA signature
that can discriminate ICC tissues from normal intrahepatic bile duct and a 3-miRNA signature that is associated
with the survival of ICC patients after resection. Importantly, the 3-miRNA signature may be a potential new biomarker for the prognosis of patients with ICC. In addition,
the miRNAs identified in the two signatures might be involved in ICC carcinogenesis. Our results warrant further
studies on these miRNAs that will shed light on the mechanisms associated with ICC pathogenesis and progression.
Abbreviations
AFP: Alpha-fetoprotein; ALT: Alanine aminotransferase; AST:
Aspartate aminotransferase; CA19-9: Carbohydrate antigen 19–9;
CCA: Cholangiocarcinoma; CEA: Carcinoembryonic antigen; CI: Confidence
interval; DFS: Disease-free survival; EMT: Epithelial to mesenchymal
transition; FDR: False discovery rate; HBsAg: Hepatitis B surface antigen;
HCC: Hepatocellular carcinoma; HCL: Hierarchical clustering analysis;
HR: Hazard ration; ICC: Intrahepatic cholangiocarcinoma; Int.: Intensity;
MEV: Multi experiment viewer; miRNAs: microRNAs; MRI: Magnetic resonance
Zhang et al. BMC Cancer (2015) 15:64
imaging; NBDs: Normal bile duct specimens; NIBD: Normal intrahepatic bile
duct; OS: Overall survival; qRT-PCR: Quantitative real-time RT-PCR; RT: Reverse
transcription; SAM: Significance analysis of microarrays; TBIL: Total bilirubin.
Competing interests
The authors declare that they have no competing interests.
Authors’ contributions
SPL and HYW designed the research. MYZ and SHL performed experiments
and drafted the manuscript. GLH, LGH, ZYS, XML, LX and XJL participated in
the coordination and helped to draft the manuscript. All authors have read
and approved the final manuscript.
Acknowledgements
This study was supported by National Natural Science Foundation of China
(Grant 81171890) and Guangdong Natural Science Foundation of China
(Grant S2011010004047).
Author details
1
State Key Laboratory of Oncology in South China, Sun Yat-Sen University
Cancer Center, Guangzhou 510060, China. 2National Collaborative Innovation
Center for Cancer Medicine, Sun Yat-Sen University Cancer Center,
Guangzhou 510060, China. 3Department of Hepatobiliary Oncology, Sun
Yat-Sen University Cancer Center, Guangzhou 510060, China. 4Sino-American
Cancer Research Institute, Guangdong Medical College, Dongguan 523808,
China.
Received: 12 June 2014 Accepted: 2 February 2015
References
1. Chen MF. Peripheral cholangiocarcinoma (cholangiocellular carcinoma):
clinical features, diagnosis and treatment. J Gastroenterol Hepatol.
1999;14:1144–9.
2. Liver Cancer Study Group of Japan. Primary liver cancer in Japan.
Clinicopathologic features and results of surgical treatment. Ann Surg.
1990;211:277–87.
3. McGlynn KA, Tarone RE, El-Serag HB. A comparison of trends in the incidence
of hepatocellular carcinoma and intrahepatic cholangiocarcinoma in the
United States. Cancer Epidemiol Biomarkers Prev. 2006;15:1198–203.
4. Shaib YH, Davila JA, McGlynn K, El-Serag HB. Rising incidence of intrahepatic
cholangiocarcinoma in the United States: a true increase? J Hepatol.
2004;40:472–7.
5. Maithel SK, Gamblin TC, Kamel I, Corona-Villalobos CP, Thomas M, Pawlik
TM. Multidisciplinary approaches to intrahepatic cholangiocarcinoma.
Cancer. 2013;119:3929–42.
6. Hyder O, Hatzaras I, Sotiropoulos GC, Paul A, Alexandrescu S, Marques H,
et al. Recurrence after operative management of intrahepatic
cholangiocarcinoma. Surgery. 2013;153:811–8.
7. Bartel DP. MicroRNAs: genomics, biogenesis, mechanism, and function. Cell.
2004;116:281–97.
8. Harfe BD. MicroRNAs in vertebrate development. Curr Opin Genet Dev.
2005;15:410–5.
9. Wu X, Weng L, Li X, Guo C, Pal SK, Jin JM, et al. Identification of a
4-microRNA signature for clear cell renal cell carcinoma metastasis and
prognosis. PLoS One. 2012;7:e35661.
10. Jones KB, Salah Z, Del Mare S, Galasso M, Gaudio E, Nuovo GJ, et al. miRNA
signatures associate with pathogenesis and progression of osteosarcoma.
Cancer Res. 2012;72:1865–77.
11. Slaby O, Redova M, Poprach A, Nekvindova J, Iliev R, Radova L, et al.
Identification of MicroRNAs associated with early relapse after nephrectomy
in renal cell carcinoma patients. Genes Chromosomes Cancer. 2012;51:707–16.
12. Jiang J, Gusev Y, Aderca I, Mettler TA, Nagorney DM, Brackett DJ, et al.
Association of MicroRNA expression in hepatocellular carcinomas with
hepatitis infection, cirrhosis, and patient survival. Clin Cancer Res: Off J Am
Assoc Cancer Res. 2008;14:419–27.
13. Budhu A, Jia HL, Forgues M, Liu CG, Goldstein D, Lam A, et al. Identification
of metastasis-related microRNAs in hepatocellular carcinoma. Hepatology.
2008;47:897–907.
Page 8 of 8
14. Calin GA, Ferracin M, Cimmino A, Di Leva G, Shimizu M, Wojcik SE, et al. A
MicroRNA signature associated with prognosis and progression in chronic
lymphocytic leukemia. N Engl J Med. 2005;353:1793–801.
15. Wei R, Huang GL, Zhang MY, Li BK, Zhang HZ, Shi M, et al. Clinical
significance and prognostic value of microRNA expression signatures in
hepatocellular carcinoma. Clin Cancer Res: Off J Am Assoc Cancer Res.
2013;19:4780–91.
16. Liu N, Chen NY, Cui RX, Li WF, Li Y, Wei RR, et al. Prognostic value of a
microRNA signature in nasopharyngeal carcinoma: a microRNA expression
analysis. Lancet Oncol. 2012;13:633–41.
17. Huang L, Lin JX, Yu YH, Zhang MY, Wang HY, Zheng M. Downregulation of
six microRNAs is associated with advanced stage, lymph node metastasis
and poor prognosis in small cell carcinoma of the cervix. PLoS One.
2012;7:e33762.
18. Chen L, Yan HX, Yang W, Hu L, Yu LX, Liu Q, et al. The role of microRNA
expression pattern in human intrahepatic cholangiocarcinoma. J Hepatol.
2009;50:358–69.
19. Oishi N, Kumar MR, Roessler S, Ji J, Forgues M, Budhu A, et al.
Transcriptomic profiling reveals hepatic stem-like gene signatures and
interplay of miR-200c and epithelial-mesenchymal transition in intrahepatic
cholangiocarcinoma. Hepatology. 2012;56:1792–803.
20. Plieskatt JL, Rinaldi G, Feng Y, Peng J, Yonglitthipagon P, Easley S, et al.
Distinct miRNA signatures associate with subtypes of cholangiocarcinoma
from infection with the tumourigenic liver fluke Opisthorchis viverrini.
J Hepatol. 2014;61:850–8.
21. Hu C, Huang F, Deng G, Nie W, Huang W, Zeng X. miR-31 promotes
oncogenesis in intrahepatic cholangiocarcinoma cells via the direct
suppression of RASA1. Exp Therapeutic Med. 2013;6:1265–70.
22. Zeng B, Li Z, Chen R, Guo N, Zhou J, Zhou Q, et al. Epigenetic regulation of
miR-124 by hepatitis C virus core protein promotes migration and invasion
of intrahepatic cholangiocarcinoma cells by targeting SMYD3. FEBS Lett.
2012;586:3271–8.
23. Iwaki J, Kikuchi K, Mizuguchi Y, Kawahigashi Y, Yoshida H, Uchida E, et al.
MiR-376c down-regulation accelerates EGF-dependent migration by
targeting GRB2 in the HuCCT1 human intrahepatic cholangiocarcinoma cell
line. PLoS One. 2013;8:e69496.
24. Li B, Han Q, Zhu Y, Yu Y, Wang J, Jiang X. Down-regulation of miR-214
contributes to intrahepatic cholangiocarcinoma metastasis by targeting
Twist. FEBS J. 2012;279:2393–8.
25. Qiu YH, Wei YP, Shen NJ, Wang ZC, Kan T, Yu WL, et al. miR-204 Inhibits
epithelial to mesenchymal transition by targeting slug in intrahepatic
cholangiocarcinoma cells. Cellular Physiol Biochem: Int J Exp Cellular Physiol,
Biochem Pharmacol. 2013;32:1331–41.
26. Wang H, Ach RA, Curry B. Direct and sensitive miRNA profiling from
low-input total RNA. RNA. 2007;13:151–9.
27. Korbler T, Grskovic M, Dominis M, Antica M. A simple method for RNA
isolation from formalin-fixed and paraffin-embedded lymphatic tissues.
Exp Mol Pathol. 2003;74:336–40.
28. Selaru FM, Olaru AV, Kan T, David S, Cheng Y, Mori Y, et al. MicroRNA-21 is
overexpressed in human cholangiocarcinoma and regulates programmed
cell death 4 and tissue inhibitor of metalloproteinase 3. Hepatology.
2009;49:1595–601.
29. Schultz NA, Andersen KK, Roslind A, Willenbrock H, Wojdemann M,
Johansen JS. Prognostic microRNAs in cancer tissue from patients operated
for pancreatic cancer–five microRNAs in a prognostic index. World J Surg.
2012;36:2699–707.
30. Sun K, Su G, Deng H, Dong J, Lei S, Li G. Relationship between miRNA-338-3p
expression and progression and prognosis of human colorectal carcinoma.
Chin Med J (Engl). 2014;127:1884–90.
31. Li X, Zhang Y, Ding J, Wu K, Fan D. Survival prediction of gastric cancer by a
seven-microRNA signature. Gut. 2010;59:579–85.