Differential regulation of MAGE-A1 promoter activity by BORIS and Sp1, both interacting with the TATA binding protein
Bạn đang xem bản rút gọn của tài liệu. Xem và tải ngay bản đầy đủ của tài liệu tại đây (976.62 KB, 15 trang )
Schwarzenbach et al. BMC Cancer 2014, 14:796
/>
RESEARCH ARTICLE
Open Access
Differential regulation of MAGE-A1 promoter
activity by BORIS and Sp1, both interacting with
the TATA binding protein
Heidi Schwarzenbach1*, Corinna Eichelser1, Bettina Steinbach1, Josefine Tadewaldt1, Klaus Pantel1,
Victor Lobanenkov2 and Dmitri Loukinov2
Abstract
Background: As cancer-testis MAGE-A antigens are targets for tumor immunotherapy, it is important to study
the regulation of their expression in cancers. This regulation appears to be rather complex and at the moment
controversial. Although it is generally accepted that MAGE-A expression is controlled by epigenetics, the exact
mechanisms of that control remain poorly understood.
Methods: We analyzed the interplay of another cancer-testis gene, BORIS, and the transcription factors Ets-1 and
Sp1 in the regulation of MAGE-A1 gene expression performing luciferase assays, quantitative real-time PCR, sodium
bisulfite sequencing, chromatin immunoprecipitation assays and pull down experiments.
Results: We detected that ectopically expressed BORIS could activate and demethylate both endogenous and
methylated reporter MAGE-A1 promoter in MCF-7 and micrometastatic BCM1 cancer cell lines. Overexpression
of Ets-1 could not further upregulate the promoter activity mediated by BORIS. Surprisingly, in co-transfection
experiments we observed that Sp1 partly repressed the BORIS-mediated stimulation, while addition of Ets-1
expression plasmid abrogated the Sp1 mediated repression of MAGE-A1 promoter. Both BORIS and Sp1 interacted
with the TATA binding protein (hTBP) suggesting the possibility of a competitive mechanism of action between
BORIS and Sp1.
Conclusions: Our findings show that BORIS and Sp1 have opposite effects on the regulation of MAGE-A1 gene
expression. This differential regulation may be explained by direct protein-protein interaction of both factors or by
interaction of MAGE-A1 promoter with BORIS alternatively spliced isoforms with different sequence specificity. We
also show here that ectopic expression of BORIS can activate transcription from its own locus, inducing all its splice
variants.
Keywords: DNA methylation, Histone modifications, Promoter activation, Protein protein interaction
Background
Based on their pronounced tumor specificity, cancer-testis
antigens (CTA) which comprise numerous gene families,
such as MAGE-A, are particularly promising targets for
specific anti-cancer immunotherapy. Clinical studies
have demonstrated vaccination-induced T-cell mediated
responses in cancer patients by CTA [1]. The MAGE-A
gene family comprising 12 members (MAGE-A1-12) is
* Correspondence:
1
Department of Tumor Biology, University Medical Center
Hamburg-Eppendorf, Martinistraße 52, Hamburg 20246, Germany
Full list of author information is available at the end of the article
located on chromosome X [2]. With the exception of
testicular germ cells (spermatogonia and primary
spermatocytes) and placenta, they are silent in normal
somatic tissues, but expressed in numerous epithelial
carcinomas and leukemia [3]. Nevertheless, the MAGE-A
protein levels can vary widely in tumors, and not all
tumors express these antigens. Previous studies revealed
that control of MAGE-A expression is rather complex
and to a large extent poorly understood. The restricted
expression pattern of MAGE-A antigens is regulated
by epigenetic mechanisms [4]. Methylation of CpG
dinucleotides on the MAGE-A1 promoter prevents access
© 2014 Schwarzenbach et al.; licensee BioMed Central Ltd. This is an Open Access article distributed under the terms of the
Creative Commons Attribution License ( which permits unrestricted use,
distribution, and reproduction in any medium, provided the original work is properly credited. The Creative Commons Public
Domain Dedication waiver ( applies to the data made available in this
article, unless otherwise stated.
Schwarzenbach et al. BMC Cancer 2014, 14:796
/>
of transcription factors Ets-1 and Sp1 to their binding sites
which are responsible for the transcriptional activation of
MAGE-A genes [5]. Histone deacetylation, leading to
a compact and transcriptionally inactive chromatin
structure, also contributes to the repression of MAGE-A
genes [6].
In general, histones are subject to post-translational
modifications, such as acetylation, phosphorylation,
ubiquitination and methylation [7]. Deacetylation of
acetylated N-terminal tails of histones in active chromatin
regions occurs through histone deacetylases (HDACs) [8].
Methylation of the lysine residue 4 of histone H3 (H3K4)
is highly conserved and associated with transcriptionally
active genes. Methylation of the lysine residue 9 of histone
H3 (H3K9) recruits the heterochromatin protein HP-1,
which condenses chromatin into an inactive conformation
[9]. Both DNA methylation and histone modifications
may be linked by methyl-CpG binding proteins (MBDs).
Nearly all members of the MBD family can interact with
histone methyltransferases and deacetylases. To date, five
MBDs (MBD1, MBD2, MBD3, MBD4 and MeCP2) have
been identified and are involved in the transcriptional
repression of methylated DNA [10]. We observed that
among the MBDs, the variant MBD1v1 of the five
MBD1 isoforms has the ability to repress the
unmethylated MAGE-A1 promoter and downregulate
Ets-mediated transcriptional activation [11]. This
MBD1v1-mediated downregulation of MAGE-A1 gene
expression is dependent on three CXXC domains, which
additionally repress unmethylated promoters [12].
Conversely, we showed that MBD2a may enhance the basal
promoter activity of MAGE-A1 [11]. In line with our
observation, a previous report demonstrated that the
longer form of MBD2, the isoform MBD2a, is not only
involved in gene repression but also in promoting
activation of the unmethylated cAMP-responsive genes by
interaction with the RNA helicase A, and accordingly,
MBD2a may be either a transcriptional activator or
repressor [13].
The ectopic expression of BORIS (Brother of the
Regulator of Imprinted Sites), the mammalian CTCF
paralog, may induce the expression of MAGE-A1 gene
[14]. Like MAGE-A1, BORIS is a CTA, and in addition
to its normal expression in male germ cells, BORIS
is expressed in various solid tumors, with frequent
co-expression of other CTAs [15]. The transcription
of BORIS is regulated by three alternative promoters
(A, B, C) utilizing five distinct 5´UTRs (untranslational
regions) [16]. So far, 23 BORIS splice variants with distinct
expression profiles in normal germ line and cancer cells
have been characterized, exhibiting differential DNA
binding activities and varying transcriptional properties. These alternative transcripts have the potential to encode 17 distinct proteins with varying number of zinc
Page 2 of 15
fingers in the DNA binding domain and different
combinations of amino- and carboxy-termini. In vitro
binding of BORIS isoforms to DNA targets can be
methylation-sensitive and depends on the number and
specific composition of zinc fingers. Nine of the 17
in vitro translated BORIS isoproteins bound the H19
ICR CTCF target site, whereas the remaining other 8
BORIS isoforms did not. The presence of a specific
long amino terminus in the different isoforms is
necessary and sufficient to activate the testis-specific cerebroside sulfotransferase (CST) transcription. Accordingly,
isoforms B2, B3, B4 and B5 lacking this long amino
terminus could bind to CST, but did not induce transcription above background level [17]. Recent experiments in
cell lines suggested that BORIS expression is sufficient to
simultaneously demethylate and activate the transcription
of CTAs and oncogenes [14,18,19]. However, analyses
of melanoma tissue samples, where MAGE-A1 may
be expressed in the absence of BORIS, indicated that
MAGE-A1 expression can also be induced by other
mechanisms [20]. In addition to its role as a putative
component in aberrant DNA demethylation and transcriptional activation, BORIS may also participate in histone
demethylation and chromatin remodelling [21,22].
In the current study, we investigated the role of BORIS
in the context of transcription factors Ets-1 and Sp1,
known to be implicated in MAGE gene regulation, in
the activation of MAGE-A1 expression. We found that
BORIS can activate MAGE-A1, both at the endogenous
transcript level and in reporter assays. Ectopic Sp1 expression partly abrogates this BORIS-induced activation, while
ectopic Ets-1 lifts the repressive effect of Sp1. Interaction
of both BORIS and Sp1 with the TATA binding protein
(hTBP) is also established in our manuscript. Moreover,
the impact of BORIS on the epigenetic signature associated
with the MAGE-A1 promoter and its interaction with the
transcription factors were analyzed.
Methods
Cell lines and drug treatment regimens
The cancer cell lines MDA-MB-468 and MCF-7 (breast
adenocarcinoma) were cultured in DMEM (Invitrogen,
Karlsruhe, Germany) supplemented with 10% FCS
(fetal calf serum; PAA Laboratories, Cölbe, Germany)
and 2 mM L-glutamin (Invitrogen) under standard
conditions (37°C, 10% CO2, humidified atmosphere). The
micrometastatic BCM1 (breast cancer) cells [23,24] were
cultured at 37°C, 5% CO2 and 10% O2 in RPMI (Invitrogen,
Karlsruhe, Germany) supplemented with 10% FCS (PAA
Laboratories), 2 mM L-glutamin (Invitrogen), 10 mg/mL
Insulin-Transferrin-Selenium-A (Invitrogen), 50 ng/mL
recombinant human epidermal growth factor, and 10 ng/mL
human basic fibroblast growth factor (Miltenyl Biotec,
Bergisch-Gladbach, Germany). Cell viability was determined
Schwarzenbach et al. BMC Cancer 2014, 14:796
/>
by trypan blue staining. MCF-7 and BCM1 cells were
stimulated by 5-aza-2´-deoxycitidine (5-aza-CdR, f.c.
1 μM, Sigma-Aldrich, Steinheim, Germany) for 72 h.
5-aza-CdR-treated or untreated cells were stimulated by
Trichostatin A (TSA, f.c. 500 nM, Sigma-Aldrich) for 24 h
after 48 hour incubation with or without 5-aza-CdR.
RT-PCR
For cloning of the transcription factors Ets-1, Sp1, and
hTBP, total RNA was prepared using the RNeasy® Mini
Kit (Qiagen, Hilden, Germany) and performed according
to the manufacturer’s description. Synthesis of cDNA
was carried out using the First-strand cDNA synthesis kit
and priming with the oligonucleotides dT (Fermentas, St.
Leon-Rot, Germany). PCR amplification of cDNA was
performed with primers specific for Ets-1: 5´-CCA AAA
TGG TAC CAT GAA GGC GGC CGT CGA T-3´
and 5´-GAA TCA AGC GGC CGC TCA CTC GTC
GGC ATC TGG-3´; Sp1: 5´- CCA AAA TGA ATT
CAT GAG CGA CCA AGA TCA C-3´ and 5´-GAA
TCA ACT CGA GTC AGA AGC CAT TGC CAC T-3´;
full length, N-terminal and C-terminal hTBP: 5´-CCA
AAA TGA ATT CAT GGA TCA GAA CAA CAG C-3´,
5´-GAA TCA ACT CGA GTT ACG TCG TCT TCC
TGA ATC C-3´, 5´-GAA TCA ACT CGA GAG AAC
TCT CCG AAG CTG G-3´ and 5´-CCA AAA TGA ATT
CGG GAT TGT ACC GCA GCT G-3´; BORIS: 5´CTCAGGTGAGAAGCCTTACG-3´ and 5´-TGA TGG
TGG CAC AAT GGG-3´. The reaction was in a final
volume of 20 μl containing PCR buffer (Qiagen), 200 μM
of each dNTP (Roche Applied Science, Mannheim,
Germany), 0.5 μM of each primer and 2.5 units of Pfu
turbo hot start polymerase (Stratagene, Amsterdam,
Netherlands). Template DNA was amplified in 35 cycles.
The PCR products were separated on a 1% agarose gel.
Vector constructions
For transient transfections the MAGE-A1 promoter region
fragment (-77/+183) containing the BORIS binding site
downstream of the transcriptional start site was amplified
in a PCR using the following primer pair: 5’-GTT CCC
GCC AGG AAA CAT C-3’ and 5’-GCC CAG GCT GAG
ACG TCT TCC-3’. After amplification the PCR product
was cloned into a pCR2.1 TOPO vector (Invitrogen),
digested with the restriction enzymes KpnI and XhoI and
subcloned into the corresponding restriction sites of the
pGL2-Luciferase reporter plasmid (Promega). For the
construction of the expression plasmids, we cloned
cDNA of Ets-1 into KpnI and NotI, and of Sp1, full
length, N-terminal and C-terminal hTBP into EcoRI
and XhoI sites of the pcDNA3.1 vector (Invitrogen).
The pBIG-HA BORIS plasmid containing the full-length
BORIS sequence was described in [14].
Page 3 of 15
To analyze protein-protein interactions, we amplified
the sequences of Ets-1, Sp1, MBD1v1, MBD2b, hTBP-full
length, hTBP-N and hTBP-C of pcDNA3.1 expression
constructs and BORIS of pBIG-HA construct by primers
containing the restriction sites SgfI and PmeI. Following
specific primers were used for Ets-1: 5’-CCA AAA TGC
GAT CGC ATG AAG GCG GCC GTC GAT-3’ and 5’GAA TCA AGT TTA AAC TCA CTC GTC GGC ATC
TGG-3’, Sp1: 5’-CCA AAA TGC GAT CGC ATG AGC
GAC CAA GAT CAC-3’ and 5’-GAA TCA AGT TTA
AAC TCA GAA GCC ATT GCC ACT-3’, MBD1v1: 5’CCA AAA TGC GAT CGC ATG GCT GAG GAC TGG
CT-3’ and 5’-GAA TCA AGT TTA AAC CTA CTG CTT
TCT AGC TC-3’, MBD2b: 5’-CCA AAA TGC GAT CGC
ATG GAT TGC CCG GCC CTC-3’ and 5’-GAA TCA
AGT TTA AAC TTA GGC TTC ATC TCC ACT-3’, full
length hTBP: 5’-CCA AAA TGC GAT CGC ATG GAT
CAG AAC AAC AGC-3’ and 5’-GAA TCA AGT TTA
AAC TTAC GTC GTC TTC CTG AA-3’, N-terminal
hTBP: 5’-CCA AAA TGC GAT CGC ATG GAT CAG
AAC AAC AGC-3’ and 5’-GAA TCA AGT TTA AAC
AGA ACT CTC CGA AGC TGG-3’, C-terminal hTBP: 5’CCA AAA TGC GAT CGC GGG ATT GTA CCG CAG
CTG-3’ and 5’-GAA TCA AGT TTA AAC TTAC GTC
GTC TTC CTG AA-3’, and BORIS: 5’-CCA AAA TGC
GAT CGC ATG TAC CCA TAC GAT GTT CCA-3’ and
5’-GAA TCA AGT TTA AAC TCA CTT ATC CAT CGT
GTT-3’. After PCR and gel purification, the fragments
were inserted into pCR2.1 TOPO-vector (Invitrogen),
cleaved by the restriction enzymes SgfI and PmeI, and
cloned into pFN19A (HaloTag®7) T7 SP6 Flexi vector
(Promega). All clones were verified by restriction digestion
and DNA sequencing.
In vitro methylation of plasmid DNA
Twenty μg of reporter plasmids containing the MAGE-A1
promoter fragment were methylated by HpaII methylase
(New England Biolabs, Schwalbach, Germany) for 4 h at
37°C in the presence of the co-factor SAM (S-Adenosyl
methionine, New England Biolabs). The methylation
efficiency of plasmid DNA was confirmed by restriction
enzyme digestion with HpaII (New England Biolabs). A
control digest was done using the isoschizomer MspI
(New England Biolabs).
Transient transfection and luciferase assay
MDA-MB-468, MCF-7 and BCM1 cells were transiently
transfected with 0.5 μg of reporter plasmids (unmethylated
or HpaII-methylated) and pcDNA3.1 expression plasmids
up to 2 μg using FuGENE HD Reagent (Roche Applied
Science, Mannheim, Germany) in a 6-well plate (BD
Falcon, Heidelberg, Germany). For efficiency control
0.2 μg of a vector encoding for Renilla Luciferase (Promega,
Mannheim, Germany) was co-transfected. Cells were
Schwarzenbach et al. BMC Cancer 2014, 14:796
/>
cultured for 48 h under standard conditions. Luciferase
assays were performed using the Dual-Luciferase Reporter
Assay System kit (Promega) according to the manufacturer’s protocol. Promoter-driven luciferase activity was
measured on a 20/20n Luminometer Turner Biosystems
(Promega) and normalized by the Renilla luciferase
activity. Each transfection experiment was carried out
in duplicate wells and repeated several times.
Transient transfection and mRNA expression analyses
To determine the mRNA expression of MAGE-A1 in
MDA-MB-468, MCF-7 and BCM1 cells, transient
transfections were performed using 5 μg expression
plasmids and FuGENE HD Reagent (Roche Applied
Science). After a 72 hour transfection total RNA was
isolated using the RNeasy® Mini Kit (Qiagen) according to
the manufacturer’s protocol. RNA was converted into
cDNA using the First Strand cDNA Synthesis kit and
oligo(dt) primers (Fermentas). Two μL of cDNA (2 μg)
were amplified in a 20-μl final volume containing PCR
buffer (Qiagen), 200 μM of each dNTP (Roche Applied
Science), 0.5 μM of each primer and 2.5 units of Taq DNA
polymerase (Qiagen). The MAGE-A primer pairs for PCR
have been previously described [6]. The reaction was
run for 35 cycles on a Thermal Cycler (Flexigene,
Techne, Stafordshire), and the PCR products were
electrophoretically separated on a 1% agarose gel.
To degrade the BORIS mRNA and consequently, inhibit
its protein expression, 1 μg expression plasmid containing
the BORIS sequence and/or 1 μg plasmid containing the
BORIS specific shRNA cassette and/or 1 μg control
plasmid encoding for a scramble shRNA were transfected
in BCM1 cells using FuGENE HD Reagent (Roche
Applied Science) in a 6-well plate (BD Falcon). After
a 48 or 72 h transfection total RNA was extracted
and converted into cDNA. Two μl of cDNA (0.5 μg)
were amplified in a quantitative real-time PCR.
FACS (Fluorescence Activated Cell Sorting) analyses
2×10⁷ MCF-7 cells transfected with 5 μg pBIG-HA
Boris expression plasmid and 10 μl XtremeGene HP
(Roche Applied Science) were washed in 10 ml staining
buffer (0.1% BSA, 0.1% sodium azide in PBS). Following
incubation of the transfected and non-transfected cells
with 50 μl FcR blocking reagent (Miltenyl Biotec) for
15 min at 4°C and washing in 10 ml staining buffer, the
cells were fixed in 500 μl IC Fixation buffer (eBioscience,
Frankfurt, Germany) in the dark for 20 min. The cells were
washed twice in permeabilization buffer (eBioscience) and
incubated with 4 μg of anti-Boris primary antibody or
purified mouse IgGk isotype control antibody (BD
Biosciences, Heidelberg, Germany) for 30 min at 4°C.
After washing, the cells were incubated with 4 μg of
FITC conjugated IgG/IgM goat anti-mouse secondary
Page 4 of 15
antibody (BD Biosciences) in the dark for 30 min at
4°C. The washed cells were filtered through a 30-μm
CellTrics Filter (Partec, Münster, Germany). The filtered
Boris-expressing cells were separated from non-transfected
cells on the FACS Aria III device (BD Biosciences, Le Pont
de Claix, France) using settings for maximum purity.
Sorting was performed in staining buffer with an 85-μm
nozzle, a 488-nm laser, a photomultiplier tube E, a 525-nm
dichroic and a 543/22-nm excitation filter. Sorted cells were
collected in DMEM containing 10% FCS. Usually,
approximately 4.5% of transfected cells could be separated
from non-transfected cells. Different approaches of
transfected and non-transfected cells were performed:
non-labeled, isotype control antibody and anti-Boris
primary antibody.
DNA methylation analysis by sodium bisulfite sequencing
For the sodium bisulfite conversion the EpiTect bisulfite
kit (Qiagen) was used according to a modified protocol.
One μg of genomic DNA supplemented with 35 μl DNA
Protect buffer and 85 μl bisulfite mix were alternately
denatured at 99°C and incubated at 60°C for 5, 25, 5, 85,
5 and 175 min. Following purification and concentration
of the sodium bisulfite-treated DNA on an EpiTect
column (Qiagen), 1 μl of the modified DNA was amplified
with primers specific for MAGE-A1 and -A2 promoter
fragments [6]. The PCR products were purified using the
DNA Clean & Concentrator-5 kit (Zymo Research,
Greiburg, Germany) and sequenced using the Big
Dye Terminator v1.1 Cycle Sequencing kit (Applied
Biosystems) on an automated Genetic Analyzer 3130
(Applied Biosystems).
Chromatin immunoprecipitation (ChIP) assay
Exponentially growing MCF-7 cells stimulated by 5-aza-CdR
(Sigma-Aldrich) and/or TSA (Sigma-Aldrich) as well as cells
transfected by BORIS expression plasmid were used
in ChIP experiments. The Magna ChIP™ G Chromatin
Immunoprecipitation Kit (Millipore, Schwalbach, Germany)
was carried out according to the manufacturer’s recommendations. Briefly, cells were fixed in 1% formaldehyde in
minimal medium for 10 min at room temperature (RT)
before being washed, scraped, and pelleted in ice-cold PBS.
Cells were lysed with a hypotonic lysis buffer supplemented
with a protease inhibitor cocktail for 15 min on ice, and
nuclei were pelleted by centrifugation for 5 min, 2900 rpm
at 4°C. The nuclei pellet was sheared in 500 μl nuclear lysis
buffer supplemented with a protease inhibitor cocktail
by sonication at 25% power for 4 min on ice (Sonicator
UP50H; Dr. Hielscher GmbH, Teltow, Germany) to
chromatin fragment lengths of 200 to 1000 bp. Aliquots of
whole-cell lysates were saved as input DNA. The sonicated
lysates were immunoprecipitated using 3 μg of either the
control antibody IgG (Abcam, Cambridge, United Kingdom)
Schwarzenbach et al. BMC Cancer 2014, 14:796
/>
Page 5 of 15
or antibodies against acetylated histones H3 (H3K9ac)
(Upstate) and H4 (H4K8ac) (Abcam), and methylated
histones H3K4me, H3K4me2, H3K9me, H3K9me3,
H4K20me, H4K20me2 and H4K20me3 (Upstate).
Twenty μl magnetic beads (protein G, Millipore) were
added to each reaction and incubated overnight at 4°C.
After washing, the immunoprecipitants were recovered
and incubated with proteinase K (Millipore) for 2 hours.
The DNA fragments were purified on columns (Millipore)
and eluted by 50 μl of elution buffer.
transcripts detected by the sf1 probe. The Taqman probe
sf2 detects at least two BORIS isoforms, A4 and C2 that
produce the same protein but are expressed from two
alternative promoters, A and C, respectively. The Taqman
sf3 probe detects five isoforms: A5, A6 B4, B5, and C6.
The Taqman probe sf4 was designed to detect at least six
BORIS isoforms: C3, B2, B3, C4, C5, and C8. The B1
isoform has a unique C-terminus and 3´UTR that were
used to design the sf5 probe. The sf6 probe detects four
BORIS isoforms: B6, B7, C7, and C9 [17].
Quantitative real-time PCR
Expression of recombinant protein
Quantitative real-time PCR analysis was performed
using the QuantiTect SYBR Green PCR kit system
(Thermo Fisher, Schwerte, Germany) on a Realplex4 System
Mastercycler Epgradient S (Eppendorf, Hamburg, Germany).
Each reaction contained 2 μl cDNA or purified immunoprecipitated DNA fragments, 5 μl SYBR-Green PCR master mix
and 4 pmol primer sets in a final volume of 10 μl.
The DNA was amplified by the primer pairs specific
for BORIS (5’-CTC AGG TGA GAA GCC TTA CG-3’
and 5’-TGA TGG TGG CAC AAT GGG-3’), MAGE-A1
(5’- GGC CGA AGG AAC CTG ACC -3’ and 5’-GTC
CTC TGG GTT GGC CTGT-3’), β-Actin (5´-CCA ACC
GCG AGA AGA TGA-3´ and 5´-CCA GAG GCG TAC
AGG GAT AG-3´) and RPLP0 (housekeeping gene, ChIP,
5’-TTA GTT TGC TGA GCT CGC CAG-3’ and 5’-CTC
TGA GCT GCT GCC ACC TG-3’). The following PCR
cycling conditions were used: 95°C for 15 s, 58°C or
60°C for 30 s, and 72°C for 30 s, for 45 cycles. After
amplification the specificity of PCR products was
determined by melting curve analyses. For quantification
a serial dilution of genomic DNA was generated and
served as internal standard in each run. For the amplified
immunoprecipitated DNA, the background of non-specific
IgG immunoprecipitation was subtracted from the
calculated ratio between the data derived from the
histone-specific immunprecipitation and input DNA.
Each sample was thermocycled in duplicate, and all
experiments were repeated at least three times.
To analyze the expression patterns of BORIS isoforms
in basal and BORIS-transfected MCF-7 and BCM1 cells,
quantitative real-time PCR was performed as previously
described [17]. BORIS isoforms were divided into six
subfamilies, sf1 to sf6, based on their 39 sequences
[17]. The Taqman probe sf1 was designed against
sequences between exon 9 and 10 of the BORIS B0
and detects BORIS isoforms B0, B1, A1, A2, A3, and C1
(Additional file 1: Table S1). The absolute quantification
approach was applied to estimate the actual number of
BORIS transcripts detected by sf1 per 50 ng of total
RNA. BORIS B1 contains a unique splice site that
was used to design the sf5 probe, and the total number of
B1 transcripts was subtracted from the total number of
For protein expression and purification the EnPresso™
Tablet Cultivation Set (BioSilta, Oulu, Finnland) and
HaloTag® Protein Purification System (Promega) were used,
respectively. To induce protein expression, a transformed
culture of KRX competent cells (Promega) at an optical
density of 9-13 at 600 nm was supplemented with a
“booster solution” (EnZ I’m and 0.05% rhamnose). After
centrifugation for 10 min at 5600 rpm and 4°C, the cell
pellet was resuspended in HaloTag® Protein Purification
buffer (50 mM HEPES, 150 mM NaCl, 1 mM DTT,
0.005% IGEPAL CA-630; Promega), 10 mg/ml lysozyme
(Sigma-Aldrich) and RQ1 RNase free DNase (Promega)
and disrupted by sonication at 60% power for 45 s on
ice (Sonicator UP50H; Dr. Hielscher GmbH, Teltow,
Germany). The proteins were purified from the sonicated
cell lysates according to the manufacturer’s recommendations (Promega). Briefly, lysates were incubated with
HaloLink™ resin, followed by washing with HaloTag®
Protein Purification buffer and cleavage with TEV
Protease Cleavage Solution (HaloTag® Protein Purification
buffer supplemented with 1/16 volume TEV protease) on
a rotator (NeoLab, Heidelberg, Germany) for 1 h at RT.
After centrifugation 50 μl of 50% HisLink™ resin was
added and incubated on the rotator for 20 min at RT. The
supernatant contained the recombinant proteins.
Pull down assay
Pull down assay was carried out according to the
manufacturer’s recommendations for HaloLink™ resins
(Promega). The “bait” HaloTag fusion proteins were
prepared by incubating 1 μg FN19A (HaloTag®7) T7 SP6
Flexi vector (Promega) with in vitro TNT® Quick-coupled
Transcription/Translation System (Promega) containing
40 μl TNT Quick Master mix and 1 mM methionine at
30°C for 90 min. The “prey” proteins were prepared by
incubating 1 μg pcDNA3.1 constructs with TNT®
Quick-coupled Transcription/Translation System (Promega)
and 1000 Ci/mol labeled [35S]-L-methionine (Hartmann
Analytic, Braunschweig, Germany) at 30°C for 90 min. For
the assay 20 μl of each bait and prey proteins were mixed
and incubated for 1 h at RT on a shaker. As a negative control 20 μl TNT Master mix were used instead of using the
Schwarzenbach et al. BMC Cancer 2014, 14:796
/>
“bait” protein. The HaloLink™ resin was prepared by washing in binding buffer (100 mM Tris (pH 7.6), 150 mM NaCl
and 0,05% IGPAL-630) three times. Twenty μl of bait-prey
complex were added to the HaloLinkTM resin resuspended
in 100 μl binding buffer. After incubation on a rotator for
90 min at 4°C, the complex was centrifuged and washed
three times in wash buffer (100 mM Tris pH 7.6, 150 mM
NaCl, 1 mg/ml BSA and 0.05% IGPAL-630). The bound
proteins were separated on a 12% SDS polyacrylamide gel.
Statistical analyses
The statistical analyses were performed using the SPSS
software package, version 18.0 (SPSS Inc. Chicago, IL).
Statistical difference of mRNA expressions was calculated
using ANOVA with Dunnett test for all pairwise
comparisons that correct for experiment-wise error
rate. Missing data were handled by pairwise deletion.
A p-value ≤0.05 was considered as statistically significant.
All p-values are two-sided.
Ethics statement
In the present manuscript, the research does not involve
human subjects, human material, or human data, or used
regulated vertebrates or invertebrates
Results
BORIS stimulates MAGE-A1 mRNA expression in MCF-7
and BCM1 cells
We previously demonstrated that the demethylating
agent 5-aza-CdR and the histone deacetylase inhibitor
TSA synergistically upregulate MAGE-A1 expression in
cell lines derived from different cancer types [6]. Moreover,
Vatolin et al. reported that conditionally expressed BORIS
induces expression of a series of CTA genes, including
MAGE-A1 gene [14], but converse data have also been
reported demonstrating that stable expression of
BORIS in melanoma cell lines did not induce expression
of MAGE-A1 [20]. In order to examine whether BORIS is
actually able to activate the MAGE-A1 promoter and
to which extent, we compared its influence with the
stimulatory effect of 5-aza-CdR and/or TSA on
MAGE-A1 transcription in cancer cell line settings.
For our current investigations, we chose 3 breast cancer
cell lines: MDA-MB-468, MCF-7 and BCM1 because of
their different levels of MAGE-A1 and BORIS transcripts.
As shown in Table 1 and measured by quantitative
real-time PCR, MDA-MB-468 cells express relatively
high levels of MAGE-A1 [2^(ΔCt) 19.33] and BORIS
mRNA [2^(ΔCt) 48.78], whereas MCF-7 cells do not
(or negligibly) express MAGE-A1 mRNA [2^(ΔCt) 2.00]
and express low levels of BORIS [2^(ΔCt) 6.92 with a
high standard deviation]. In the micrometastatic cell
line BCM1, the expression of both genes is opposite:
no levels of MAGE-A1 [2^(ΔCt) 1.07] and high levels
Page 6 of 15
Table 1 Relative expression levels of MAGE-A1 and BORIS
mRNA in breast cancer cell lines as measured by
quantitative real-time PCR
Cell lines
MAGE-A1
BORIS
MDA-MB-468
19.33 ± 3,84 (high)
48.78 ± 3.38 (high)
MCF-7
2.00 ± 0.87 (no)
6.92 ± 3.86 (low)
BCM1
1.07 ± 0.35 (no)
24.39 ± 3.34 (high)
The relative mRNA expression levels were evaluated by the ΔCt method as
follows: ΔCt = Ct value of reference RPLPO - Ct value of mRNA of interest. The
relative expression levels of the mRNA of interest corresponded to the
2^(ΔCt)*1000 value.
of BORIS [2^(ΔCt) 24.39]. We transiently transfected
expression plasmid encoding BORIS into both cell
lines, with negligible transcript levels of MAGE-A1,
and quantified endogenous MAGE-A1 mRNA by RT
(reverse transcription)-PCR and gel electrophoresis.
As depicted in Figure 1, BORIS was able to stimulate
or induce the expression of MAGE-A1 in MCF-7 cells
(Figure 1A) and BCM1 (Figure 1B) cells. In both cell lines,
the BORIS-mediated stimulation was much weaker than
the stimulatory effect by both agents (5-aza-CdR and/or
TSA, Figure 1). Performing real-time PCR, we found that
5-aza-CdR (p = 0.0001), TSA (p = 0.001), 5-aza-CdR plus
TSA (p = 0.0001) and BORIS (p = 0.04) stimulated the
RNA expression 30-, 18-, 60- and 7-fold, respectively, in
MCF-7 cells (Figure 1C). This ostensibly weaker activation
by transfected BORIS may be partly due to the fact that
transfection efficiency is usually much lower and about
10% (as deduced from FACS analyses and shown later),
but 5-aza-CdR and TSA treatment can affect 100% of cells
taken into experiment.
Knock-down of BORIS mRNA reduces the transcript levels
of MAGE-A1
To further evaluate the stimulatory effect of BORIS on
MAGE-A1 gene expression, we carried out knock-down
experiments in MDA-MB-468 and MCF-7 cells. First,
we determined the expression levels of BORIS in
MDA-MB-468, MCF-7 and BCM1 cells by RT-PCR
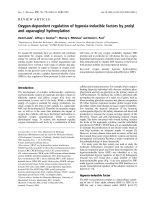
and gel electrophoresis. As expected, we found a
similar expression profile of BORIS mRNA (Figure 2) to
that detected by quantitative real-time PCR (Table 1).
However, gel electrophoresis and quantitative real time
showed no and low expression levels of BORIS in MCF-7
cells, respectively, but the tendency was similar. The
additional stimulation with 5-aza-CdR showed that
induction of BORIS expression may occur by DNA
demethylation (Figure 2).
We knocked down the high expression of endogenous
BORIS in MDA-MB-468 cells by a BORIS specific shRNA
cassette. The transfection with a plasmid encoding for a
scramble shRNA served as a control. At 48 or 72 hour
post-transfection, we quantified the changes in the BORIS
Schwarzenbach et al. BMC Cancer 2014, 14:796
/>
A
Page 7 of 15
B
MCF-7
BCM1
MAGE-A1
429 bp _
ß-Actin
202 bp _
ß-Actin
202 bp _
C
MAGE-A1 mRNA Expression (%)
MAGE-A1
429 bp _
80000
60000
40000
20000
MCF-7
p=0.0001
p=0.0001
p=0.001
2000
1500
1000
500
0
p=0.04
basal
AZA
TSA
AZA
+
TSA
Boris
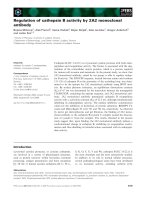
Figure 1 Comparison of the MAGE-A1 mRNA expression in 5-aza-CdR- and/or TSA-stimulated MCF-7 and BCM1 cells with the
expression in BORIS-transfected cells. RT-PCR products of MAGE-A1 mRNA expression prior and after stimulation of MCF-7 (A) and BCM1 cells
(B) with the demethylating agent 5-aza-CdR and/or the histone deacetylase inhibitor TSA or after transient transfection of these cells with an
expression plasmid encoding for BORIS were separated on an agarose gel. The bar chart shows the relative changes in mRNA expression levels
of MAGE-A1 in MCF-7 cells by quantitative real-time PCR. The significant p-values are shown (C). H2O lane serves as a negative control. The
housekeeping gene β-Actin was selected as an internal control due to the lack of influence of any stimulation involved.
and MAGE-A1 mRNA levels by quantitative real-time
PCR and RT-PCR/gel electrophoresis. As measured by
real-time PCR, BORIS-specific shRNA reduced the
endogenous BORIS mRNA expression from 100%
down to 20% in basal MDA-MB-468 cells (p = 0.0001)
and, documenting more the specificity of the experiment,
from 75% down to 40% in MDA-MB-468 cells transfected
with the control plasmid encoding for scramble shRNA
(Figure 3A, p = 0.008). As shown by quantitative real-time
PCR (Figure 3B, p < 0.05) and on an agarose gel (Figure 3C),
the BORIS-specific shRNA (with and without scramble
shRNA) downregulated the basal endogenous MAGE-A1
BORIS
134 bp b-Actin
202 bp -
MDA-MB468
MCF-7
BCM1
Figure 2 BORIS mRNA expression in MDA-MB-468, MCF-7 and
BCM1 cells, untreated or treated with 5-aza-CdR. RT-PCR products
of BORIS mRNA were separated on an agarose gel.
expression approximately 30%. We also carried out these
knock-down experiments in MCF-7 cells that were additionally transfected with an expression plasmid encoding
for BORIS. Therefore, we co-transfected MCF-7 cells with
an expression plasmid encoding for BORIS, to upregulate
MAGE-A1 expression in this cell line. BORIS-specific
shRNA reduced the BORIS mRNA expression nearly
completely in presence and absence of scramble shRNA
(Figure 3D, p = 0.0001). Likewise, the downregulation of
MAGE-A1 expression by BORIS-specific shRNA was more
prominent in MCF-7 cells than in MDA-MB-468 cells. As
measured by quantitative real time PCR, BORIS-specific
shRNA reduced the MAGE-A1 expression down to 10% in
presence and absence of scramble shRNA (Figure 3E,
p = 0.0001). This stronger downregulation of BORIS and
MAGE-A1 in MCF-7 cells is caused by the overexpression
of BORIS in these cells, whereas the analyses in
MDA-MB-468 were carried with endogenous BORIS.
These results show that changes in the BORIS
transcript levels are associated with those of MAGE-A1
and corroborate that BORIS is involved in the activation
of MAGE-A1 gene expression.
BORIS affects the DNA methylation pattern of MAGE-A1
gene
Promoter hypermethylation is responsible for the restricted
expression of the tumor-associated MAGE-A antigens. It
Schwarzenbach et al. BMC Cancer 2014, 14:796
/>
p=0.0001
p=0.008
50
40
30
20
10
0
B
relative BORIS mRNA Expression
relative BORIS mRNA Expression
A
Page 8 of 15
25
C
p<0.05
MAGE-A1
429 bp
ß-Actin
202 bp
20
15
10
5
0
MDA-MB-468
D
E
p=0.0001
p=0.0001
p=0.0001
p=0.0001
MCF-7
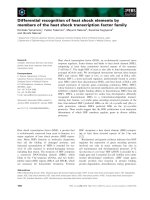
Figure 3 BORIS-specific shRNA knocks down BORIS and decreases MAGE-A1 gene expression. MDA-MB-468 (A, B, C) and MCF-7 (D, E)
cells were transiently transfected with expression plasmid containing BORIS-specific shRNA and control plasmid encoding for a scramble shRNA.
In contrast to MDA-MB-468 cells with their high levels of endogenous MAGE-A1 and BORIS mRNA levels, MCF-7 cells showing no expression of
MAGE-A1 were additionally cotransfected with the expression plasmid containing the BORIS sequence. After a 48 hour transfection, mRNA levels
were measured by PCR. Changes in mRNA expression levels of BORIS (A) and MAGE-A1 (B) by quantitative real-time PCR and MAGE-A1 by gel
electrophoresis (C) in MDA-MB-468 cells. Real-time PCR derived changes in mRNA expression levels of BORIS (D) and MAGE-A1 (E) in MCF-7 cells.
The significant p-values are shown.
was reported that DNA demethylation of the Ets-1 binding
sites of the MAGE-A1 promoter is sufficient to activate
gene expression [5]. In addition, the transcriptional
start site located in the region between -30 and +30,
and responsible for basal activity of the MAGE-A1
promoter, should be demethylated for the induction of
MAGE-A expression [25]. Previously, we investigated the
influence of the DNA demethylation agent 5-aza-CdR
together with the histone deacetylase inhibitor TSA on
the mRNA expression of MAGE-A1 gene and the other
family members (MAGE-A2, -A3 and -A12) in different
cell lines. Moreover, we assessed the methylation status of
the MAGE-A promoters by sodium bisulfite mapping
before and after stimulation with the demethylating agent
5-aza-CdR and/or TSA. While the methylation patterns
clearly correlated with the basal MAGE RNA transcript
levels, up-regulation of MAGE-A expression mediated by
5-aza-CdR resulted in a reduction in promoter methylation ranging between 1% and 19%. Although TSA was able
to synergistically enhance 5-aza-CdR-mediated MAGE-A
transcription, we could not observe further DNA demethylation with both substances (5-aza-CdR + TSA) together
[6]. This heterogeneous DNA methylation pattern could
be caused by the heterogeneous and random spreading of
the demethylating agent in the cells, and the insensitivity
of some cells to these agents.
Schwarzenbach et al. BMC Cancer 2014, 14:796
/>
Page 9 of 15
In respect to the inducing effect of BORIS on MAGE-A1
mRNA expression, it was of interest to examine the
influence of BORIS on methylation pattern of the
MAGE-A1 promoter. In the present study, we compared
the DNA methylation patterns of the promoter in MCF-7
cells transfected with the expression plasmid encoding for
BORIS to the pattern in non-transfected and untreated
cells. For these experiments, we chose, therefore, MCF-7
cells, because they do not express MAGE-A1 mRNA
(Table 1). Based on the usually low transfection efficiency
we sorted the transfected MCF-7 cells from untransfected
cells by FACS and observed a transfection efficiency
of about 10%. Subsequently, sodium bisulfite mapping
showed a demethylation of the MAGE-A1 promoter
of approximately 56% (range from 44 to 69%) in the
sorted BORIS-transfected cells, compared with the sorted
non-transfected and untreated MCF-7 cells. As shown by
two examples of the supplementary Additional file 2:
Figure S1, BORIS demethylated the binding sites for
Ets-1, Sp1 and BORIS which are essential for the activation
of MAGE-A1.
Histone modifications at the promoter of MAGE-A1
Besides DNA methylation, histone modifications also have
an impact on promoter activity. In general, acetylation of
N-terminal histone tails is a dominant signal for active
chromatin facilitating the binding of components of
the basal transcription machinery and transcription
factors [26]. Histone methylation can be either an active or
repressive signal. Mono-, di- and trimethylation of H3K4
are involved in gene expression [9]. The monomethylations
of H3K9 and H4K20 are linked to gene activation, whereas
trimethylations of these histones at lysine residues are
linked to repression [27].
Since BORIS may demethylate the MAGE-A1 promoter,
we also analyzed its impact on the modifications of
histones bound at the MAGE-A1 promoters. To investigate
the changes in the histone signature of MAGE-A1 promoter, it was compared in basal MCF-7 cells (no expression
of MAGE-A1, Table 1) to the signature in MCF-7 cells
stimulated by 5-aza-CdR with/without TSA or transfected
with the expression plasmid encoding for BORIS. For these
analyses we used antibodies specific for acetylated histones
H3K9 and H4K8, and for methylated histones H3K4, H3K9
and H4K20. We performed immunoblot analyses and
documented specific recognition of histone modifications
by these specific antibodies. The histone modifications
could not be determined in the micrometastatic BCM1
cells because of their slow cell growth and high cell death
caused by 5-aza-CdR and TSA. Upon treatment of MCF-7
cells with TSA, an enrichment of H3K9ac could be
observed, indicating the function of TSA as histone
deacetylase inhibitor (p = 0.001). While DNA demethylation
by 5-aza-CdR had no or a minor effect on the histone modifications, 5-aza-CdR and TSA were able to enrich H3K9ac,
H4K8ac, H3K9me, and H3K4me2 (p = 0.0001). Based on
their low levels, the relative changes in the histone
modifications of H3K4me3, H4K20me, H4K20me2 and
H4K20me3 could not be evaluated, but did not seem
to be significant (Figure 4). Due to the nature of the
experimental procedures of ChIP, we could not sort transfected cells from untransfected cells by FACS analyses.
MCF-7
p=0.0001
p=0.0001
p=0.0001
p=0.0001
Figure 4 Histone signature at the MAGE-A1 promoter as examined by chromatin immunoprecipitation. DNA was derived from
unstimulated (basal) MCF-7 cells, 5-aza-CdR- and/or TSA-stimulated MCF-7 cells and MCF-7 cells transfected with the expression plasmid encoding
for BORIS. DNA-bound histones were immunoprecipitated by antibodies specific for methylated and acetylated histones, and amplified in a
real-time PCR by a primer pair specific for the MAGE-A1 promoter. The background of the non-specific IgG immunoprecipitation was subtracted
from the calculated ratio between the data derived from the histone-specific immunoprecipitation and input DNA. H3K9, Lysine 9 of histone
H3; H4K8, Lysine 8 of histone H4; H3K4, Lysine 4 of histone H3; H4K20, Lysine 20 of histone H4; ac, acetylated; me, monomethylated; me2,
dimethylated; me3, trimethylated. The significant p-values are shown.
Schwarzenbach et al. BMC Cancer 2014, 14:796
/>
Page 10 of 15
Therefore, the predominant occurrence of untransfected
cells in the transfection assay (10% of transfection
efficiency) may be the reason, that we could not observe
any alterations in the histone modifications mediated by
transfected BORIS (Figure 4).
Differential effects of transcription factors BORIS, Sp1 and
Ets-1 in the regulation of MAGE-A1 expression
In order to functionally investigate the impact of BORIS
on promoter settings, we examined the influence of
BORIS on the activity of the methylated MAGE-A1
promoter in the context of transcription factors Ets-1 and
Sp1. We transiently co-transfected methylated reporter
plasmids pGL2/MAGE-A1 (-77/+183) containing the
BORIS binding site located downstream of the start site
(Figure 5A), and expression plasmids encoding for BORIS,
Ets-1 or Sp1 into BCM1 cells. As expected, aberrantly
expressed transcription factors Ets-1 and Sp1 had no
effect on methylated MAGE-A1 [11]. However, transfected
BORIS was able to activate the methylated promoter in
these cells (p = 0.0001). Overexpression of Ets-1 could not
further upregulate the promoter activity mediated by
BORIS, as shown by several repetitions. Surprisingly,
co-transfection with an expression plasmid encoding for
Sp1 partly repressed the stimulatory effect mediated by
BORIS (p = 0.001), whereas the addition of expression
plasmid encoding for Ets-1 abrogated this repression
(Figure 5B).
To verify the repressive effect of Sp1 on the BORISactivated MAGE-A1 promoter, we transiently transfected
the expression plasmids into MCF-7 and BCM1 cells, and
analyzed the endogenous MAGE-A1 mRNA level by gel
electrophoresis. Ectopic expression of BORIS could induce
the mRNA expression of MAGE-A1 in both cell lines
(Figure 5C). This upregulation could be slightly increased
by the co-expression of Ets-1. In contrast, exogenous
Sp1 reversed the stimulatory effect mediated by BORIS on
MAGE-A1 mRNA transcription. We repeated the experiments
A
-81
-74
-60
-52
-43 -30
Ets-1 Ets-1
-8
+14
+17 +26 +30 +45
basal transcription complex
+95
+129 +132 +159 +161 +169 +175
+185
BORIS
Sp1
B
600
p=0.001
C
p=0.0001
p=0.0001
400
MCF-7
BCM1
MAGE-A1
429 bp
202 bp
200
h
BO BO .
RI RI
S+ S
BO BO Et
s
RI RI -1
S+ S+
Et Sp
s1
1+
Sp
1
0
M
AG
EA1
m
et
Luciferase activity (%)
BCM1
Figure 5 MAGE-A1 promoter activity in basal and transfected cancer cells. Schematic view of the MAGE-A1 promoter fragment (-81/-185).
The binding sites for Ets-1, Sp1 and basal transcription complex are indicated by grey boxes. The start site is indicated by an arrow. The vertical
lines with the numbers mark the cytosine in the CpG dinucleotides (A). Luciferase activity of the HpaII-methylated plasmid containing the
MAGE-A1 promoter fragment (-77/+183) in BCM1 cells which were transiently co-transfected with expression plasmids encoding for BORIS,
Ets-1 and Sp1. The basal MAGE-A1 promoter activity was set to 100%. The activities derived from the reference plasmid encoding for the Renilla
Luciferase were used to normalize the variability in transfection efficiency. The significant p-values are shown (B). Endogenous mRNA expression of
MAGE-A1 in MCF-7 and BCM1 cells basal or transfected with expression plasmids encoding for BORIS, Ets-1 and Sp1 as determined by RT-PCR and gel
electrophoresis. The housekeeping gene β-Actin was selected as an internal control due to the lack of influence of any stimulation involved (C).
Schwarzenbach et al. BMC Cancer 2014, 14:796
/>
Page 11 of 15
on transcription of MAGE-A1 several times with
similar results (Figure 5C). These findings support
our data obtained from the reporter luciferase activity
measurements (Figure 5B) and indicate a differential
regulation of the MAGE-A1 by BORIS and Sp1.
To compare the transfection efficiency and assess if
similar amounts of the different expression plasmids
entered BMC1 and MCF-7 cells, we performed real-time
PCR using primers that specifically bind to the expression
plasmids and the inserted genes (BORIS, Ets-1 and Sp1).
We found a CT value of 27.3 (STD 0.3) for BORIS, 27.3
(STD 0.2) for Ets-1, 27.8 (STD 0.2) for Sp1, indicating a
similar inclusion of the expression plasmids.
Ectopic BORIS expression upregulates its alternatively
spliced transcripts from its own genomic locus
The differential regulation of MAGE-A1 gene expression
could be explained by a separate site in MAGE-A1
promoter that could be recognized by a BORIS alternatively
spliced isoform with different sequence specificity. For this
reason, we compared mRNA patterns of alternatively
spliced BORIS isoforms in basal MCF-7 and BCM1 cells
with analogous cells transfected with BORIS (the first
cloned, original form B0). As we recently described [17],
BORIS isoforms could not be specifically discriminated
by quantitative RT-PCR because most isoforms share
sequence similarities, making it impossible to design
primers and probes that would detect each BORIS isoform
as a separate species. Therefore, we operationally divided
the 23 isoforms into six subfamilies (sf1 to sf6) based on
their unique 3’ terminal sequences, which were used to
design 6 Taqman probes for quantitative real-time PCR
[17]. With the exception of sf1, which detects the original
BORIS form (B0) that was transfected into the cell lines,
we measured the relative units of BORIS isoforms sf2
to sf6 in basal and BORIS-transfected MCF-7 and
BCM1 cells. As shown in Figure 6, BORIS stimulated
substantially its isoforms sf3 to sf6 in MCF-7 cells
Interaction of transcription factors BORIS and Sp1 with
the TATA binding protein
In our recent publication, we have shown the cooperative
and competitive interplay of transcription factors (Ets-1,
Sp1) and epigenetic factors (BORIS, MBD1, MBD2a) to
activate or repress the MAGE-A1 promoter by transient
transfection assays [11]. To determine if these proteins,
together with BORIS, can form secondary complexes with
each other in the absence of DNA and to understand
better the mechanism underlying the regulation of
MAGE-A1 expression, we carried out in vitro proteinprotein interaction assays. Each of the proteins was either a
resin-bound “bait” fusion protein or a [35S]-L-methionine
labeled “prey” protein. As shown by the separation of the
bound proteins on polyacrylamide gels and previously
reported [28,29], the transcription factor Sp1 efficiently
interacted with Ets-1 and the amino-terminus of the
human TATA binding protein (hTBP), the general
transcription factor of the basal transcription complex. We
show for the first time, that Sp1 also interacted with BORIS
and MBD1v1, which up- and downregulate MAGE-A1
promoter activity, respectively, but this protein-protein
interaction was much weaker than its interaction with
Ets-1 and hTBP amino-terminus. Conversely, hTBP interacted with MBD2b, BORIS, Ets-1 and Sp1 (Figure 7A).
For the interaction with MBD2b and BORIS the evolutionarily conserved carboxyl (C) terminus of hTBP was
necessary and sufficient. At present, it is unclear whether
these interactions with hTBP play a functional role in the
competitive transcriptional regulation of Sp1 and BORIS.
However, this observation is supported by our ChIP-seq
data on several cancer cell lines – BORIS sites are frequently overlapped with hTBP [17]. For a better overview,
B
12
p=0.0001
p=0.0001
10
MCF7
MCF7+BORIS
p=0.0001
8
6
p=0.001
4
2
0
relative BORIS RNA levels
relative BORIS RNA levels
A
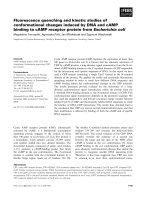
which do not express endogenous BORIS (Figure 6A,
p = 0.0001), whereas BORIS only stimulated weakly
sf2 and sf3 in BCM1 cells which express high levels
of endogenous BORIS (Figure 6B).
1,6
BCM1
BCM1+BORIS
1,4
1,2
1
0,8
0,6
0,4
0,2
0
sf2
sf3
sf4
sf5
sf6
sf2
sf3
sf4
sf5
sf6
Figure 6 Upregulation of alternatively spliced BORIS transcripts in MCF-7 and BCM1 cells as determined by quantitative real time PCR.
Changes in mRNA expression levels of BORIS isoforms sf2 to sf6 in MCF-7 (A) and micrometastatic breast cancer BCM1 cells (B), which were basal
or transiently transfected with the expression plasmid containing the BORIS (sf1) sequence. The significant p-values are shown.
Schwarzenbach et al. BMC Cancer 2014, 14:796
/>
A
Page 12 of 15
B
Sp1
80 kDa
hTBP
37 kDa
N
Ets-1
Sp1
hTBP
C
BORIS
MBD2
MBD1v1
hTBP-C
13 kDa
Figure 7 BORIS and Sp1 interact with the TATA binding protein (hTBP). The methionine labeled “prey” fusion proteins Sp1, hTBP and the
carboxyl terminus of hTBP (hTBP-C) were incubated with various resin-bound “bait” proteins as indicated below the polyacrylamide gels. The
protein complexes were collected by precipitation and separated by gel electrophoresis. The weak band in the TNT-mix (negative control) is
unspecific and serves as a background level (A). Schematic view of the detected protein-protein interactions. N, amino terminus; C, carboxyl
terminus (B).
Figure 7B schematically summarizes the protein-protein
interactions.
Discussion
In the current study devoted mainly to understanding
the transcriptional regulation of MAGE-A1, we detected
that ectopically expressed BORIS was able to induce
MAGE-A1 promoter activity in MCF-7 cells and micrometastatic BCM1 cells. This activation by BORIS was
associated with DNA demethylation of the MAGE-A1
promoter. It is of interest that MAGE-A1 activation by
BORIS may vary depending on cell line but the strongest
upregulation occurs when there is already low expression
level of MAGE-A1. If the expression is completely shut
down as in normal primary cells, activation is also
observed but at a very low level and, likely, in a fraction of
cells. These data suggest that the epigenetic landscape of
cells is different and their responsiveness to ectopic
transcription factors is also different. In our present
study, we describe the complex interplay of general
transcription and epigenetic factors in MAGE-A1
regulation. Exogenous Sp1 partly repressed the induction
of MAGE-A1 gene expression mediated by BORIS. Ets-1
could not further upregulate the BORIS-mediated
promoter activity, but Ets-1 abrogated the Sp1-mediated
repression in reporter assays. As the two Ets-1 sites
overlap the Sp1 site, it appears to be rather simple to
postulate 1) that the opposite effects of those two factors
are due to their interference on the promoter, and 2) Ets-1
effects are stronger probably because there are two Ets-1
sites compared to one Sp1 site in the MAGE-A1
promoter. The BORIS site is located about 150 bp
downstream to the Sp1 site, in the first exon of MAGE-A1.
As Sp1 and BORIS have independent target sites around
the start site of the MAGE-A1 promoter, the opposite
effects of those two factors need to be mechanistically
explained. Thus, the competitive interplay between
BORIS and Sp1 does not seem to be caused by alternation of the DNA binding of both factors. However, the
physical protein-protein interaction between BORIS and
SP1, which we observed and was also recently reported
[30], might diminish the BORIS-mediated activation of
MAGE-A1.
The repressive effect by Sp1 could also be favored by
its additional interaction with the epigenetic factor
MBD1v1. It is still unclear whether MBD1v1 exerts its
repressive effect by interaction with Sp1 at the Sp1 binding
site of the promoter or by preventing the binding of Sp1 to
its motif. Our preliminary data suggest that the third
cysteine-rich CXXC domain of MBD1v1 is involved in this
interaction, because the splice variant MBD1v3, which
lacks this domain, did not bind to Sp1. The ability of
MBD1v1 to repress unmethylated promoters also depends
on this third CXXC domain [12]. In this regard, our recent
binding analyses of EMSA showed that MBD1v1 does
not only bind to methylated, but also to unmethylated
MAGE-A promoters and is able to repress unmethylated
MAGE-A promoters [11]. This in vitro ability is also
supported by a previously published study demonstrating
a methylation-independent repression by MBD1v1 on
another promoter [31]. Our data are of note, because
co-transfection of Ets-1 or Sp1 did not lead to an abrogation of MBD1v1-mediated repression [11]. In respect to the
potential role of MBD1v1 as a repressor of unmethylated
MAGE-A promoters and to the mechanisms underlying
the transcriptional repression, we investigated whether
Schwarzenbach et al. BMC Cancer 2014, 14:796
/>
MBD1v1 can also interact with Ets-1. Due to problems in
the production of recombinant Ets-1 protein, we could not
determine if Ets-1 can form a secondary complex with
MBD1v1.
How does the binding of Sp1 partly abrogate BORIS
activation? Currently, we can suggest either direct interaction of BORIS with Sp1 generating a DNA kink that
diminishes transcription, or a separate site in MAGE-A1
promoter that could be recognized by a BORIS alternatively
spliced isoform with different sequence specificity. That site
might overlap with the Sp1 site and thus directly interfere
with the Sp1 transcription factor. Ets-1 could stabilize
BORIS isoform binding preventing Sp1 to act at this site.
We show here that BORIS can activate transcription of its
own locus. However, the strength of this activation depends
on the cell line and likely on other transcription factors
present in a particular cell type. More research is required
to clarify this phenomenon.
Both BORIS and Sp1 are capable of binding to different
domains of hTBP, the general transcription factor of the
basal transcription machinery, which forms a preinitiation
complex with RNA polymerase II to start mRNA transcription. Our data are in line with previously published
data showing that Sp1 interacts with the N-terminus of
hTBP [32]. In contrast, the interaction between BORIS
and hTBP takes place with the C-terminal evolutionarily
conserved domain of hTBP, which has been shown to
interact with several other transcription factors [32,33].
One could envisage that the MAGE-A1 promoter activity
mediated by BORIS might be based on its interaction
with the general transcription factor hTBP. However,
to support this hypothesis, further experiments, such
as luciferase assays, are to be assessed.
Furthermore, we demonstrate for the first time that
the epigenetic factor MBD2 also interacts with the
C-terminal domain of hTBP. In our recent study, we
reported that although MBD2a had no binding activity to
MAGE-A1 promoters in EMSA and ChIP assays, transfected MBD2a could stimulate luciferase activity of the
unmethylated reporter plasmids containing the MAGE-A
promoter fragments in a variety of cancer cell lines [11].
Fujita et al. explained the lack of binding activity of
MBD2a and its activating effect for cAMP-responsive
genes by the interaction of MBD2a with the RNA helicase
A. They depicted a hypothetical model illustrating MBD2a
as a factor in the transcriptional co-activator complex
which is associated with RNA polymerase II [13]. We
complement this model and show that MBD2 may
interact with hTBP. This link with the basal transcription
machinery could explain how MBD2a promotes MAGE-A
transcription.
Functional studies reported that BORIS is neither
necessary nor sufficient for DNA hypomethylation and
activation of CTA genes in melanoma and ovarian cell
Page 13 of 15
lines, and additional factors are likely required for CTA
antigen expression [20,34]. Those data are in contrast
to our previous data, which showed that aberrantly
expressed BORIS is responsible for DNA demethylation
and subsequent activation of most CTAs, including
MAGE-A1, in carcinomas [14]. Our present observations
support the hypothesis that BORIS may demethylate the
MAGE-A1 promoter, upregulate the promoter activity
and induce mRNA expression. In particular, BORIS
seems to participate in DNA demethylation of the
binding sites for the transcription factor Ets-1 and
the transcriptional start site for the basal transcription complex. These target sites essential for the activation of MAGE-A1 are methylated in MAGE-A-negative
cells.
Covalent modifications associated with histone tails
are also involved in regulation of gene expression. The
histone code dictates the recruitment of specific factors
that in turn define the formation of open or closed chromatin structures [35,36]. We could endorse the function
of TSA as histone deacetylase inhibitor, because TSA was
able to enrich acetylated H3K9. Our investigations also
showed that both agents, 5-aza-CdR and TSA, were necessary to launch distinct histone modifications at the
MAGE-A1 promoter. However, we found no effect of
BORIS on the histone code. This could be explained by
the low transfection efficiency of 10%. Recently,
Bhan et al. showed that BORIS is able to change the
histone code at the promoters of the MAGE-A members
MAGE-A2, -A3 and -A4. In bronchial cancer cells, BORIS
induction resulted in increased amounts of BORIS and
activating histone modifications at these promoters
along with a corresponding increase in CTA expression.
Whereas BORIS binding at these promoters correlated
with enrichment of activating modifications, absence
of BORIS was associated with enrichment of repressive histone codes [37]. Moreover, it was reported
that BORIS helps to recruit histone (H3K4) methyltransferase, SET1A, onto the promoters of myc and
BRCA1 to promote a permissive histone modification
status [21].
Conclusions
In conclusion our data show that BORIS may demethylate and activate the MAGE-A1 promoter. The induction
of the MAGE-A1 mRNA expression could be provoked
by the interaction between BORIS and hTBP. Sp1 could
partly repress the BORIS-mediated stimulatory effect by
its direct interaction with BORIS and MBD1v1. Moreover,
the secondary complex formation of MBD2 with hTBP
may also play a role in the activation of MAGE-A
transcription. However, more experiments have to be done
to clarify the interplay of these factors in the regulation of
MAGE-A genes expression.
Schwarzenbach et al. BMC Cancer 2014, 14:796
/>
Additional files
Additional file 1: Table S1. The primers and the Taqman probes used
in quantitative real-time RT-PCR.
Additional file 2: Figure S1. Bisulfite-treated MAGE-A1 promoter
sequence in sorted non-transfected and sorted BORIS-transfected
MCF-7 cells.
Page 14 of 15
9.
10.
11.
12.
Abbreviations
BORIS: Brother of the Regulator of Imprinted Sites; ChIP: Chromatin
immunoprecipitation assay; CTA: Cancer-testis antigens; fetal calf serum: FCS;
MAGE-A: Melanoma-associated antigen A; MBDs: Methyl-CpG binding
proteins; hTBP: Human TATA binding protein; RT: Reverse transcription;
TSA: Trichostatin A; 5-aza-CdR: aza-2´-deoxycitidine.
13.
14.
Competing interests
The authors declare that they have no competing interests.
15.
Authors’ contributions
HS, VL, DL conceived and designed the experiments. CE, BS, JT performed
the experiments. HS, VL, DL discussed the results and their biological
relevance. HS wrote the manuscript. KP, VL, DL corrected the manuscript.
All authors read and approved the final manuscript.
Acknowledgements
We thank Mrs. Melanie Lachmann, Constanze Siggel, Regine Thiel and the
Core Unit FACS-Sorting of the University Hospital Hamburg-Eppendorf for
the helpful assistance to carry out flow cytometry.
Grant support
The study was supported by the Stiftung für Pathochemie and Molekulare
Diagnostik, Bonn, Germany, and the Wilhelm Sanders Stiftung, München,
Germany. The funders had no role in study design data collection and
analysis, decision to publish, or preparation of the manuscript.
Author details
1
Department of Tumor Biology, University Medical Center
Hamburg-Eppendorf, Martinistraße 52, Hamburg 20246, Germany.
2
Laboratory of Immunogenetics, National Institute of Allergy and Infectious
Disease, National Institutes of Health, Rockville, Maryland, USA.
16.
17.
18.
19.
20.
Received: 21 July 2014 Accepted: 23 October 2014
Published: 3 November 2014
21.
References
1. Caballero OL, Chen YT: Cancer/testis (CT) antigens: potential targets for
immunotherapy. Cancer Sci 2009, 100(11):2014–2021.
2. De Plaen E, Arden K, Traversari C, Gaforio JJ, Szikora JP, De Smet C, Brasseur F,
van der Bruggen P, Lethe B, Lurquin C, Brasseur R, Chomez P, De Backer O,
Cavenee W, Boon T: Structure, chromosomal localization, and expression of
12 genes of the MAGE family. Immunogenetics 1994, 40(5):360–369.
3. Jungbluth AA, Busam KJ, Kolb D, Iversen K, Coplan K, Chen YT, Spagnoli GC,
Old LJ: Expression of MAGE-antigens in normal tissues and cancer.
Int J Cancer 2000, 85(4):460–465.
4. James SR, Link PA, Karpf AR: Epigenetic regulation of X-linked cancer/
germline antigen genes by DNMT1 and DNMT3b. Oncogene 2006,
25(52):6975–6985.
5. De Smet C, Courtois SJ, Faraoni I, Lurquin C, Szikora JP, De Backer O, Boon T:
Involvement of two Ets binding sites in the transcriptional activation of the
MAGE1 gene. Immunogenetics 1995, 42(4):282–290.
6. Wischnewski F, Pantel K, Schwarzenbach H: Promoter demethylation and
histone acetylation mediate gene expression of MAGE-A1, -A2, -A3,
and -A12 in human cancer cells. Mol Cancer Res 2006, 4(5):339–349.
7. Zheng YG, Wu J, Chen Z, Goodman M: Chemical regulation of epigenetic
modifications: opportunities for new cancer therapy. Med Res Rev 2008,
28(5):645–687.
8. Cameron EE, Bachman KE, Myohanen S, Herman JG, Baylin SB: Synergy of
demethylation and histone deacetylase inhibition in the re-expression of
genes silenced in cancer. Nat Genet 1999, 21(1):103–107.
22.
23.
24.
25.
26.
27.
Hashimoto H, Vertino PM, Cheng X: Molecular coupling of DNA
methylation and histone methylation. Epigenomics 2010, 2(5):657–669.
Klose RJ, Bird AP: Genomic DNA methylation: the mark and its mediators.
Trends Biochem Sci 2006, 31(2):89–97.
Wischnewski F, Friese O, Pantel K, Schwarzenbach H: Methyl-CpG binding
domain proteins and their involvement in the regulation of the
MAGE-A1, MAGE-A2, MAGE-A3, and MAGE-A12 gene promoters.
Mol Cancer Res 2007, 5(7):749–759.
Jorgensen HF, Ben-Porath I, Bird AP: Mbd1 is recruited to both methylated
and nonmethylated CpGs via distinct DNA binding domains. Mol Cell Biol
2004, 24(8):3387–3395.
Fujita H, Fujii R, Aratani S, Amano T, Fukamizu A, Nakajima T: Antithetic
effects of MBD2a on gene regulation. Mol Cell Biol 2003, 23(8):2645–2657.
Vatolin S, Abdullaev Z, Pack SD, Flanagan PT, Custer M, Loukinov DI,
Pugacheva E, Hong JA, Morse H 3rd, Schrump DS, Risinger JI, Barrett JC,
Lobanenkov VV: Conditional expression of the CTCF-paralogous
transcriptional factor BORIS in normal cells results in demethylation and
derepression of MAGE-A1 and reactivation of other cancer-testis genes.
Cancer Res 2005, 65(17):7751–7762.
Klenova EM, Morse HC 3rd, Ohlsson R, Lobanenkov VV: The novel BORIS +
CTCF gene family is uniquely involved in the epigenetics of normal
biology and cancer. Semin Cancer Biol 2002, 12(5):399–414.
Renaud S, Pugacheva EM, Delgado MD, Braunschweig R, Abdullaev Z,
Loukinov D, Benhattar J, Lobanenkov V: Expression of the CTCF-paralogous
cancer-testis gene, brother of the regulator of imprinted sites (BORIS), is
regulated by three alternative promoters modulated by CpG methylation
and by CTCF and p53 transcription factors. Nucleic Acids Res 2007,
35(21):7372–7388.
Pugacheva EM, Suzuki T, Pack SD, Kosaka-Suzuki N, Yoon J, Vostrov AA,
Barsov E, Strunnikov AV, Morse HC 3rd, Loukinov D, Lobanenkov V:
The structural complexity of the human BORIS gene in gametogenesis
and cancer. PLoS One 2010, 5(11):e13872.
Hong JA, Kang Y, Abdullaev Z, Flanagan PT, Pack SD, Fischette MR, Adnani MT,
Loukinov DI, Vatolin S, Risinger JI, Custer M, Chen GA, Zhao M, Nguyen DM,
Barrett JC, Lobanenkov VV, Schrump DS: Reciprocal binding of CTCF and
BORIS to the NY-ESO-1 promoter coincides with derepression of this
cancer-testis gene in lung cancer cells. Cancer Res 2005, 65(17):7763–7774.
Smith IM, Glazer CA, Mithani SK, Ochs MF, Sun W, Bhan S, Vostrov A,
Abdullaev Z, Lobanenkov V, Gray A, Liu C, Chang SS, Ostrow KL, Westra WH,
Begum S, Dhara M, Califano J: Coordinated activation of candidate
proto-oncogenes and cancer testes antigens via promoter demethylation
in head and neck cancer and lung cancer. PLoS One 2009, 4(3):e4961.
Kholmanskikh O, Loriot A, Brasseur F, De Plaen E, De Smet C: Expression
of BORIS in melanoma: lack of association with MAGE-A1 activation.
Int J Cancer 2008, 122(4):777–784.
Nguyen P, Bar-Sela G, Sun L, Bisht KS, Cui H, Kohn E, Feinberg AP, Gius D:
BAT3 and SET1A form a complex with CTCFL/BORIS to modulate H3K4
histone dimethylation and gene expression. Mol Cell Biol 2008,
28(21):6720–6729.
Sun L, Huang L, Nguyen P, Bisht KS, Bar-Sela G, Ho AS, Bradbury CM, Yu W, Cui
H, Lee S, Trepel JB, Feinberg AP, Gius D: DNA methyltransferase 1 and 3B
activate BAG-1 expression via recruitment of CTCFL/BORIS and modulation
of promoter histone methylation. Cancer Res 2008, 68(8):2726–2735.
Bartkowiak K, Wieczorek M, Buck F, Harder S, Moldenhauer J, Effenberger KE,
Pantel K, Peter-Katalinic J, Brandt BH: Two-dimensional differential gel
electrophoresis of a cell line derived from a breast cancer micrometastasis
revealed a stem/ progenitor cell protein profile. J Proteome Res 2009,
8(4):2004–2014.
Pantel K, Dickmanns A, Zippelius A, Klein C, Shi J, Hoechtlen-Vollmar W,
Schlimok G, Weckermann D, Oberneder R, Fanning E, Riethmuller G:
Establishment of micrometastatic carcinoma cell lines: a novel source of
tumor cell vaccines. J Natl Cancer Inst 1995, 87(15):1162–1168.
De Smet C, Loriot A, Boon T: Promoter-dependent mechanism leading to
selective hypomethylation within the 5' region of gene MAGE-A1 in
tumor cells. Mol Cell Biol 2004, 24(11):4781–4790.
Dahl JA, Collas P: Q2ChIP, a quick and quantitative chromatin
immunoprecipitation assay, unravels epigenetic dynamics of developmentally
regulated genes in human carcinoma cells. Stem Cells 2007, 25(4):1037–1046.
Barski A, Cuddapah S, Cui K, Roh TY, Schones DE, Wang Z, Wei G, Chepelev
I, Zhao K: High-resolution profiling of histone methylations in the human
genome. Cell 2007, 129(4):823–837.
Schwarzenbach et al. BMC Cancer 2014, 14:796
/>
Page 15 of 15
28. Santiago FS, Khachigian LM: Ets-1 stimulates platelet-derived growth
factor A-chain gene transcription and vascular smooth muscle cell
growth via cooperative interactions with Sp1. Circ Res 2004,
95(5):479–487.
29. Emili A, Greenblatt J, Ingles CJ: Species-specific interaction of the
glutamine-rich activation domains of Sp1 with the TATA box-binding
protein. Mol Cell Biol 1994, 14(3):1582–1593.
30. Kang Y, Hong JA, Chen GA, Nguyen DM, Schrump DS: Dynamic
transcriptional regulatory complexes including BORIS, CTCF and Sp1
modulate NY-ESO-1 expression in lung cancer cells. Oncogene 2007,
26(30):4394–4403.
31. Majumder S, Kutay H, Datta J, Summers D, Jacob ST, Ghoshal K: Epigenetic
regulation of metallothionein-i gene expression: differential regulation of
methylated and unmethylated promoters by DNA methyltransferases
and methyl CpG binding proteins. J Cell Biochem 2006, 97(6):1300–1316.
32. Seipel K, Georgiev O, Gerber HP, Schaffner W: C-terminal domain (CTD)
of RNA-polymerase II and N-terminal segment of the human TATA
binding protein (TBP) can mediate remote and proximal transcriptional
activation, respectively. Nucleic Acids Res 1993, 21(24):5609–5615.
33. Schubart DB, Sauter P, Massa S, Friedl EM, Schwarzenbach H, Matthias P:
Gene structure and characterization of the murine homologue of the
B cell-specific transcriptional coactivator OBF-1. Nucleic Acids Res 1996,
24(10):1913–1920.
34. Woloszynska-Read A, James SR, Song C, Jin B, Odunsi K, Karpf AR: BORIS/
CTCFL expression is insufficient for cancer-germline antigen gene
expression and DNA hypomethylation in ovarian cell lines.
Cancer Immun 2010, 10:6.
35. Cedar H, Bergman Y: Linking DNA methylation and histone modification:
patterns and paradigms. Nat Rev Genet 2009, 10(5):295–304.
36. D'Alessio AC, Szyf M: Epigenetic tete-a-tete: the bilateral relationship
between chromatin modifications and DNA methylation. Biochem Cell Biol
2006, 84(4):463–476.
37. Bhan S, Negi SS, Shao C, Glazer CA, Chuang A, Gaykalova DA, Sun W,
Sidransky D, Ha PK, Califano JA: BORIS Binding to the Promoters of Cancer
Testis Antigens, MAGEA2, MAGEA3, and MAGEA4, Is Associated with
Their Transcriptional Activation in Lung Cancer. Clin Cancer Res 2011,
17(13):4267–4276.
doi:10.1186/1471-2407-14-796
Cite this article as: Schwarzenbach et al.: Differential regulation of
MAGE-A1 promoter activity by BORIS and Sp1, both interacting with the
TATA binding protein. BMC Cancer 2014 14:796.
Submit your next manuscript to BioMed Central
and take full advantage of:
• Convenient online submission
• Thorough peer review
• No space constraints or color figure charges
• Immediate publication on acceptance
• Inclusion in PubMed, CAS, Scopus and Google Scholar
• Research which is freely available for redistribution
Submit your manuscript at
www.biomedcentral.com/submit