Oxidative stress in susceptibility to breast cancer: Study in Spanish population
Bạn đang xem bản rút gọn của tài liệu. Xem và tải ngay bản đầy đủ của tài liệu tại đây (491.21 KB, 15 trang )
Rodrigues et al. BMC Cancer 2014, 14:861
/>
RESEARCH ARTICLE
Open Access
Oxidative stress in susceptibility to breast cancer:
study in Spanish population
Patricia Rodrigues1, Griselda de Marco2, Jessica Furriol1,7, Maria Luisa Mansego2,8, Mónica Pineda-Alonso3,
Anna Gonzalez-Neira6, Juan Carlos Martin-Escudero3, Javier Benitez4,6, Ana Lluch1,5, Felipe J Chaves2
and Pilar Eroles1*
Abstract
Background: Alterations in the redox balance are involved in the origin, promotion and progression of cancer.
Inter-individual differences in the oxidative stress regulation can explain a part of the variability in cancer susceptibility.
The aim of this study was to evaluate if polymorphisms in genes codifying for the different systems involved in
oxidative stress levels can have a role in susceptibility to breast cancer.
Methods: We have analyzed 76 single base polymorphisms located in 27 genes involved in oxidative stress regulation
by SNPlex technology. First, we have tested all the selected SNPs in 493 breast cancer patients and 683 controls and
we have replicated the significant results in a second independent set of samples (430 patients and 803 controls).
Gene-gene interactions were performed by the multifactor dimensionality reduction approach.
Results: Six polymorphisms rs1052133 (OGG1), rs406113 and rs974334 (GPX6), rs2284659 (SOD3), rs4135225 (TXN) and
rs207454 (XDH) were significant in the global analysis. The gene-gene interactions demonstrated a significant four-variant
interaction among rs406113 (GPX6), rs974334 (GPX6), rs105213 (OGG1) and rs2284659 (SOD3) (p-value = 0.0008) with
high-risk genotype combination showing increased risk for breast cancer (OR = 1.75 [95% CI; 1.26-2.44]).
Conclusions: The results of this study indicate that different genotypes in genes of the oxidant/antioxidant pathway
could affect the susceptibility to breast cancer. Furthermore, our study highlighted the importance of the analysis of the
epistatic interactions to define with more accuracy the influence of genetic variants in susceptibility to breast cancer.
Keywords: Breast cancer, Oxidative stress, Single nucleotide polymorphisms, Gene-gene interactions, Multifactor
dimensionality reduction
Background
Despite breast cancer (BC) being the most frequent cancer in women in western countries and the second cause
of cancer death after lung cancer [1], the risk factors that
lead to the disease are not completely understood, although is widely accepted that they include a combination of environmental and genetic factors. For genetic
approximation, a polygenic model has been proposed in
which a combination of common variants, having individually a modest effect, together contribute to BC predisposition [2].
Numerous evidence links carcinogenesis and oxidative
stress regulation, including prooxidant and antioxidant
* Correspondence:
1
INCLIVA Biomedical Research Institute, Valencia, Spain
Full list of author information is available at the end of the article
defense systems [3-7]. Oxidative stress is defined as an
imbalance in the production of reactive oxygen species
(ROS) and reactive nitrogen species (RNS) and their removal by antioxidants. When this imbalance occurs, biomolecules are damaged by ROS and RNS and normal
cellular metabolism is impaired, leading to changes of
intra- and extracellular environmental conditions. ROS
can cause lesions in DNA, such as mutations, deletions,
gene amplification and rearrangements, that may lead to
malignant transformations and cancer initiation and progression [8-10]. The effect of ROS and RNS, however, is
balanced by the anti-oxidant action of non-enzymatic
and anti-oxidant enzymes maintaining cellular redox
levels under physiological conditions [4,11].
Previous studies with knockout animals that lack antioxidant enzymes support the view that ROS contribute
© 2014 Rodrigues et al.; licensee BioMed Central Ltd. This is an Open Access article distributed under the terms of the Creative
Commons Attribution License ( which permits unrestricted use, distribution, and
reproduction in any medium, provided the original work is properly credited. The Creative Commons Public Domain
Dedication waiver ( applies to the data made available in this article,
unless otherwise stated.
Rodrigues et al. BMC Cancer 2014, 14:861
/>
to the age-related development of cancer. For instance,
mice deficient in the antioxidant enzyme CuZnSOD
showed increased cell proliferation in the presence of
persistent oxidative damage contributing to hepatocarcinogenesis later in life [12]. Another study showed that
mice lacking the antioxidant enzyme Prdx1 had a shortened lifespan owing to the development, beginning at
about 9 months, of severe hemolytic anemia and several
malignant cancers [13].
In this context, single nucleotide polymorphisms (SNPs)
in components of the cellular redox systems can modify
the redox balance and take part in both the BC initiation
and/or progression, as well as determine possible therapeutic treatments [14-17].
Despite the importance of oxidative stress in the development and progression of cancer, few studies have evaluated the relationship between genetic modification in
genes coding for enzymes relatives to the redox system
and the susceptibility to develop BC. The previous studies had focused mainly on the analysis of genes related
to antioxidant defense enzymes [18,19], but the information about modifications in genes involved in the oxidation process is relatively sparse.
The aim of this study was to evaluate the association
between common variants in genes coding for proteins
related to the redox system (antioxidant and oxidant systems or proteins) and the susceptibility to develop BC.
We hypothesized that common SNPs related to the
redox pathway are associated with an altered risk for
BC. We chose 76 SNPs on which to perform a two-step
study: one first exploratory set and a second, independent, validation set. We also decided to investigate the
impact of complex interactions between SNPs at different genes of the stress oxidative pathway. To address
this issue, we analyzed the effects of gene-gene interactions by the multifactor dimensionality reduction (MDR)
approach. This analysis was carried out in four SNPs
that were statistically significant in the combinatorial set.
Methods
Study population
The underlying analyses were carried out in a Caucasian
Spanish population. The study was carried out in two steps
with two population groups. A first group of 1176 samples
was composed of 493 female patients diagnosed for BC between the years 1998–2008 at La Paz Hospital and Foundation Jimenez Díaz (Madrid), and 683 healthy women
controls recruited at the Hospital of Valladolid (Spain).
Thereupon, we chose the polymorphisms that showed
marginally significant association (p-value < = 0.15), and
we replicated the procedure in a second independent
group (n = 1233) where we included 430 female patients
diagnosed for BC between the years 1988–1998 at the
Clinic Hospital of Valencia (Spain) and 803 samples
Page 2 of 15
from cancer-free women recruited at the blood donor
bank at the same Hospital. Blood was collected between
2010 and 2011 during periodical patient visits. The
blood from controls was extracted between the years
2009 and 2012. In both groups, the controls were
women without pathology or history of cancer. Controls
were not matched to cases, but were similar in age. In
group 1, cases’ mean age was 57.5 (range 23.5-89.5), and
that for donors was 52.7 (21.5-96.5). In group 2, cases’
mean age was 54.1 (20.5-86.5) while in donors, it was 54
(22.5-92.5).
We selected this staged approach because it allowed
us to analyze only those polymorphisms with indicative
results and reduced the number of genotyping reactions
without significantly affecting statistical power [18,20].
The research protocols were approved by the ethics
committee of the INCLIVA Biomedical Research Institute. All the participants in the study were informed and
gave their written consent to participate in the study.
Single nucleotide polymorphisms selection and
genotyping
Two public databases were used to collect information
about SNPs in oxidative pathway genes: NCBI (http://www.
ncbi.nlm.nih.gov/projects/SNP/) and HapMap (http://www.
hapmap.org). The selection of polymorphisms was performed by SYSNP [20] and by a literature search in
PubMed, Scopus and EBSCO databases using the terms
“breast cancer and polymorphisms and oxidative”, along
with additional terms such as “SNPs and oxidative pathway
and susceptibility”, and their possible combinations. The
following criteria were used to select the SNPs: functional
known or potentially functional effect, location in promoter
regions, minor allele frequency (MAF) over 0.1 in
Caucasian populations analyzed previously, localization
and distribution along the gene (including upstream
and downstream regions) and low described linkage
disequilibrium between candidate polymorphisms. We
included variants with potential influence in the gene
and protein function, as well as the most important variants described in the literature.
Finally, we select a total of 76 polymorphisms located in
27 genes related to the redox system: 17 were classified as
antioxidant genes (CAT, GCLC, GCLM, GNAS, GPX6,
GSR, GSS, M6PR, MSRB2, OGG1, SOD1, SOD2, SOD3,
TXN, TXN2, TXNRD1, TXNRD2) and 10 as reactive species generators (mainly NADPH oxidase-related genes
CYBB, NCF2, NCF4, NOS1, NOS2A, NOX1, NOX3,
NOX4, NOX5 and XDH). Reference names and characteristics of the selected SNPs are provided in Table 1.
Experimental procedures
The blood samples remained frozen until the DNA
extraction was performed. Genomic DNA was
Rodrigues et al. BMC Cancer 2014, 14:861
/>
Page 3 of 15
Table 1 Summary of the 76 selected SNPs in 27 genes
Gene
Chr
SNP id
Allelesa
Chr position
Location
MAF controlsb
HWE controlsc
CAT
11
rs1049982
C/T
34417117
5´UTR
0.355
0.66
rs475043
A/G
34450377
downstream
0.334
0.73
rs511895
A/G
34444305
intronic
0.332
0.73
rs7104301
A/G
34450214
downstream
0.308
0.18
rs769214
A/G
34416293
promoter
0.349
0.61
CYBB
GCLC
GCLM
GNAS
X
6
1
20
rs5964125
A/G
37543395
intronic
0.150
0.37
rs5964151
G/T
37555673
3´UTR
0.149
0.45
rs1014852
A/T
53478711
intronic
0.057
0.27
rs11415624
-/A
53470407
3´UTR
0.315
0.08
rs3736729
A/C
53487364
intronic
0.462
0.36
rs4140528
C/T
53469648
downstream
0.265
0.62
rs7515191
A/G
94139685
intronic
0.368
0.57
rs7549683
G/T
94126037
3´UTR
0.367
0.46
rs4812042
A/G
56895310
intronic
0.340
0.20
rs7121
C/T
56912202
coding (synonymous)
0.449
0.70
rs919196
C/T
56917480
intronic
0.195
0.63
GPX6
6
rs406113
A/C
28591461
coding (missense)
0.310
0.08
rs974334
C/G
28582197
intronic
0.157
0.31
GSR
8
rs1002149
G/T
30705280
promoter
0.152
0.65
rs2551715
A/G
30666178
intronic
0.375
1.00
rs2911678
A/T
30659513
intronic
0.189
0.53
GSS
M6PR
20
12
rs8190996
C/T
30673548
intronic
0.437
0.81
rs13041792
A/G
33008716
promoter
0.202
0.63
rs2273684
G/T
32993427
intronic
0.438
0.07
rs725521
C/T
32979732
downstream
0.456
0.02
rs1805754
A/C
8994515
promoter
0.236
0.16
rs933462
G/T
8994932
promoter
0.419
0.94
MSRB2
10
rs11013291
C/T
23440197
intronic
0.394
0.69
NCF2
1
rs2274064
C/T
181809010
coding (missense)
0.444
0.27
rs2274065
A/C
181826327
5´UTR
0.067
0.22
rs2296164
C/T
181801558
intronic
0.452
0.24
NCF4
22
rs2072712
C/T
35601748
coding (synonymous)
0.089
0.05
NOS1
12
rs570234
A/C
116255365
intronic
0.385
0.80
rs576881
A/G
116257218
intronic
0.372
0.62
rs816296
A/C
116255127
intronic
0.189
0.17
rs2779248
C/T
23151959
upstream
0.362
0.11
rs3729508
A/G
23133157
intronic
0.447
0.58
rs4827881
A/C
100016329
upstream
0.223
0.05
rs5921682
A/G
100017093
upstream
0.459
0.88
NOS2A
NOX1
NOX3
17
X
6
rs231954
C/T
155791727
coding (synonymous)
0.442
0.02
rs3749930
G/T
155802938
coding (missense)
0.037
0.24
NOX4
11
rs490934
C/G
88863264
intronic
0.056
1.00
NOX5
15
rs2036343
A/C
67092815
promoter
0.048
0.19
rs34990910
A/G
67118435
intronic
0.027
0.38
Rodrigues et al. BMC Cancer 2014, 14:861
/>
Page 4 of 15
Table 1 Summary of the 76 selected SNPs in 27 genes (Continued)
OGG1
3
rs1052133
C/G
9773773
coding (missense)
0.213
0.87
SOD1
21
rs17881274
C/T
31953051
upstream
0.039
0.07
SOD2
6
rs2842980
A/T
160020106
downstream
0.219
0.50
rs2855116
G/T
160026115
intronic
0.454
0.12
rs8031
A/T
160020630
intronic
0.459
0.35
SOD3
4
rs2284659
G/T
24403895
promoter
0.371
0.25
TXN
9
rs2301241
C/T
112059329
promoter
0.514
0.25
rs4135168
A/G
112056706
intronic
0.222
0.82
rs4135179
A/G
112055821
intronic
0.156
0.24
rs4135225
C/T
112046512
intronic
0.390
0.29
rs2281082
G/T
35202696
intronic
0.170
0.41
rs5756208
A/T
35207988
promoter
0.179
0.51
rs10861201
A/C
103243089
intronic
0.259
0.31
rs4077561
C/T
103204498
promoter
0.387
0.46
TXN2
TXNRD1
22
12
rs4964287
C/T
103233689
coding (synonymous)
0.320
0.93
rs4964778
C/G
103210194
intronic
0.184
0.61
rs4964779
C/T
103218991
intronic
0.062
0.31
rs5018287
A/G
103231281
intronic
0.419
0.88
TXNRD2
22
rs737866
A/G
18310109
intronic
0.293
0.77
XDH
2
rs10175754
C/T
31475102
intronic
0.153
0.65
rs10187719
C/T
31453650
intronic
0.311
0.78
rs1346644
C/G
31479549
intronic
0.150
0.55
rs1429374
A/G
31425902
intronic
0.338
0.10
rs17011353
C/T
31441941
intronic
0.028
0.01
rs17011368
C/T
31444421
coding (missense)
0.044
0.54
rs17323225
C/T
31446769
coding (missense)
0.029
1.00
rs1884725
A/G
31425290
coding (synonymous)
0.234
0.20
rs206801
C/T
31482250
intronic
0.050
1.00
rs206812
A/G
31491373
promoter
0.486
0.54
rs2073316
A/G
31464533
intronic
0.427
0.69
rs207454
A/C
31421136
intronic
0.087
0.81
rs761926
C/G
31444289
intronic
0.300
0.72
Chr – chromosome; MAF – Minor Allele Frequency; HWE – Hardy Weinberg Equilibrium. amajority allele are in bold; bpolymorphisms with MAF <5% are excluded
for further analysis; cpolymorphisms with p-values <0.05 are not in HWE and they are excluded for further analysis. The information about MAF and HWE are
referent to the Set 1.
CAT: catalase; CYBB: cytochrome b-245, beta polypeptide; GCLC: glutamate-cysteine ligase, catalytic subunit; GCLM: glutamate-cysteine ligase, modifier subunit;
GNAS: GNAS complex locus; GPX6: glutathione peroxidase 6; GSR: glutathione reductase; GSS: glutathione synthetase; M6PR: mannose-6-phosphate receptor;
MSRB2: methionine sulfoxide reductase B2; NCF2: neutrophil cytosolic factor 2; NCF4: neutrophil cytosolic factor 4; NOS1: nitric oxide synthase 1; NOS2A: nitric oxide
synthase 2; NOX1: NADPH oxidase 1; NOX3: NADPH oxidase 3; NOX4: NADPH oxidase 4; NOX5: NADPH oxidase 5; OGG1: 8-oxoguanine DNA glycosylase; SOD1:
superoxide dismutase 1; SOD2: superoxide dismutase 2; SOD3: superoxide dismutase 3; TXN: thioredoxin; TXN2: thioredoxin 2; TXNRD1: thioredoxin reductase 1;
TXNRD2: thioredoxin reductase 2; XDH: xanthine dehydrogenase.
extracted from blood samples using DNA Isolation
Kit (Qiagen, Izasa, Madrid, Spain) following the
manufacturer’s protocol, but a final elution volume of
100 μl used. DNA concentration and quality were
measured in a NanoDrop spectrophotometer. Each
DNA sample was stored at −20°C until analysis, which
in all cases was performed within a year of the DNA
extraction.
Genotyping analysis in both sets was performed by
SNPlex technology (Applied Biosystems, Foster City,
California, USA) according to the manufacturer’s protocol [21]. This genotyping system, based on oligation
assay/polymerase chain reaction and capillary electrophoresis, was developed for accurate genotyping, high
sample throughput, design flexibility and cost efficiency.
It has validated its precision and concordance with
Rodrigues et al. BMC Cancer 2014, 14:861
/>
Page 5 of 15
genotypes analyzed using TaqMan probes-based assays.
The sets of SNPlex probes were reanalyzed in about 10%
of the samples with a reproducibility of over 99%. Those
polymorphisms and samples with genotyping lower than
85% in the first set were excluded from further analysis.
about the independence or biological relevance of SNPs or
any other factor. This is important for diseases as sporadic
BC where the etiology is not completely known. We used
the MDR software (version 2.0 beta 8.4) which is freely
available (Epistasis.org: ).
Statistical and MDR analyses
Results
Statistical analysis was performed using SNPstats software [22], a free web-based tool, which allows the analysis of association between genetic polymorphisms and
diseases. The proper analysis of these studies can be performed with general purpose statistical packages, but
this software facilitates the integration of data. The association with disease is modeled as binary; the application
assumes an unmatched case–control design and unconditional logistic regression models are used. The statistical analyses are performed in a batch call to the R
package (). SNPStats returns a
complete set of results for the analysis. SNPstats provides genotype frequencies, proportions, odds ratios
(OR) and 95% confidence intervals (CI), and p-values for
multiple inheritance models. The lowest Akaike’s Information Criterion and Bayesian Information Criterion
values indicate the best inheritance genetic model for
each specific polymorphism. All the analyses were adjusted by age. Only SNPs with no significant deviation
from Hardy-Weinberg equilibrium (HWE) in controls
and a MAF exceeding 5% were retained for the association analysis (Table 1).
To identify gene-gene interactions, MDR was used. It
is a non-parametric and a genetic model-free approach
that uses a data reduction strategy [23-25]. This method
considers a single variable that incorporates information
from several loci that can be divided into high risk and
low risk combinations. This new variable can be evaluated for its ability to classify and predict outcome risk
status using cross validation and permutation testing.
Both were used to prevent over-fitting and falsepositives from the multiple testing. With n-fold crossvalidation, the data are divided into n equal size pieces.
An MDR model is fit using (n-1)/n of the data (the
training set) and then evaluated for its generalizability
on the remaining 1/n of the data (the testing set). The
fitness of a MDR model is assessed by estimating accuracy in the training set and the testing set. Moreover, it
estimates the degree to which the same best model is
discovered across n divisions of the data, referred to as
the cross-validation consistency (CVC). The best MDR
model is the one with the maximum testing accuracy.
Statistical significance is determined using permutation
testing. We used 10-fold cross-validation and 1000-fold
permutation testing. MDR results were considered statistically significant at the 0.05 level. The advantages of this
method are that there are no underlying assumptions
Single nucleotide polymorphisms and susceptibility to
breast cancer
Set 1: To determine the possible association of polymorphisms related to oxidative stress genes and BC
we analyzed 76 polymorphisms in 27 genes of the redox
system in 493 cases and 683 controls (Table 1). Seven
SNPs (rs3749930, rs2036343, rs34990910, rs17881274,
rs17011353, rs17011368, rs17323225) with MAF <0.05 in
controls, as along with two SNPs (rs725521 and rs231954)
not showing Hardy-Weinberg equilibrium, were excluded
from the association analysis (Table 1). A total of 67 SNPs
were successfully genotyped and analyzed.
Our association analysis in set 1 pointed out four
nominally statistically significant results (p < 0.05).
Table 2 shows the results found in the selected polymorphisms. Polymorphisms rs974334, rs1805754 rs4135225
and rs207454 showed an association with modifications
in the risk for BC. All the results were adjusted by age.
Set 2: Subsequently, and in order to better identify
those polymorphisms that could be associated with BC,
we replicated the 10 SNPs with a p-value equal to or
lower than 0.15 in group 1 [rs3736729, OR: 0.74 (0.541.01); rs406113, OR:1.26 (0.98-1.62); rs974334, OR:2.01
(1.07-3.80); rs1805754, OR: 1.31 (1.02-1.68); rs1052133,
OR: 1.76 (1.00-3.10); rs2284659, OR: 1.30 (0.92-1.84);
rs2301241, OR: 0.80 (0.60-1.07); rs4135179, OR: 1.27
(0.97-1.66); rs4135225, OR: 0.66 (0.45-0.96); rs207454,
OR: 4.98 (1.28-19.34)] in a second independent set.
Set 1 + Set 2: Finally, we analyzed the 10 polymorphisms in the global population set 1 + set 2 (n = 2409;
cases = 923, controls = 1486). The results are listed in
Table 3. From the 10 polymorphisms analyzed in both
samples, 6 presented a statistically significant association
with increased risk when the combined data were analyzed: rs406113 [OR: 1.23 (1.04-1.46)], rs974334 [OR: 1.73
(1.09-2.73)], rs1052133 [OR:1.82 (1.31-2.52)], rs2284659
[OR:1.33 (1.05-1.67), rs4135225 [OR: 0.77 (0.60-0.99)],
rs207454 [OR: 2.12 (1.11-4.04)]. Of these polymorphisms,
the rs105213 on the OGG1 gene maintained the statistical significance (p-value = 0.0004) after the Bonferroni
correction.
Gene-gene interactions in breast cancer patients
There is growing evidence that epistasis interactions between genes may play a role in cancer risk, and different
variable selection approaches have been developed to
analyze the potential gene-gene and gene-environment
Rodrigues et al. BMC Cancer 2014, 14:861
/>
Page 6 of 15
Table 2 Comparison of genotype frequencies between breast cancer patients and controls (Set 1)
SNP name
Genetic model
OR (95% CI)
Genotype
Controls (n = 683)
Patients (n = 493)
p-value*
AIC
rs1049982
Recessive
0.93 (0.63-1.37)
T/T
79 (12.8%)
54 (13.4%)
0.72
1309.4
C/C-C/T
537(87.2%)
350 (86.6%)
0.21
1454.3
0.25
1451.9
0.24
1454.3
0.45
1436
0.65
1462.2
0.51
1459.3
0.79
1462.3
0.59
1458.5
0.058**
1458.7
0.87
1455.4
0.22
1461.7
0.27
1454.8
0.73
1449.3
0.84
1442.5
0.37
1460.2
0.066**
1408.9
0.03**
1452.9
0.73
1417.4
0.5
1455.5
0.92
1443.5
0.21
1456.6
rs475043
rs511895
rs7104301
Recessive
Recessive
Recessive
1.27 (0.88-1.85)
1.25 (0.86-1.81)
0.78 (0.51-1.19)
G/G
75 (11.5%)
62 (13.3%)
A/A-A/G
577 (88.5%)
404 (86.7%)
A/A
74 (11.4%)
60(12.9%)
G/G-A/G
576(88.6%)
404 (87.1%)
G/G
69 (10.6%)
40 (8.6%)
A/A-A/G
584 (89.4%)
425 (91.4%)
80 (12.5%)
57 (12.4%)
rs769214
Recessive
0.86 (0.59-1.26)
G/G
A/A-A/G
560 (87.5%)
404 (87.6%)
rs5964125
Dominant
1.07 (0.81-1.40)
A/G-G/G
182 (27.8%)
130 (27.8%)
A/A
472 (72.2%)
337 (72.2%)
rs5964151
Dominan
1.10 (0.83-1.44)
G/T-G/G
181 (27.7%)
133 (28.5%)
T/T
472 (72.3%)
333 (71.5%)
rs1014852
Recessive
1.22 (0.29-5.19)
T/T
4 (0.6%)
4 (0.9%)
A/A-A/T
650 (99.4%)
463 (99.1%)
rs11415624
rs3736729
rs4140528
Recessive
Recessive
Dominant
0.90 (0.60-1.34)
0.74 (0.54-1.01)
0.98 (0.77-1.25)
A/A
73 (11.2%)
47 (10.1%)
D/D-D/A
579 (88.8%)
419 (89.9%)
C/C
147 (22.4%)
79 (16.9%)
A/A-A/C
508 (77.6%)
387 (83.1%)
C/T-T/T
297 (45.6%)
206 (44.4%)
C/C
354 (54.4%)
258 (55.6%)
A/A
93 (14.2%)
77 (16.5%)
rs7515191
Recessive
1.21 (0.86-1.70)
G/G-A/G
562 (85.8%)
390 (83.5%)
rs7549683
Recessive
1.21 (0.86-1.70)
T/T
93 (14.3%)
76 (16.3%)
G/G-G/T
556 (85.7%)
391 (83.7%)
rs4812042
Dominant
0.96 (0.75-1.23)
A/G-G/G
357 (55.6%)
258 (55.4%)
A/A
285 (44.4%)
208 (44.6%)
rs7121
Recessive
0.97 (0.71-1.32)
C/C
130 (20.3%)
93 (19.9%)
T/T-C/T
509 (79.7%)
374 (80.1%)
C/T-C/C
224 (34.3%)
169 (36.2%)
T/T
429 (65.7%)
298 (63.8%)
A/C-C/C
314 (51%)
272 (57.6%)
A/A
302 (49%)
200 (42.4%)
rs919196
rs406113
rs974334
Dominant
Dominant
Recessive
1.12 (0.87-1.45)
1.26 (0.98-1.62)
2.01 (1.07-3.80)
rs1002149
Dominant
0.95 (0.72-1.26)
rs2551715
Recessive
0.88 (0.62-1.26)
rs2911678
Recessive
0.96 (0.48-1.95)
rs8190996
Recessive
1.22 (0.89-1.66)
G/G
18 (2.8%)
25 (5.4%)
C/C-C/G
633 (97.2%)
441 (94.6%)
G/T-T/T
173 (28.2%)
127 (27.4%)
G/G
441 (71.8%)
337 (72.6%)
A/A
94 (14.4%)
60 (12.9%)
G/G-A/G
557 (85.6%)
405 (87.1%)
T/T
20 (3.1%)
14 (3%)
A/A-A/T
629 (96.9%)
445 (97%)
T/T
126 (19.4%)
96 (20.6%)
C/C-C/T
524 (80.6%)
371 (79.4%)
Rodrigues et al. BMC Cancer 2014, 14:861
/>
Page 7 of 15
Table 2 Comparison of genotype frequencies between breast cancer patients and controls (Set 1) (Continued)
rs13041792
Dominant
1.13 (0.88-1.45)
A/G-A/A
240 (36.9%)
181 (39.1%)
G/G
411 (63.1%)
282 (60.9%)
92 (19.8%)
rs2273684
Recessive
1.21 (0.88-1.65)
G/G
115 (17.6%)
T/T-G/T
539 (82.4%)
373 (80.2%)
rs1805754
Dominant
1.31 (1.02-1.68)
A/C-C/C
257 (40%)
215 (46.1%)
A/A
386 (60%)
251 (53.9%)
rs933462
Dominant
1.06 (0.82-1.38)
G/T-G/G
431 (66.6%)
317 (68%)
T/T
216 (33.4%)
149 (32%)
rs11013291
Recessive
1.09 (0.79-1.51)
C/C
106 (16.3%)
82 (17.6%)
T/T-C/T
546 (83.7%)
385 (82.4%)
rs2274064
rs2274065
Recessive
Dominant
0.88 (0.65-1.20)
1.21 (0.85-1.72)
C/C
136 (21.7%)
91 (20%)
T/T-C/T
491 (78.3%)
364 (80%)
A/C-C/C
84 (12.9%)
69 (14.8%)
A/A
568 (87.1%)
398 (85.2%)
T/T
143 (22.6%)
91 (19.7%)
rs2296164
Recessive
0.84 (0.62-1.14)
C/C-C/T
491 (77.4%)
370 (80.3%)
rs2072712
Dominant
1.16 (0.84-1.59)
C/T-T/T
108 (16.5%)
88 (18.9%)
C/C
547 (83.5%)
378 (81.1%)
rs570234
Dominant
1.03 (0.79-1.34)
A/C-C/C
388 (63.2%)
273 (63%)
A/A
226 (36.8%)
160 (37%)
rs576881
Dominant
1.13 (0.88-1.46)
A/G-G/G
390 (60.6%)
293 (62.9%)
A/A
254 (39.4%)
173 (37.1%)
A/C-A/A
211 (32.5%)
172 (36.8%)
C/C
438 (67.5%)
295 (63.2%)
rs816296
rs2779248
rs3729508
Dominant
Recessive
Dominant
1.20(0.93-1.55)
0.88 (0.60-1.29)
0.90 (0.69-1.18)
C/C
75 (11.7%)
55 (11.8%)
T/T-C/T
569 (88.3%)
410 (88.2%)
A/G-A/A
443 (70.4%)
316 (69%)
G/G
186 (29.6%)
142 (31%)
246 (37.6%)
177 (37.9%)
rs4827881
Dominant
1.00 (0.78-1.29)
A/C-A/A
C/C
408 (62.4%)
290 (62.1%)
rs5921682
Dominant
1.12 (0.85-1.47)
A/G-G/G
459 (70.4%)
339 (72.6%)
A/A
193 (29.6%)
128 (27.4%)
rs490934
Recessive
3.34 (0.57-19.43)
C/C
2 (0.3%)
4 (0.9%)
G/G-C/G
651 (99.7%)
463(99.1%)
rs1052133
Recessive
1.76 (1.00-3.10)
G/G
34 (5.1%)
28 (8.1%)
C/C-C/G
631 (94.9%)
319 (91.9%)
rs2842980
rs2855116
rs8031
Recessive
Dominant
Dominant
1.40 (0.82-2.37)
0.89 (0.68-1.16)
0.85 (0.65-1.10)
rs2284659
Recessive
1.30 (0.92-1.84)
rs2301241
Dominant
0.80 (0.60-1.07)
T/T
31 (4.9%)
31 (6.7%)
A/A-A/T
606 (95.1%)
435 (93.3%)
G/T-G/G
440 (69.3%)
313 (67%)
T/T
195 (30.7%)
154 (33%)
A/T-A/A
458 (70.6%)
313 (67.2%)
T/T
191 (29.4%)
153 (32.8%)
T/T
83 (12.9%)
80 (17.2%)
G/G-G/T
560 (87.1%)
386 (82.8%)
C/T-C/C
460 (74.4%)
348 (71.2%)
T/T
158 (25.6%)
141 (28.8%)
0.35
1450.9
0.24
1456
0.034**
1444.2
0.64
1452.2
0.6
1458.5
0.42
1413.4
0.3
1458.9
0.25
1434.1
0.37
1461.4
0.81
1355.7
0.33
1448.1
0.17
1455.6
0.52
1444.5
0.46
1421.5
0.98
1462.8
0.42
1459.8
0.16
1459.6
0.051**
1124
0.22
1439.2
0.39
1444.1
0.22
1454.3
0.14**
1445.6
0.14**
1350.5
Rodrigues et al. BMC Cancer 2014, 14:861
/>
Page 8 of 15
Table 2 Comparison of genotype frequencies between breast cancer patients and controls (Set 1) (Continued)
rs4135168
Dominant
1.17 (0.90-1.52)
rs4135179
Dominant
1.27 (0.97-1.66)
rs4135225
Recessive
0.66 (0.45-0.96)
rs2281082
Recessive
1.52 (0.73-3.17)
rs5756208
Recessive
1.54 (0.77-3.11)
rs10861201
rs4077561
Recessive
Recessive
0.69 (0.41-1.17)
1.20 (0.86-1.68)
A/G-G/G
238 (39.9%)
183 (43.4%)
A/A
359 (60.1%)
239 (56.6%)
A/G-G/G
178 (28%)
151 (32.8%)
A/A
458 (72%)
310 (67.2%)
C/C
104 (16.2%)
48 (10.5%)
T/T-C/T
536 (83.8%)
410 (89.5%)
T/T
15 (2.3%)
16 (3.5%)
G/G-G/T
627 (97.7%)
447 (96.5%)
T/T
17 (2.7%)
17 (3.7%)
A/A-A/T
618 (97.3%)
445 (96.3%)
A/A
49 (7.6%)
23 (5.1%)
C/C-A/C
592 (92.4%)
425 (94.9%)
T/T
92 (14.6%)
80 (17.4%)
C/T-T/T
540 (85.4%)
380 (82.6%)
356 (54.4%)
266 (57%)
rs4964287
Dominant
1.09 (0.85-1.40)
C/T-T/T
C/C
298 (45.6%)
201 (43%)
rs4964778
Dominant
1.17 (0.90-1.51)
C/G-G/G
216 (33.1%)
171 (36.7%)
C/C
436 (66.9%)
295 (63.3%)
rs4964779
Dominant
1.16 (0.80-1.68)
C/T-C/C
76 (11.8%)
62 (13.3%)
T/T
569 (88.2%)
405 (86.7%)
rs5018287
Recessive
1.12 (0.82-1.53)
A/A
118 (18%)
91 (19.6%)
G/G-A/G
536 (82%)
372 (80.4%)
A/G-G/G
298 (49%)
234 (53.4%)
A/A
310 (51%)
204 (46.6%)
C/T-C/C
177 (27.8%)
118 (26%)
T/T
460 (72.2%)
335 (74%)
rs737866
rs10175754
rs10187719
Dominant
Dominant
Recessive
1.16 (0.90-1.49)
0.92 (0.69-1.22)
0.80 (0.51-1.26)
T/T
59 (9.9%)
34 (7.9%)
C/C-C/T
539 (90.1%)
398 (92.1%)
16 (2.5%)
15 (3.2%)
rs1346644
Recessive
1.48 (0.71-3.09)
G/G
C/C-C/G
637 (97.5%)
450 (96.8%)
rs1429374
Dominant
1.15 (0.89-1.47)
A/G-A/A
356 (54.9%)
274 (59%)
G/G
292 (45.1%)
190 (41%)
rs1884725
Recessive
0.71 (0.42-1.22)
A/A
42 (6.5%)
23 (5%)
G/G-A/G
604 (93.5%)
439 (95%)
rs206801
Recessive
3.42 (0.33-35.82)
T/T
1 (0.2%)
3 (0.6%)
C/C-C/T
654 (99.8%)
464 (99.4%)
rs206812
rs2073316
rs207454
rs761926
Recessive
Recessive
Recessive
Dominant
0.96 (0.72-1.28)
1.14 (0.84-1.56)
4.98 (1.28-19.34)
0.85 (0.66-1.08)
A/A
159 (24.4%)
111 (23.8%)
G/G-A/G
494 (75.6%)
356 (76.2%)
A/A
118 (18.6%)
95 (20.8%)
G/G-A/G
517 (81.4%)
361 (79.2%)
C/C
3 (0.5%)
9 (1.9%)
A/A-A/C
646 (99.5%)
457 (98.1%)
C/G-G/G
334 (51.1%)
214 (45.8%)
C/C
319 (48.9%)
253 (54.2%)
0.23
1328
0.085**
1431
0.029**
1431.1
0.26
1443.5
0.23
1438.5
0.16
1411.8
0.28
1425
0.48
1461.9
0.24
1457.3
0.43
1451.5
0.47
1453.9
0.25
1364.1
0.55
1418.6
0.34
1353.8
0.29
1458
0.28
1450.4
0.21
1444.1
0.27
1462
0.78
1461.8
0.4
1423.7
0.012**
1450.3
0.18
1459.4
CI, confidence interval; OR, odds ratio. *p-values adjusted by age. In bold p-values <0.05. **polymorphisms with a p-value<=0.15. Set 1 (n=1176; cases=493 and
controls=683). The best model have been chosen with the criteria of lower AIC (Akaike information criterion) and lower BIC (Bayesian information criterion) values.
Only AIC is shown in table.
Rodrigues et al. BMC Cancer 2014, 14:861
/>
Page 9 of 15
Table 3 Genotype frequencies of relevant polymorphisms in different Sets
Gene SNP name
Set
Genetic Model
OR (95% CI)
Genotype
Controls
Patients
p-value
AIC
GCLC rs3736729
Set 1
Recessive
0.74 (0.54-1.01)
C/C
147 (22.4%)
79 (16.9%)
0.058
1458.7
A/A-A/C
508 (77.6%)
387 (83.1%)
Set 2
Recessive
0.89 (0.67-1.19)
C/C
191 (23.9%)
89 (21.8%)
0.43
1549.3
Set 1 + 2
Recessive
0.85 (0.73-1.00)
0.054
3160.5
Set 1
Dominant
1.26 (0.98-1.62)
0.066
1408.9
A/A
302 (49%)
200 (42.4%)
Set 2
Dominant
1.18 (0.93-1.50)
A/C-C/C
435 (54.2%)
241 (58.4%)
0.17
1559.7
A/A
367 (45.8%)
172 (41.6%)
Set 1 + 2
Dominant
1.23 (1.04-1.46)
A/C-C/C
759 (52.7%)
524 (57.8%)
0.015
3127.7
A/A
681 (47.3%)
382 (42.2%)
Set 1
Recessive
2.01 (1.07-3.80)
G/G
18 (2.8%)
25 (5.4%)
0.03
1452.9
C/C-C/G
633 (97.2%)
441 (94.6%)
Set 2
Recessive
1.45 (0.70-3.01)
G/G
17 (2.1%)
13 (3%)
0.33
1592.6
C/C-C/G
785 (97.9%)
415 (97%)
Set 1 + 2
Recessive
1.73 (1.09-2.73)
G/G
37 (2.5%)
39 (4.2%)
0.02
3194.7
C/C-C/G
1444 (97.5%)
881 (95.8%)
Set 1
Dominant
1.31 (1.02-1.68)
A/C-C/C
257 (40%)
215 (46.1%)
0.034
1444.2
A/A
386 (60%)
251 (53.9%)
Set 2
Dominant
1.05 (0.83-1.34)
A/C-C/C
347 (44.1%)
191 (45.4%)
0.67
1565.8
A/A
440 (55.9%)
230 (54.6%)
Set 1 + 2
Dominant
1.15 (0.98-1.36)
A/C-C/C
619 (42.5%)
420 (46%)
0.093
3160.7
A/A
838 (57.5%)
493 (54%)
Set 1
Recessive
1.76 (1.00-3.10)
G/G
34 (5.1%)
28 (8.1%)
0.051
1124
C/C-C/G
631 (94.9%)
319 (91.9%)
Set 2
Recessive
1.84 (1.11-3.07)
G/G
33 (4.1%)
30 (7.3%)
0.02
1543.7
C/C-C/G
767 (95.9%)
378 (92.7%)
Set 1 + 2
Recessive
1.82 (1.31-2.52)
G/G
64 (4.5%)
56 (7.9%)
4e-04
2665.8
C/C-C/G
1348 (95.5%)
655 (92.1%)
Set 1
Recessive
1.30 (0.92-1.84)
T/T
83 (12.9%)
80 (17.2%)
0.14
1445.6
G/G-G/T
560 (87.1%)
386 (82.8%)
Set 2
Recessive
1.25 (0.90-1.73)
T/T
109 (13.6%)
69 (16.4%)
0.19
1577
G/G-G/T
693 (86.4%)
352 (83.6%)
Set 1 + 2
Recessive
1.33 (1.05-1.67)
T/T
194 (13.2%)
153 (16.8%)
0.017
3172.3
G/G-G/T
1278 (86.8%)
760 (83.2%)
Set 1
Dominant
0.80 (0.60-1.07)
C/T-C/C
460 (74.4%)
348 (71.2%)
0.14
1350.5
T/T
158 (25.6%)
141 (28.8%)
Set 2
Dominant
1.35 (1.03-1.78
C/T-C/C
569 (71.2%)
318 (77%)
0.03
1554.4
T/T
230 (28.8%)
95 (23%)
Set 1 + 2
Dominant
1.05 (0.87-1.27)
C/T-C/C
1014 (72.9%)
660 (73.9%)
0.59
3060.6
T/T
377 (27.1%)
233 (26.1%)
Set 1
Dominant
1.27 (0.97-1.66)
A/G-G/G
178 (28%)
151 (32.8%)
0.085
1431
A/A
458 (72%)
310 (67.2%)
GPX6 rs406113
GPX6 rs974334
M6PR rs1805754
OGG1 rs1052133
SOD3 rs2284659
TXN rs2301241
TXN rs4135179
A/A-A/C
610 (76.2%)
319 (78.2%)
C/C
343 (23.1%)
177 (19.7%)
A/A-A/C
1141 (76.9%)
723 (80.3%)
A/C-C/C
314 (51%)
272 (57.6%)
Rodrigues et al. BMC Cancer 2014, 14:861
/>
Page 10 of 15
Table 3 Genotype frequencies of relevant polymorphisms in different Sets (Continued)
Set 2
Set 1 + 2
TXN rs4135225
Set 1
Set 2
Set 1 + 2
XDH rs207454
Set 1
Set 2
Set 1 + 2
Dominant
Dominant
Recessive
Recessive
Recessive
Recessive
Recessive
Recessive
1.08 (0.83-1.39)
1.14 (0.95-1.36)
0.66 (0.45-0.96)
0.97 (0.68-1.38)
0.77 (0.60-0.99)
4.98 (1.28-19.34)
1.61 (0.54-4.83)
2.12 (1.11-4.04)
A/G-G/G
248 (31%)
136 (32.5%)
A/A
553 (69%)
282 (67.5%)
A/G-G/G
435 (29.7%)
294 (32.5%)
A/A
1029 (70.3%)
611 (67.5%)
C/C
104 (16.2%)
48 (10.5%)
T/T-C/T
536 (83.8%)
410 (89.5%)
C/C
104 (13%)
53 (12.7%)
T/T-C/T
698 (87%)
366 (87.3%)
C/C
212 (14.4%)
104 (11.5%)
T/T-C/T
1257 (85.6%)
799 (88.5%)
C/C
3 (0.5%)
9 (1.9%)
A/A-A/C
646 (99.5%)
457 (98.1%)
C/C
7 (0.9%)
6 (1.4%)
A/A-A/C
793 (99.1%)
421 (98.6%)
C/C
11 (0.8%)
15 (1.6%)
A/A-A/C
1464 (99.2%)
904 (98.4%)
0.57
1571.2
0.16
3153
0.029
1431.1
0.87
1574.5
0.041
3151.7
0.012
1450.3
0.4
1589.1
0.024
3188.5
Table polymorphisms were chosen from the analysis of the first set of patients with the criteria of a cutoff p-value equal or lower a 0.15. Bold number indicate
result statistically significant, p-value<0.05. Set 1 (n = 1176; cases = 493 and controls=683), Set 2 (n = 1233; cases=430 and controls = 803), Set 1 + set 2 (n = 2409;
cases = 923 and controls=1486). GCLC: glutamate-cysteine ligase, catalytic subunit; GPX6: glutathione peroxidase 6; M6PR: mannose-6-phosphate receptor; OGG1:
8-oxoguanine DNA glycosylase; SOD3: superoxide dismutase 3; TXN: thioredoxin; XDH: xanthine dehydrogenase.
interactions [25]. The four most significantly associated
polymorphisms in set 1 + set 2 with susceptibility to BC
were selected for this analysis: rs406113 [OR: 1.23 (1.041.46)], rs974334 [OR: 1.73 (1.09-2.73)], rs1052133 [OR:1.82
(1.31-2.52)] and rs2284659 [OR:1.33 (1.05-1.67)]. Data from
1182 samples (controls and patients) from both groups
were used. The combination was performed grouping the
genotypes according to the model predicted for the four
polymorphisms: recessive model for rs1052133 (CC and
CG were grouped into a single block), dominant model for
rs406113 (CC and AC genotypes were grouped into a single
block), recessive model for rs974334 (CC and CG genotypes were grouped into a single block) and recessive model
for rs2284659 (GG and GT genotypes were grouped into a
single block). For a two-loci interaction, the combination of
polymorphisms rs406113 (GPX6) and rs1052133 (OGG1)
was the most significant (p = 0.041). The best three-loci
model included rs406113 on the GPX6 gene, rs1052133 on
the OGG1 gene and rs2284659 on the SOD3 gene, and it
showed statistical significance (p < 0.0007) with an OR =
1.82 and 95% CI = 1.28-2.58. A four-way interaction found
that between rs406113 on the GPX6 gene, rs974334 on the
GPX6 gene, rs1052133 on the OGG1 gene and rs2284659
on the SOD3 gene predicts breast cancer with a testing
balance accuracy of 0.5267. This four-loci model had a
chi-square value of 11.284 (p = 0.0008) and an OR of 1.75
[95% CI = 1.26-2.44]. The four polymorphism combinatory
model showed a higher predisposition to BC than the polymorphisms rs406113, rs974334 and rs2284659 did individually (ORX2 = 1.23, ORX3 = 1.73, ORX6 = 1.33) and had
values similar to the ones of polymorphism rs1052133
(ORX5 = 1.82). The summary of the multi-factor dimensionality results are listed in Table 4.
The combined genotype AA for rs406113, CC/CG for
rs974334, CC/CG for rs1052133 and GG/ GT for
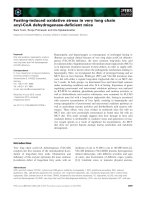
rs2284659 showed a higher risk for BC, which is consistent with the models described for the polymorphisms individually. Figure 1 summarizes the four-loci genotype
combinations associated with high and low risk and with
the distribution of cases and controls.
Discussion
Genetic association studies involving SNPs and their
possible interactions have become increasingly important for the study of human diseases. The present study
has focused on genes encoding for proteins of the redox
system. It is long proven that they are clearly involved in
extensive damage to DNA, which in turn leads to gene
mutations and, finally, carcinogenesis. The functionality
of polymorphisms in relation to oxidative stress has been
proven in several cases. For instance, the polymorphism
in exon 2 of the superoxide dismutase 2 (SOD2) gene
A16V (C/T) (rs4880) led to structural alterations in the
domain responsible to target the mitochondria, giving a
reduction in the antioxidant potential [26]. Furthermore,
a functional polymorphism in exon 9 of the CAT gene
and other polymorphisms in endothelia NO synthase
(eNOs) that seem relevant for their activity have been
documented [26-28]. Therefore, it is clear that a single
oligonucleotide modification can lead to structural
Rodrigues et al. BMC Cancer 2014, 14:861
/>
Page 11 of 15
Table 4 Summary of Multi-factor Dimensionality (MDR) results
Model
Training accuracy
Testing accuracy
OR (95% CI)
p-value
CVC*
X2
0.5215
0.5093
1.18 (0.93-1.51)
0.1797
8/10
X2 – X5
0.5319
0.5199
1.30 (1.01-1.66)
0.041
8/10
X2 – X5 – X6
0.5353
0.5210
1.82 (1.28-2.58)
0.0007
7/10
X2 – X3 – X5 – X6
0.5371
0.5267
1.75 (1.26-2.44)
0.0008
10/10
The polymorphisms rs406113, rs974334, rs1052133 and rs2284659 showing the highest statistical significance in the combinatorial set1 + set 2 were chosen for
gene-gene interaction analysis. *CVC, cross-validation consistency. Testing accuracy, p-value and CVC significant were highlighted in bold.
X2 = rs406113 (GPX6), X3 = rs974334 (GPX6), X5 = rs1052133 (OGG1), X6 = rs2284659 (SOD3).
changes, modifications in the affinity to bind proteins or
in activity that may be relevant to the redox system. Our
hypothesis was that variations in genes from the stress
oxidative pathway, that have shown to have a possible
linkage to BC, can be associated with predisposition to
this disease. Indeed, genetic variations in these pathways
have shown to modify the risk for BC [29].
In the present epidemiological study, we have assessed
the effect of 76 SNPs in 27 genes in a case–control study in
a Spanish population. Genotype distributions in the controls did not differ significantly from those expected under
HWE. The study was performed in two independent sets of
patients and controls, first, to select the relevant polymorphisms and second, to check the reproducibility and significance of these preliminary results.
Six SNPs (rs406113 and rs974334 on the glutathione
peroxidase 6 (GPX6) gene, rs1052133 on the 8-oxoguanine
DNA glycosylase (OGG1) gene, rs2284659 on the superoxide dismutase 3 (SOD3) gene, rs4135225 on the thioredoxin (TXN) gene and rs207454 on the xanthine
dehydrogenase (XDH) gene) are associated with variations in the predisposition to BC.
The rs406113 (c.39 T > G; p.F13L) and rs974334
(c.242-12G > C) polymorphisms on the GPX6 gene had
not been studied previously; in fact, there was no information available in the literature about polymorphisms
on the GPX6 gene even though they can have a functional effect. Genetic variants in other genes of the GPX
family have been associated with BC [30-32].
Thioredoxin (TXN) is overexpressed in BC, and it is
related to tumor grade [33], being a crucial element in
redox homeostasis [34]. Studies of polymorphisms in the
TXN gene, encoding thioredoxin, are few in cancer. Seibold
et al. [19], evaluated the influence of common variants on
Figure 1 The polymorphisms rs406113, rs974334, rs1052133 and rs2284659, showing the highest statistical significance in the
combinatorial set 1 + set 2, were chosen for the gene-gene interaction analysis. The MDR analysis was done with the genotypes collapsed
according to the genetic models selected: rs1052133 (OGG1) recessive model; CC/CG vs.GG, rs406113 (GPX6) dominant model; CC/AC vs. AA,
rs974334 (GPX6) recessive model; CC/CG vs. GG, rs2284659 (SOD3) recessive model; GG/GT vs. TT. The figure shows the summary of four-loci genotype
combinations associated with high and low risk. Cases: left bars, controls: right bars. The epistatic gene-gene interaction corresponds to the high risk
combinations (darkest color).
Rodrigues et al. BMC Cancer 2014, 14:861
/>
TXN, thioredoxin reductase 1 (TXNRD1) and thioredoxin
2 (TXN2) genes and the risk of BC after menopause, including seven of the SNPs analyzed in our study.
Rs2301241 and rs2281082 were not significantly related to
BC risk in our study, however, Seibold et al. found a limited
association of rs2301241 with BC risk when comparing rare
homozygote vs. common homozygote. Other studies found
a borderline significance [18]. In the case of rs2281082, the
borderline association of the Seibold study was not confirm
in other publications [19]. In our study population, we
found that carriers of one T allele on rs4135225 (c.196192C > T) were associated with lower risk for BC development (OR = 0.77 [95% CI; 0.60-0.99] p = 0.041). Seidbol
et al. found a predisposition to BC for this polymorphisms
(OR = 1.22 [95% CI; 1.06-1.41]. One must take into account
that the Seidbold study is focused in postmenopausal
women, unlike ours. Still, in their analysis, they compared
only two of the three possible genotypes (heterozygotes vs.
common homozygotes). In any case, their results showed
borderline significance.
The xanthine dehydrogenase (XDH) is an important
enzyme involved in the first-pass metabolism of 6mercaptopurine [35]. Polymorphisms in the XDH gene
have been related to cancer. The rs1884725 polymorphism has been identify as a genetic variant associated with
disease risk and outcomes in multiple myeloma [36]. In
our study, one of the thirteen polymorphisms evaluated
on this gene showed an association with BC risk. Carriers of one A allele of rs207454 displayed 2.12 times
([95% CI; 1.11-4.04], p = 0.024) more risk to develop the
illness than did non-carriers. To our knowledge, there
are no studies of these polymorphisms in the literature.
The results presented here suggest an association with
the development of BC, although further confirmatory
studies would be needed to confirm it.
The polymorphism on the SOD3 gene (rs2284659) analyzed in our study showed a trend to the predisposition
for BC in the global analysis. There was no information
about this polymorphism in the literature. Other polymorphisms in this gene, like rs2536512 and rs699473,
have been associated in BC patients with the incidence
of tumor and poorer progression-free survival (PFS)
[37]. Moreover, some results suggest that rs699473 may
influence brain tumor risk [38].
The variant rs1052133 (Ser326Cys) in the OGG1 gene
has the same tendency to predisposition for BC in both
sets, separately and in the combined data set. Concerning
this polymorphism, previous studies had conflicting results [39-45]. Three meta-analyses have attempted to
summarize the results [39,41,46]. In one study, the authors
analyzed this polymorphism in relation to several cancers
founding only significant association with the risk for lung
cancer [46]. The others two meta-analyses are focused on
BC, and the results are contradictory. Yuan et al. found an
Page 12 of 15
association just in the European population subgroup [41],
while Gu et al. did not show any association, even when
stratifying the analysis by ethnicity or menopausal status
[39]. These differences may have arisen from the different
number of studies included in the European group.
We found an increment for the risk to develop BC in
the carriers of at least one Ser allele (recessive model) if
we consider the sets both separately and together ((OR =
1.82 [95% CI 1.31-2.52]) and p-value = 0.0004). Our results
are in concordance with the meta-analysis by Yuan and
collaborators that suggests that the hOGG1 326 Cys allele
provides a significant protective effect for BC in European
women [41]. The importance of this SNP rests in the role
of the 8-oxoguanine DNA glycosylase, encoded by OGG1
[47]. This enzyme can excise the 8-hydroxy-2´-deoxyguanosine (8-OHdG) modifications occurring in the DNA as
a result of hydroxyl radical interaction [41,48,49]. An incorrect expression of the protein could interfere with the
suitable repair of the genetic material. Other polymorphisms in the OGG1 gene, like rs2304277, and recently
described by Osorio et al., have been associated with ovarian cancer risk in BRCA1 mutation carriers [50]. This data
certainly support the importance of genetic changes in the
OGG1 gene in relation to the predisposition to cancer.
The epistatic analysis of the four most significant polymorphisms in relation to the susceptibility to BC was
performed with the MDR method. This is a reliable approach that has been widely used [23,25,51-54]. The
combination was performed grouping the genotypes according to the model predicted for the four polymorphisms in Tables 2 and 3. The result obtained was an
OR = 1.75 [95% CI = 1.26-2.44; p-value = 0.0008], a value
similar to that obtained for rs1052133 (OR = 1.82 [95%
CI = 1.31-2.52; p-value = 0.0004]). The previous study of
Cebrian et al. in antioxidant defence enzymes and BC
susceptibility has twelve common SNPs with our study.
Two showed discrepancies with our data: Rs511895 in
the CAT gene was not significant in our analysis, but it
presented a borderline tendency in the Cebrian et al.
study. Moreover, they found a significant difference in
genotype distribution between cases and controls in
rs4135179 (TXN). We, however, were unable to confirm
this in our global analysis, although we detected a marginal significance in set 1. The reason for this discrepancy can be found in the population’s characteristics, in
the superior age of the population included in the Cebrian study [18].
Our study has several limitations to take into consideration. Firstly, there is no data available about the lifestyle
of controls and patients that could be related to oxidative stress, such as diet, exercise and the consumption of
tobacco and alcohol. Secondly, polymorphisms that were
not explored in our study may affect the risk to develop
BC and should be taken into account in the analysis of
Rodrigues et al. BMC Cancer 2014, 14:861
/>
our data and in further studies. Nevertheless, the association between SNPs and risk for BC is reliable since that
power exceeded 95% in all the cases. All samples are
from the same country and ethnicity, and the adjustment
for age reduces variability.
Additionally, MDR has 80% statistical power to detect
true interactions in two-, three-, and four-way gene-gene
interactions, even with a small number of cases and controls [24]. Furthermore, several associations detected in
these data involved SNPs occurring in non-coding regions. However, variations in the intronic structure have
been proposed to influence cancer susceptibility via
regulation of gene expression, gene splicing or mRNA
stability. It is also possible that these polymorphisms are
in linkage disequilibrium with other functional polymorphisms that may affect BC susceptibility.
Despite these considerations, our work, as far as we
know, is the largest study in the Spanish population that
analyzes the influence of polymorphisms in oxidative genes
in susceptibility to BC. Overall, our data, together with that
published in the bibliography [18,19,29,37,41,45,55-62],
suggest a role of stress-response gene variants in the susceptibility to BC.
Conclusions
Our results suggest that different genotypes in genes of
the oxidant/antioxidant pathway could affect the susceptibility to breast cancer. We have found six polymorphisms
in OGG1, GPX6, SOD3, TXN and XDH genes significantly
associated with predisposition to breast cancer. These associations have not been described previously, except for
rs1052133 (OGG1). Concerning this polymorphism the
published results in breast cancer were contradictory, and
some authors found only a significant association with the
risk of developing lung cancer. We have found an increment in the risk of developing breast cancer in the carriers
of at least one Ser allele (recessive model) in concordance
with a meta-analysis of breast cancer susceptibility in
European women. In this particular case, an incorrect expression of the protein encoded by the OGG1 gene could
interfere with the suitable repair of the genetic material.
Furthermore, our study highlighted the importance of the
analysis of the epistatic interactions in order to define the
influence of genetic variants in susceptibility to breast cancer more precisely. Further studies on the relevance of
these and other polymorphisms in the development of
breast cancer should be performed.
Abbreviations
BC: Breast cancer; BRCA1: Breast cancer 1; CI: Confidence interval;
CAT: Catalase; CYBB: Cytochrome b-245, beta polypeptide; GCLC: Glutamatecysteine ligase, catalytic subunit; GCLM: Glutamate-cysteine ligase, modifier
subunit; GNAS: GNAS complex locus; GPX6: Glutathione peroxidase 6;
GSR: Glutathione reductase; GSS: Glutathione synthetase; HWE: HardyWeinberg Equilibrium; MAF: Minor Allele Frequency; MDR: Multifactor
dimensionality reduction; M6PR: mannose-6-phosphate receptor;
Page 13 of 15
MSRB2: Methionine sulfoxide reductase B2; NCF2: Neutrophil cytosolic factor
2; NCF4: Neutrophil cytosolic factor 4; NOS1: Nitric oxide synthase 1;
NOS2A: Nitric oxide synthase 2; NOX1: NADPH oxidase 1; NOX3: NADPH
oxidase 3; NOX4: NADPH oxidase 4; NOX5: NADPH oxidase 5; OGG1:
8-oxoguanine DNA glycosylase; OR: Odds ratio; RNS: Reactive Nitrogen
Species; ROS: Reactive Oxygen Species; SOD1: Superoxide dismutase 1;
SOD2: Superoxide dismutase 2; SOD3: Superoxide dismutase 3; SNPs: Single
Nucleotide Polymorphisms; TXN: Thioredoxin; TXN2: Thioredoxin 2;
TXNRD1: Thioredoxin reductase 1; TXNRD2: Thioredoxin reductase 2;
XDH: Xanthine dehydrogenase.
Competing interests
The authors declare that they have no competing interests.
Authors’ contributions
PR processed the material, extracted DNA, prepared samples for SNPlex,
analyzed all the data, performed statistical analyses, carried out literature
searches and contributed in the drafting of the manuscript. GdM processed
samples, optimized the technique used, contributed to the analysis of the
data and revised the manuscript. JF processed samples and helped in the
data analyses, interpretation of the results and in drafting the manuscript.
MLM performed the SNPlex protocol, analyzed the data and contributed in
the drafting of the manuscript. MPA and AG-N helped in the sample processing
and interpretation of the results and revised the final manuscript. JC M-E and JB
performed the selection of the patients, provided intellectual content and revised
the final manuscript; ALL performed the conceptual design, performed the
selection of the patients, supervised the study, revised the manuscript and
participated in the acquisition of funding. FJC performed the conceptual
design of the study, revised the manuscript and provided intellectual content.
PE conceived and supervised the study, contributed to the interpretation of the
data, gave intellectual support, contributed to writing the manuscript and
helped in the acquisition of funding. All authors have given final approval to
the version to be published.
Acknowledgements
This work has been supported by grants PS09/01700 and PI12/01421
(Ministerio de Ciencia y Tecnología-Fondo de Investigación Sanitaria del
Instituto de Salud Carlos III-FEDER) and RD12/0036/0070 (RTICC) to A.LL. and by
grants GE-004/09 and ACOMP/2009/201 (Consellería de Sanidad Valenciana). JF
was funded from the RTICC RD12/0036/0070, and PR has been hired under the
Santiago Grisolia program. CEGEN is funded by the Instituto de Salud Carlos III.
Author details
1
INCLIVA Biomedical Research Institute, Valencia, Spain. 2Genotyping and
Genetic Diagnosis Unit, Hospital Clínico Universitario de Valencia INCLIVA
Biomedical Research Institute, Valencia, Spain. 3Internal Medicine, Hospital Rio
Hortega, University of Valladolid, Valladolid, Spain. 4Human Genetics Group,
Spanish National Cancer Centre (CNIO) and Biomedical Network on Rare
Diseases (CIBERER), Madrid, Spain. 5Department of Haematology and Medical
Oncology, Hospital Clínico Universitario de Valencia, Valencia, Spain.
6
Genotyping Unit, CEGEN, Spanish National Cancer Center (CNIO), Madrid,
Spain. 7Current address: Clinical Institute 1 CCBIO, University of Bergen,
Bergen, Norway. 8Current address: Department of Nutrition and Food
Sciences, Physiology and Toxicology, University of Navarra, Pamplona, Spain.
Received: 13 March 2014 Accepted: 14 November 2014
Published: 21 November 2014
References
1. Dumitrescu RG, Cotarla I: Understanding breast cancer risk – where do
we stand in 2005? J Cell Mol Med 2005, 9(1):208–221.
2. Stratton MR, Rahman N: The emerging landscape of breast cancer
susceptibility. Nat Genet 2008, 40(1):17–22.
3. Sun Y: Free radicals, antioxidant enzymes, and carcinogenesis. Free Radic
Biol Med 1990, 8(6):583–599.
4. Valko M, Leibfritz D, Moncol J, Cronin MT, Mazur M, Telser J: Free radicals
and antioxidants in normal physiological functions and human disease.
Int J Biochem Cell Biol 2007, 39(1):44–84.
5. Valko M, Rhodes CJ, Moncol J, Izakovic M, Mazur M: Free radicals, metals
and antioxidants in oxidative stress-induced cancer. Chem Biol Interact
2006, 160(1):1–40.
Rodrigues et al. BMC Cancer 2014, 14:861
/>
6.
7.
8.
9.
10.
11.
12.
13.
14.
15.
16.
17.
18.
19.
20.
21.
22.
23.
24.
25.
26.
27.
28.
Parri M, Chiarugi P: Redox molecular machines involved in tumor
progression. Antioxid Redox Signal 2013, 19(15):1828–1845.
Scott TL, Rangaswamy S, Wicker CA, Izumi T: Repair of oxidative DNA
damage and cancer: recent progress in DNA base excision repair.
Antioxid Redox Signal 2014, 20(4):708–726.
Cerutti PA: Prooxidant states and tumor promotion. Science 1985,
227(4685):375–381.
Trush MA, Kensler TW: An overview of the relationship between
oxidative stress and chemical carcinogenesis. Free Radic Biol Med 1991,
10(3–4):201–209.
Costa A, Scholer-Dahirel A, Mechta-Grigoriou F: The role of reactive oxygen
species and metabolism on cancer cells and their microenvironment.
Semin Cancer Biol 2014, 25:23–32.
Trachootham D, Lu W, Ogasawara MA, Nilsa RD, Huang P: Redox regulation
of cell survival. Antioxid Redox Signal 2008, 10(8):1343–1374.
Elchuri S, Oberley TD, Qi W, Eisenstein RS, Jackson Roberts L, Van Remmen
H, Epstein CJ, Huang TT: CuZnSOD deficiency leads to persistent and
widespread oxidative damage and hepatocarcinogenesis later in life.
Oncogene 2005, 24(3):367–380.
Neumann CA, Krause DS, Carman CV, Das S, Dubey DP, Abraham JL,
Bronson RT, Fujiwara Y, Orkin SH, Van Etten RA: Essential role for the
peroxiredoxin Prdx1 in erythrocyte antioxidant defence and tumour
suppression. Nature 2003, 424(6948):561–565.
Acharya A, Das I, Chandhok D, Saha T: Redox regulation in cancer: a
double-edged sword with therapeutic potential. Oxid Med Cell Longev
2010, 3(1):23–34.
Fang J, Seki T, Maeda H: Therapeutic strategies by modulating oxygen
stress in cancer and inflammation. Adv Drug Deliv Rev 2009, 61(4):290–302.
Ivanova D, Bakalova R, Lazarova D, Gadjeva V, Zhelev Z: The impact of
reactive oxygen species on anticancer therapeutic strategies. Adv Clin
Exp Med 2013, 22(6):899–908.
Milaeva ER: Metal-based antioxidants–potential therapeutic candidates
for prevention the oxidative stress-related carcinogenesis: mini-review.
Curr Top Med Chem 2011, 11(21):2703–2713.
Cebrian A, Pharoah PD, Ahmed S, Smith PL, Luccarini C, Luben R, Redman K,
Munday H, Easton DF, Dunning AM, Ponder BA: Tagging single-nucleotide
polymorphisms in antioxidant defense enzymes and susceptibility to
breast cancer. Cancer Res 2006, 66(2):1225–1233.
Seibold P, Hein R, Schmezer P, Hall P, Liu J, Dahmen N, Flesch-Janys D,
Popanda O, Chang-Claude J: Polymorphisms in oxidative stress-related
genes and postmenopausal breast cancer risk. Int J Cancer 2011,
129(6):1467–1476.
Hirschhorn JN, Daly MJ: Genome-wide association studies for common
diseases and complex traits. Nat Rev Genet 2005, 6(2):95–108.
Tobler AR, Short S, Andersen MR, Paner TM, Briggs JC, Lambert SM, Wu PP,
Wang Y, Spoonde AY, Koehler RT, Peyret N, Chen C, Broomer AJ, Ridzon DA,
Zhou H, Hoo BS, Hayashibara KC, Leong LN, Ma CN, Rosenblum BB, Day JP,
Ziegle JS, De La Vega FM, Rhodes MD, Hennessy KM, Wenz HM: The SNPlex
genotyping system: a flexible and scalable platform for SNP genotyping.
J Biomol Tech 2005, 16(4):398–406.
Sole X, Guino E, Valls J, Iniesta R, Moreno V: SNPStats: a web tool for the
analysis of association studies. Bioinformatics 2006, 22(15):1928–1929.
Moore JH, Gilbert JC, Tsai CT, Chiang FT, Holden T, Barney N, White BC: A
flexible computational framework for detecting, characterizing, and
interpreting statistical patterns of epistasis in genetic studies of human
disease susceptibility. J Theor Biol 2006, 241(2):252–261.
Ritchie MD, Hahn LW, Moore JH: Power of multifactor dimensionality
reduction for detecting gene-gene interactions in the presence of
genotyping error, missing data, phenocopy, and genetic heterogeneity.
Genet Epidemiol 2003, 24(2):150–157.
Ritchie MD, Hahn LW, Roodi N, Bailey LR, Dupont WD, Parl FF, Moore JH:
Multifactor-dimensionality reduction reveals high-order interactions
among estrogen-metabolism genes in sporadic breast cancer. Am J Hum
Genet 2001, 69(1):138–147.
Banerjee M, Vats P: Reactive metabolites and antioxidant gene polymorphisms
in type 2 diabetes mellitus. Indian J Hum Genet 2014, 20(1):10–19.
dos Santos KG, Canani LH, Gross JL, Tschiedel B, Souto KE, Roisenberg I: The
catalase -262C/T promoter polymorphism and diabetic complications in
Caucasians with type 2 diabetes. Dis Markers 2006, 22(5–6):355–359.
Tarnai I, Csordas M, Sukei E, Shemirani AH, Kaplar M, Goth L: Effect of
C111T polymorphism in exon 9 of the catalase gene on blood catalase
Page 14 of 15
29.
30.
31.
32.
33.
34.
35.
36.
37.
38.
39.
40.
41.
42.
43.
44.
45.
46.
47.
48.
activity in different types of diabetes mellitus. Free Radic Res 2007,
41(7):806–811.
Ambrosone CB, Freudenheim JL, Thompson PA, Bowman E, Vena JE,
Marshall JR, Graham S, Laughlin R, Nemoto T, Shields PG: Manganese
superoxide dismutase (MnSOD) genetic polymorphisms, dietary
antioxidants, and risk of breast cancer. Cancer Res 1999, 59(3):602–606.
Cox DG, Tamimi RM, Hunter DJ: Gene x Gene interaction between
MnSOD and GPX-1 and breast cancer risk: a nested case–control study.
BMC Cancer 2006, 6:217.
Ravn-Haren G, Olsen A, Tjonneland A, Dragsted LO, Nexo BA, Wallin H,
Overvad K, Raaschou-Nielsen O, Vogel U: Associations between GPX1
Pro198Leu polymorphism, erythrocyte GPX activity, alcohol consumption
and breast cancer risk in a prospective cohort study. Carcinogenesis 2006,
27(4):820–825.
Tsai SM, Wu SH, Hou MF, Chen YL, Ma H, Tsai LY: Oxidative stress-related
enzyme gene polymorphisms and susceptibility to breast cancer in
non-smoking, non-alcohol-consuming Taiwanese women: a case–control
study. Ann Clin Biochem 2012, 49(Pt 2):152–158.
Cha MK, Suh KH, Kim IH: Overexpression of peroxiredoxin I and thioredoxin1
in human breast carcinoma. J Exp Clin Cancer Res 2009, 28:93.
Penney RB, Roy D: Thioredoxin-mediated redox regulation of resistance
to endocrine therapy in breast cancer. Biochim Biophys Acta 2013,
1836(1):60–79.
Bostrom B, Erdmann G: Cellular pharmacology of 6-mercaptopurine
in acute lymphoblastic leukemia. Am J Pediatr Hematol Oncol 1993,
15(1):80–86.
Van Ness B, Ramos C, Haznadar M, Hoering A, Haessler J, Crowley J, Jacobus S,
Oken M, Rajkumar V, Greipp P, Barlogie B, Durie B, Katz M, Atluri G, Fang G,
Gupta R, Steinbach M, Kumar V, Mushlin R, Johnson D, Morgan G: Genomic
variation in myeloma: design, content, and initial application of the Bank
On A Cure SNP Panel to detect associations with progression-free survival.
BMC Med 2008, 6:26.
Hubackova M, Vaclavikova R, Ehrlichova M, Mrhalova M, Kodet R, Kubackova
K, Vrana D, Gut I, Soucek P: Association of superoxide dismutases and
NAD(P)H quinone oxidoreductases with prognosis of patients with
breast carcinomas. Int J Cancer 2012, 130(2):338–348.
Rajaraman P, Hutchinson A, Rothman N, Black PM, Fine HA, Loeffler JS,
Selker RG, Shapiro WR, Linet MS, Inskip PD: Oxidative response gene
polymorphisms and risk of adult brain tumors. Neuro Oncol 2008,
10(5):709–715.
Gu D, Wang M, Zhang Z, Chen J: Lack of association between the hOGG1
Ser326Cys polymorphism and breast cancer risk: evidence from 11
case–control studies. Breast Cancer Res Treat 2010, 122(2):527–531.
Romanowicz-Makowska H, Smolarz B, Makowski M, Polac I, Pertynski T:
Ser326Cys polymorphism in DNA repair genes hOGG1 in breast cancer
women. Pol J Pathol 2008, 59(4):201–204.
Yuan W, Xu L, Feng Y, Yang Y, Chen W, Wang J, Pang D, Li D: The hOGG1
Ser326Cys polymorphism and breast cancer risk: a meta-analysis. Breast
Cancer Res Treat 2010, 122(3):835–842.
Sangrajrang S, Schmezer P, Burkholder I, Waas P, Boffetta P, Brennan P,
Bartsch H, Wiangnon S, Popanda O: Polymorphisms in three base excision
repair genes and breast cancer risk in Thai women. Breast Cancer Res
Treat 2008, 111(2):279–288.
Synowiec E, Stefanska J, Morawiec Z, Blasiak J, Wozniak K: Association
between DNA damage, DNA repair genes variability and clinical
characteristics in breast cancer patients. Mutat Res 2008, 648(1–2):65–72.
Cai Q, Shu XO, Wen W, Courtney R, Dai Q, Gao YT, Zheng W: Functional
Ser326Cys polymorphism in the hOGG1 gene is not associated with
breast cancer risk. Cancer Epidemiol Biomarkers Prev 2006, 15(2):403–404.
Choi JY, Hamajima N, Tajima K, Yoo KY, Yoon KS, Park SK, Kim SU, Lee KM,
Noh DY, Ahn SH, Choe KJ, Han W, Hirvonen A, Kang D: hOGG1 Ser326Cys
polymorphism and breast cancer risk among Asian women. Breast Cancer
Res Treat 2003, 79(1):59–62.
Wei B, Zhou Y, Xu Z, Xi B, Cheng H, Ruan J, Zhu M, Hu Q, Wang Q, Wang Z,
Yan Z, Jin K, Zhou D, Xuan F, Huang X, Shao J, Lu P: The effect of hOGG1
Ser326Cys polymorphism on cancer risk: evidence from a meta-analysis.
PLoS One 2011, 6(11):e27545.
Hirano T: Repair system of 7, 8-dihydro-8-oxoguanine as a defense line
against carcinogenesis. J Radiat Res 2008, 49(4):329–340.
David SS, O’Shea VL, Kundu S: Base-excision repair of oxidative DNA
damage. Nature 2007, 447(7147):941–950.
Rodrigues et al. BMC Cancer 2014, 14:861
/>
Page 15 of 15
49. Friedman JI, Stivers JT: Detection of damaged DNA bases by DNA
glycosylase enzymes. Biochemistry 2010, 49(24):4957–4967.
50. Osorio A, Milne R, Kuchenbaecker K, Vaclová T, Pita G, Alonso R, Peterlongo
P, Blanco I: DNA glycosylases involved in Base Excision Repair may be
associated with cancer risk in BRCA1 and BRCA2 mutation carriers.
Plos Genet 2014, 10(4):e1004256.
51. Andrew AS, Karagas MR, Nelson HH, Guarrera S, Polidoro S, Gamberini S,
Sacerdote C, Moore JH, Kelsey KT, Demidenko E, Vineis P, Matullo G: DNA
repair polymorphisms modify bladder cancer risk: a multi-factor analytic
strategy. Hum Hered 2008, 65(2):105–118.
52. Gui J, Andrew AS, Andrews P, Nelson HM, Kelsey KT, Karagas MR, Moore JH:
A robust multifactor dimensionality reduction method for detecting
gene-gene interactions with application to the genetic analysis of
bladder cancer susceptibility. Ann Hum Genet 2011, 75(1):20–28.
53. Ihsan R, Chauhan PS, Mishra AK, Yadav DS, Kaushal M, Sharma JD, Zomawia
E, Verma Y, Kapur S, Saxena S: Multiple analytical approaches reveal
distinct gene-environment interactions in smokers and non smokers in
lung cancer. PLoS One 2011, 6(12):e29431.
54. Su MW, Tung KY, Liang PH, Tsai CH, Kuo NW, Lee YL: Gene-gene and
gene-environmental interactions of childhood asthma: a multifactor
dimension reduction approach. PLoS One 2012, 7(2):e30694.
55. Chen X, Wang J, Guo W, Liu X, Sun C, Cai Z, Fan Y, Wang Y: Two functional
variations in 5’-UTR of hoGG1 gene associated with the risk of breast
cancer in Chinese. Breast Cancer Res Treat 2011, 127(3):795–803.
56. He C, Tamimi RM, Hankinson SE, Hunter DJ, Han J: A prospective study of
genetic polymorphism in MPO, antioxidant status, and breast cancer
risk. Breast Cancer Res Treat 2009, 113(3):585–594.
57. Oestergaard MZ, Tyrer J, Cebrian A, Shah M, Dunning AM, Ponder BA,
Easton DF, Pharoah PD: Interactions between genes involved in the
antioxidant defence system and breast cancer risk. Br J Cancer 2006,
95(4):525–531.
58. McCullough LE, Santella RM, Cleveland RJ, Bradshaw PT, Millikan RC, North
KE, Olshan AF, Eng SM, Ambrosone CB, Ahn J, Steck SE, Teitelbaum SL,
Neugut AI, Gammon MD: Polymorphisms in oxidative stress genes,
physical activity, and breast cancer risk. Cancer Causes Control 2012,
23(12):1949–1958.
59. Rossner P Jr, Terry MB, Gammon MD, Zhang FF, Teitelbaum SL, Eng SM,
Sagiv SK, Gaudet MM, Neugut AI, Santella RM: OGG1 polymorphisms and
breast cancer risk. Cancer Epidemiol Biomarkers Prev 2006, 15(4):811–815.
60. Li Y, Ambrosone CB, McCullough MJ, Ahn J, Stevens VL, Thun MJ, Hong CC:
Oxidative stress-related genotypes, fruit and vegetable consumption
and breast cancer risk. Carcinogenesis 2009, 30(5):777–784.
61. Crawford A, Fassett RG, Geraghty DP, Kunde DA, Ball MJ, Robertson IK,
Coombes JS: Relationships between single nucleotide polymorphisms of
antioxidant enzymes and disease. Gene 2012, 501(2):89–103.
62. Weiss JM, Goode EL, Ladiges WC, Ulrich CM: Polymorphic variation in
hOGG1 and risk of cancer: a review of the functional and epidemiologic
literature. Mol Carcinog 2005, 42(3):127–141.
doi:10.1186/1471-2407-14-861
Cite this article as: Rodrigues et al.: Oxidative stress in susceptibility to
breast cancer: study in Spanish population. BMC Cancer 2014 14:861.
Submit your next manuscript to BioMed Central
and take full advantage of:
• Convenient online submission
• Thorough peer review
• No space constraints or color figure charges
• Immediate publication on acceptance
• Inclusion in PubMed, CAS, Scopus and Google Scholar
• Research which is freely available for redistribution
Submit your manuscript at
www.biomedcentral.com/submit