Asset Valuation & Allocation Models
Bạn đang xem bản rút gọn của tài liệu. Xem và tải ngay bản đầy đủ của tài liệu tại đây (787.96 KB, 28 trang )
July 30, 2002
Dr. Edward Yardeni
(212) 778-2646
Amalia F. Quintana
(212) 778-3201
Asset Valuation & Allocation
Models
Research
Page 2 / July 30, 2002 / Prudential Securities Asset Valuation & Allocation Models
-
Introduction
-
I. Fed’s Stock Valuation Model
How can we judge whether stock prices are too high, too low, or just right? The purpose
of this weekly report is to track a stock valuation model that attempts to answer this
question. While the model is very simple, it has been quite accurate and can also be used
as a stocks-versus-bonds asset allocation tool. I started to study the model in 1997, after
reading that the folks at the Federal Reserve have been using it. If it is good enough for
them, it’s good enough for me. I dubbed it the Fed’s Stock Valuation Model (FSVM),
though no one at the Fed ever officially endorsed it.
On December 5, 1996, Alan Greenspan, Chairman of the Federal Reserve Board,
famously worried out loud for the first time about “irrational exuberance” in the stock
market. He didn’t actually say that stock prices were too high. Rather he asked the
question: “But how do we know when irrational exuberance has unduly escalated asset
values, which then become subject to unexpected and prolonged contractions….”
1
He did
it again on February 26, 1997.
2
2
He probably instructed his staff to devise a stock market
valuation model to help him evaluate the extent of the market’s exuberance. Apparently,
they did so and it was made public, though buried, in the Fed’s Monetary Policy Report
to the Congress, which accompanied Mr. Greenspan’s Humphrey-Hawkins testimony on
July 22, 1997.
3
The Fed model was summed up in one paragraph and one chart on page 24 of the 25-
page document (see following table). The chart shows a strong correlation between the
S&P 500 forward earnings yield (FEY)—i.e., the ratio of expected operating earnings (E)
to the price index for the S&P 500 companies (P), using 12- month-ahead consensus
earnings estimates compiled by Thomson Financial First Call.—and the 10-year Treasury
bond yield (TBY). The average spread between the forward earnings yield and the
Treasury yield (i.e., FEY-TBY) is 29 basis points since 1979. This near-zero average
implies that the market is fairly valued when the two are identical:
1) FEY = TBY
Of course, in the investment community, we tend to follow the price-to-earnings ratio
more than the earnings yield. The ratio of the S&P 500 price index to expected earnings
(P/E) is highly correlated with the reciprocal of the 10-year bond yield, and on average
the two have been nearly identical. In other words, the “fair value” price for the S&P 500
(FVP) is equal to expected earnings divided by the bond yield in the Fed’s valuation
model:
2) FVP = E/TBY
1
2
“We have not been able, as yet, to provide a satisfying answer to this question, but there are reasons in the
current environment to keep this question on the table.”
3
Prudential Securities Asset Valuation & Allocation Models / July 30, 2002 / Page 3
The ratio of the actual S&P 500 price index to the fair value price shows the degree of
overvaluation or undervaluation. History shows that markets can stay overvalued and
become even more overvalued for a while. But eventually, overvaluation is corrected in
three ways: 1) falling interest rates, 2) higher earnings expectations, and of course, 3)
falling stock prices—the old fashioned way to decrease values. Undervaluation can be
corrected by rising yields, lower earnings expectations, or higher stock prices.
The Fed’s Stock Valuation Model worked quite well in the past. It identified when stock
prices were excessively overvalued or undervalued, and likely to fall or rise:
1) The market was extremely undervalued from 1979 through 1982, setting the stage
for a powerful rally that lasted through the summer of 1987.
2) Stock prices crashed after the market rose to a record 34% overvaluation peak during
September 1987.
3) Then the market was undervalued in the late 1980s, and stock prices rose.
4) In the early 1990s, it was moderately overvalued and stock values advanced at a
lackluster pace.
5) Stock prices were mostly undervalued during the mid-1990s, and a great bull market
started in late 1994.
6) Ironically, the market was actually fairly valued during December 1996 when the
Fed Chairman worried out loud about irrational exuberance.
E
xcerpt from Fed’s July 1997 Monetary Policy Report:
The run-up in stock prices in the spring was bolstered by unexpectedly strong
corporate profits for the first quarter. Still, the ratio of prices in the S&P 500 to
consensus estimates of earnings over the coming twelve months has risen
further from levels that were already unusually high. Changes in this ratio have
often been inversely related to changes in long-term Treasury yields, but this
year’s stock price gains were not matched by a significant net decline in interest
rates. As a result, the yield on ten-year Treasury notes now exceeds the ratio of
twelve-month-ahead earnings to prices by the largest amount since 1991, when
earnings were depressed by the economic slowdown. One important factor
behind the increase in stock prices this year appears to be a further rise in
analysts’ reported expectations of earnings growth over the next three to five
years. The average of these expectations has risen fairly steadily since early
1995 and currently stands at a level not seen since the steep recession of the
early 1980s, when earnings were expected to bounce back from levels that were
quite low.
Page 4 / July 30, 2002 / Prudential Securities Asset Valuation & Allocation Models
7) During both the summers of 1997 and 1998, overvaluation conditions were corrected
by a sharp drop in prices.
8) Then a two- month undervaluation condition during September and October 1998
was quickly reversed as stock prices soared to a remarkable record 70%
overvaluation reading during January 2000. This bubble was led by the Nasdaq and
technology stocks, which crashed over the rest of the year, bringing the market closer
to fair value
II. New Improved Model
The FSVM is missing a variable reflecting that the forward earnings yield is riskier than
the government bond yield. How should we measure risk in the model? An obvious
choice is to use the spread between corporate bond yields and Treasury bond yields. This
spread measures the market’s assessment of the risk that some corporations might be
forced to default on their bonds. Of course, such events are very unusual, especially for
companies included in the S&P 500. However, the spread is only likely to widen during
periods of economic distress, when bond investors tend to worry that profits won’t be
sufficient to meet the debt-servicing obligations of some companies. Most companies
won’t have this problem, but their earnings would most likely be depressed during such
periods. The FSVM is also missing a variable for long-term earnings growth. My New
Improved Model includes these variables as follows:
3) FEY = CBY – b · · LTEG
where CBY is Moody’s A-rated corporate bond yield. LTEG is long-term expected
earnings growth, which is measured using consensus five- year earnings growth
projections. I/B/E/S International compiles these monthly. The “b” coefficient is the
weight that the market gives to long-term earnings projections. It can be derived as -
[FEY-CBY]/LTEG. Since the start of the data in 1985, this “earnings growth coefficient”
averaged 0.1.
Equation 3 can be rearranged to produce the following:
4) FVP = E ¸ ¸ [CBY – b · · LTEG]
FVP is the fair value price of the S&P 500 index. Exhibit 10 shows three fair value price
series using the actual data for E, CBY, and LTEG with b = 0.1, b = 0.2, and b = 0.25.
The market was fairly valued during 1999 and the first half of 2000 based on the
consensus forecast that earnings could grow more than 16% per year over the next five
years and that this variable should be weighted by 0.25, or two and a half times more than
the average historical weight.
III. Back To Basics
With the benefit of hindsight, it seems that these assumptions were too optimistic. But,
Prudential Securities Asset Valuation & Allocation Models / July 30, 2002 / Page 5
this is exactly the added value of the New Improved FSVM. It can be used to make
explicit the implicit assumptions in the stock market about the weight given to long-term
earnings growth. The simple version has worked so well historically because the long-
term growth component has been offset on average by the risk variable in the corporate
bond market.
IV. Stocks Versus Bonds
The FSVM is a very simple stock valuation model. It should be used along with other
stock valuation tools, including the New Improved version of the model. Of course, there
are numerous other more sophisticated and complex models. The Fed model is not a
market-timing tool. As noted above, an overvalued (undervalued) market can become
even more overvalued (undervalued). However, the Fed model does have a good track
record of showing whether stocks are cheap or expensive. Investors are likely to earn
below (above) average returns over the next 12-24 months when the market is overvalued
(undervalued).
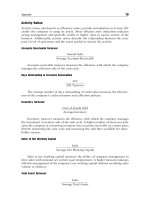
The next logical step is to convert the FSVM into a simple asset allocation model
(Exhibit 1). I’ve done so by subjectively associating the “right” stock/bond asset mixes
with the degree of over/under valuation as shown in the table below. For example,
whenever stocks are 10% to 20% overvalued, I would recommend that a moderately
aggressive investor should have a mix of 60% in stocks and 40% in bonds in their
portfolio.
Bonds/Stocks Asset Allocation Model
More than 30% overvalued 70% bonds, 30% stocks
20% to 30% overvalued 50% bonds, 50% stocks
10% to 20% overvalued 40% bonds, 60% stocks
10% undervalued to 10% overvalued 30% bonds, 70% stocks
10% to 15% undervalued 20% bonds, 80% stocks
More than 15% undervalued 10% bonds, 90% stocks
79 80 81 82 83 84 85 86 87 88 89 90 91 92 93 94 95 96 97 98 99 00 01 02 03 04 05 06 07 08
-40
-30
-20
-10
0
10
20
30
40
50
60
70
80
-40
-30
-20
-10
0
10
20
30
40
50
60
70
80
7/26
ED YARDENI’S ASSET ALLOCATION MODEL: BONDS/STOCKS*
(for Moderately Aggressive Investor)
Stocks overvalued when greater than zero
Stocks undervalued when less than zero
70/30
50/50
40/60
30/70
30/70
20/80
10/90
* Ratio of S&P 500 index to its fair value (12-month forward consensus expected operating earnings per share
divided by the ten-year U.S. Treasury bond yield) minus 100. Monthly through March 1994, weekly after.
Source: Thomson Financial.
Yardeni
- Asset Allocation -
Page 6 / July 30, 2002 / Prudential Securities Asset Valuation & Allocation Models
79 80 81 82 83 84 85 86 87 88 89 90 91 92 93 94 95 96 97 98 99 00 01 02 03 04
75
225
375
525
675
825
975
1125
1275
1425
1575
1725
75
225
375
525
675
825
975
1125
1275
1425
1575
1725
7/26
FED’S STOCK VALUATION MODEL (FSVM-1)
(ratio scale)
Fair-Value Price*
S&P 500 Price Index
* 52-week forward consensus expected S&P 500 operating earnings per share divided by 10-year US Treasury
bond yield. Monthly through March 1994, weekly after.
Source: Thomson Financial.
Yardeni
Figure 2.
According to the Fed
model, when stock
prices are overpriced,
returns from stocks
are likely to be subpar
over the next 12-24
months.
Better-than-average
returns tend to come
from underpriced
markets.
79 80 81 82 83 84 85 86 87 88 89 90 91 92 93 94 95 96 97 98 99 00 01 02 03 04
-40
-30
-20
-10
0
10
20
30
40
50
60
70
-40
-30
-20
-10
0
10
20
30
40
50
60
70
7/26
FED’S STOCK VALUATION MODEL (FSVM-1)*
(percent)
Overvalued
Undervalued
* Ratio of S&P 500 Index to its Fair-Value (52-week forward consensus expected S&P 500 operating earnings
per share divided by the 10-year US Treasury bond yield) minus 100. Monthly through April 1994, weekly
thereafter.
Source: Thomson Financial.
Yardeni
Figure 3.Figure 3.
- Valuation Model -
Prudential Securities Asset Valuation & Allocation Models / July 30, 2002 / Page 7
79 80 81 82 83 84 85 86 87 88 89 90 91 92 93 94 95 96 97 98 99 00 01 02 03 04
2
3
4
5
6
7
8
9
10
11
12
13
14
15
16
17
18
2
3
4
5
6
7
8
9
10
11
12
13
14
15
16
17
18
7/26
S&P 500 EARNINGS YIELD & BOND YIELD
10-Year US Treasury
Bond Yield
Forward Earnings Yield*
* 52-week forward consensus expected S&P 500 operating earnings per share divided by S&P 500 Index.
Monthly through March 1994, weekly after.
Source: Thomson Financial.
Yardeni
Figure 4.
This chart appeared in
the Fed’s July 1997
Monetary Policy
Report to the
Congress. It shows a
very close correlation
between the earnings
yield of the stock
market and the bond
yield. Another, more
familiar way to look at
it follows.
79 80 81 82 83 84 85 86 87 88 89 90 91 92 93 94 95 96 97 98 99 00 01 02 03 04 05 06 07 08
5
6
7
8
9
10
11
12
13
14
15
16
17
18
19
20
21
22
23
24
25
26
5
6
7
8
9
10
11
12
13
14
15
16
17
18
19
20
21
22
23
24
25
26
Actual Fair
Jun 14 18.1 20.1
Jun 21 18.1 20.7
Jun 28 17.5 20.7
Jul 5 17.1 20.7
Jul 12 16.6 21.2
Jul 19 15.8 21.4
Jul 26 14.9 22.4
7/26
FORWARD P/E & BOND YIELD
Fair-Value P/E=Reciprocal Of
Ten-Year U.S. Treasury Bond Yield
Ratio Of S&P 500 Price To Expected Earnings*
* 52-week forward consensus expected S&P 500 operating earnings per share. Monthly through March 1994,
weekly after.
Source: Thomson Financial.
Yardeni
Figure 5.
The S&P 500 P/E
(using expected
earnings) is highly
correlated with
reciprocal of the bond
yield.
- Valuation Model -
Page 8 / July 30, 2002 / Prudential Securities Asset Valuation & Allocation Models
I II III IV I II III IV I II III IV
2000 2001 2002
40
45
50
55
60
65
70
75
40
45
50
55
60
65
70
75
7/26
S&P 500 EARNINGS PER SHARE CONSENSUS FORECASTS
(analysts’ average forecasts)
For 2003
For 2002
For 2001
Forward
Earnings*
* 52-week forward consensus expected S&P 500 operating earnings per share. Time-weighted average of
current year and next year’s consensus forecasts.
Source: Thomson Financial.
Yardeni
Figure 6.
Expected forward
earnings is a
time-weighted
average of current and
the coming years’
consensus forecasts.
1985 1986 1987 1988 1989 1990 1991 1992 1993 1994 1995 1996 1997 1998 1999 2000 2001 2002 2003 2004
10
15
20
25
30
35
40
45
50
55
60
65
10
15
20
25
30
35
40
45
50
55
60
65
Q1
7/25
S&P 500 EARNINGS PER SHARE: ACTUAL & EXPECTED
S&P 500 Earnings Per Share
________________________
Operating Earnings
(4-quarter sum)
Forward Earnings*
(pushed 52-weeks ahead)
* 52-week forward consensus expected S&P 500 operating earnings per share. Monthly through March 1994,
weekly after.
Source: Thomson Financial.
Yardeni
Figure 7.
Bottom-up 52-week
forward expected
earnings tends to be a
good predicator of
actual earnings, with a
few significant misses.
- Earnings -
Prudential Securities Asset Valuation & Allocation Models / July 30, 2002 / Page 9
1990 1991 1992 1993 1994 1995 1996 1997 1998 1999 2000 2001 2002 2003
20
25
30
35
40
45
50
55
60
65
70
75
20
25
30
35
40
45
50
55
60
65
70
75
Jul
S&P 500 CONSENSUS OPERATING EARNINGS PER SHARE
(analysts’ bottom-up forecasts)
Consensus Forecasts
__________________
Annual estimates
12-month forward
Actual 4Q sum
91
92
93
94
95
96
97
98
99
00
01
02
03
Source: Thomson Financial.
Yardeni
Figure 8.
Analysts always start
out too optimistic
about the prospects
for earnings.
1978 1979 1980 1981 1982 1983 1984 1985 1986 1987 1988 1989 1990 1991
10
15
20
25
30
35
10
15
20
25
30
35
S&P 500 CONSENSUS OPERATING EARNINGS PER SHARE
(analysts’ bottom-up forecasts, ratio scale)
Consensus Forecasts
_________________
Annual estimates
12-month forward
Actual 4Q sum
80
81
82 83
84
85
86
87
88
89
90
Source: Thomson Financial.
Yardeni
Figure 9.Figure 9.
- Earnings -
Page 10 / July 30, 2002 / Prudential Securities Asset Valuation & Allocation Models
I II III IV I II III IV I II III IV
2000 2001 2002
-20
-15
-10
-5
0
5
10
15
20
25
-20
-15
-10
-5
0
5
10
15
20
25
7/26
7/26
S&P 500 EARNINGS PER SHARE
Consensus Growth
Forecasts*
_______________
2001/2000
2002/2001
2003/2002
* Based on consensus expected S&P 500 operating earnings per share for years shown.
Source: Thomson Financial.
Yardeni
Figure 10.
The data on
consensus expected
earnings can be used
to derive consensus
earnings growth
forecasts.
1989 1990 1991 1992 1993 1994 1995 1996 1997 1998 1999 2000 2001 2002 2003 2004
-30
-25
-20
-15
-10
-5
0
5
10
15
20
25
30
35
40
45
-30
-25
-20
-15
-10
-5
0
5
10
15
20
25
30
35
40
45
Q4
S&P 500 OPERATING EARNINGS PER SHARE*
(yearly percent change)
Consensus Forecast
(Proforma)*
Actual
* S&P 500 composition is constantly changing. Actual data are not adjusted for these changes. Proforma
forecasts are same-company comparisions. Source: Thomson Financial.
Yardeni
Figure 11.
Earnings growth is
highly cyclical.
- Earnings -
Prudential Securities Asset Valuation & Allocation Models / July 30, 2002 / Page 11