Prognostic prediction of glioblastoma by quantitative assessment of the methylation status of the entire MGMT promoter region
Bạn đang xem bản rút gọn của tài liệu. Xem và tải ngay bản đầy đủ của tài liệu tại đây (1.27 MB, 11 trang )
Kanemoto et al. BMC Cancer 2014, 14:641
/>
RESEARCH ARTICLE
Open Access
Prognostic prediction of glioblastoma by
quantitative assessment of the methylation status
of the entire MGMT promoter region
Manabu Kanemoto1,2, Mitsuaki Shirahata3, Akiyo Nakauma1, Katsumi Nakanishi1, Kazuya Taniguchi1, Yoji Kukita1,
Yoshiki Arakawa2, Susumu Miyamoto2 and Kikuya Kato1*
Abstract
Background: O6-methylguanine-DNA methyltransferase (MGMT) promoter methylation is reported to be a prognostic
and predictive factor of alkylating chemotherapy for glioblastoma patients. Methylation specific PCR (MSP) has been
most commonly used when the methylation status of MGMT is assessed. However, technical obstacles have hampered
the implementation of MSP-based diagnostic tests. We quantitatively analyzed the methylation status of the entire
MGMT promoter region and applied this information for prognostic prediction using sequencing technology.
Methods: Between 1998 and 2012, the genomic DNA of 85 tumor samples from newly diagnosed glioblastoma
patients was subjected to bisulfite treatment and subdivided into a training set, consisting of fifty-three samples, and a
test set, consisting of thirty-two samples. The training set was analyzed by deep Sanger sequencing with a sequencing
coverage of up to 96 clones per sample. This analysis quantitatively revealed the degree of methylation of each cytidine
phosphate guanosine (CpG) site. Based on these data, we constructed a prognostic prediction system for glioblastoma
patients using a supervised learning method. We then validated this prediction system by deep sequencing with a
next-generation sequencer using a test set of 32 samples.
Results: The methylation status of the MGMT promoter was correlated with progression-free survival (PFS) in our
patient population in the training set. The degree of correlation differed among the CpG sites. Using the data from the
top twenty CpG sites, we constructed a prediction system for overall survival (OS) and PFS. The system successfully
classified patients into good and poor prognosis groups in both the training set (OS, p = 0.0381; PFS, p = 0.00122) and
the test set (OS, p = 0.0476; PFS, p = 0.0376). Conventional MSP could not predict the prognosis in either of our sets.
(training set: OS; p = 0.993 PFS; p = 0.113, test set: OS; p = 0.326 PFS; p = 0.342).
Conclusions: The prognostic ability of our prediction system using sequencing data was better than that of
methylation-specific PCR (MSP). Advances in sequencing technologies will make this approach a plausible option for
diagnoses based on MGMT promotor methylation.
Keywords: Glioma, O6-methylguanine-DNA methyltransferase, Methylation, Bisulfite genome sequencing,
Next-generation sequencing
* Correspondence:
1
Research Institute, Osaka Medical Center for Cancer and Cardiovascular
Diseases, 1-3-3 Nakamichi, Higashinari-ku, Osaka, Japan
Full list of author information is available at the end of the article
© 2014 Kanemoto et al.; licensee BioMed Central Ltd. This is an Open Access article distributed under the terms of the
Creative Commons Attribution License ( which permits unrestricted use,
distribution, and reproduction in any medium, provided the original work is properly credited. The Creative Commons Public
Domain Dedication waiver ( applies to the data made available in this
article, unless otherwise stated.
Kanemoto et al. BMC Cancer 2014, 14:641
/>
Background
A glioblastoma (GB) is a malignant brain tumor with a
poor prognosis; the median survival time of GB patients
is less than 2 years [1]. The current standard of care for
GB patients is maximum surgical resection combined
with radiation and concomitant adjuvant temozolomide
(TMZ) therapy [2]. The long-term results of the EORTCNCIC CE.3 trial revealed that the 5-year survival of GB
patients approaches 10%, despite the largely poor prognosis [3]. Although novel drugs, such as molecular-targeted
drugs, have been developed, their survival benefit has not
been confirmed, and these molecular targeted drugs are
known to carry risks of specific adverse events [4-6]. Accordingly, it is important to identify patients who may respond to conventional chemo-radiation therapy as part of
future personalized care. Although nitrosoureas were
commonly used for chemotherapy, TMZ is now used for
first-line therapy. These drugs are alkylating agents that
add an alkyl group to the O6 position of guanine,
damaging the genomic DNA of cancer cells. O6methylguanine-DNA methyltransferase (MGMT) removes
alkyl groups from the O6 position of guanine and plays an
important role in DNA repair [7-10]. Therefore, MGMT
expression is associated with resistance to chemotherapeutic alkylating agents. The expression of MGMT is
controlled by epigenetic gene silencing [11-13]. The
methylation of the MGMT promoter is associated with
sensitivity to alkylating chemotherapy drugs and is recognized as a prognostic factor for GB patients [14-18].
In recent years, TMZ monotherapy has been attempted for elderly GB or low-grade glioma patients,
and an association between the treatment response and
the MGMT methylation status has been examined
[19,20]. These studies demonstrated that the methylation
status of MGMT is a strong predictive factor of TMZ
monotherapy outcomes in elderly GB patients, and the
clinical utility of the MGMT methylation status is increasing [21,22].
Even with this accumulating clinical evidence, the implementation of diagnostic tests examining the methylation status of the MGMT promoter has been difficult.
PCR-based techniques, such as methylation-specific PCR
(MSP) and quantitative MSP, are the most popular
methods of assessment [23,24]. These techniques detect
methylation sequences by sequence-specific binding of
primers, which is an indirect method and only detects a
limited number of methylation sites. DNA sequencing
(i.e., bisulfite genomic sequencing) provides more direct
information on methylation status. In this context, pyrosequencing is considered a good alternative. However,
the target methylation sites of pyrosequencing are also
limited [25,26]. The MGMT promoter region spans
more than one thousand base pairs and contains approximately one hundred potential methylation sites. To
Page 2 of 11
assess the methylation status of the MGMT promoter, it
would be preferable to assess information from all
methylation sites and select important CpG sites with
survival analysis.
In this report, we performed deep sequencing of the
MGMT promoter region after bisulfite treatment to clarify the global methylation status of the region. Because
the methylation status is not uniform in glioma tissue, it
is important to characterize the intratumor heterogeneity of MGMT promoter methylation. An analysis of survival data assessed the correlation between each CpG
site and the malignancy of the glioblastoma. Based on
this correlation, we built a classifier to predict the malignancy of GB using deep sequencing with a nextgeneration sequencer.
Methods
Patient characteristics
We obtained 85 GB specimens from patients who underwent surgical resection at Kyoto University Hospital and
related regional hospitals between 1998 and 2012. The
majority of the patients were recruited for a phase II clinical trial [27], and their tissues were used for studies on
gene expression profiling [28,29]. Histological diagnoses
were established by the Kyoto University Pathology Unit
according to the criteria established by the World Health
Organization. The protocol was approved by the institutional review board of Kyoto University, and written informed consent was obtained from each of the patients.
All tumor specimens were immediately snap frozen upon
surgical resection and stored at −80°C until use. Tumor
specimens containing 20% or more non-tumor tissue or
necrotic areas were excluded from further analysis. The
preoperative Karnofsky performance status score of each
patient was at least 50 for each case. All patients received
radiation therapy with and without alkylating chemotherapy postoperatively. The patient characteristics are shown
in Table 1. We divided the data matrix into two data sets:
one set consisted of 53 patients and was designated as the
training set, and the other set contained 32 patients and
was designated as the test set.
DNA extraction and bisulfite treatment
Genomic DNA was extracted with the QIAamp DNA
Mini Kit (Qiagen) according to the manufacturer’s instructions. One nanogram of genomic DNA was subjected to bisulfite treatment using the MethylEasy DNA
Bisulfite Modification Kit (Takara) in accordance with
the manufacturer’s instructions. We determined the
quality of bisulfite-treated genomic DNA by real-time
PCR of the actin gene as previously described [30]. The
outline of the procedure is schematically shown in
Additional file 1: Figure S1.
Kanemoto et al. BMC Cancer 2014, 14:641
/>
Page 3 of 11
Table 1 Patients’ clinical characteristics
Sample
85
Age
6-88
Gender
Removal
Post operative therapy
Female
36
Male
49
Biopsy
1
Partial
29
Subtotal
28
Total
20
Unknown
8
VAC-feron
57
Temozolomide
14
Other ACNU regimen
4
Radiation alone
7
Other
3
Median: 60
Overall survival (months)
3-96
Median: 12
Progression free survival (months)
1-96
Median: 6
Methylation-specific PCR (MSP)
Conventional MSP was performed as previously described [31]. PCR was performed using AmpliTaq Gold
polymerase and the GeneAmp PCR system 9700 (Applied Biosystems). The sequences of the primer pairs
were 5′-TTTGTGTTTTGATGTTTGTAGGTTTTTGT3′ and 5′-AACTCCACACTCTTCCAAAAACAAAACA3′ for unmethylated MGMT (fragment size: 93 bp) and
5′- TTTCGACGTTCGTAGGTTTTCGC -3′ and 5′-GCA
CTCTTCCGAAAACGAAACG-3′ for methylated MGMT
(fragment size: 81 bp). These sequences and the PCR primer sequences used in the further analysis were constructed according to the MGMT promoter sequence
( After an
initial incubation at 95°C for 12 min, PCR amplification
was performed with 40 cycles of 95°C for 15 sec, 59°C for
30 sec, and 72°C for 30 sec, followed by a 4-min final extension. The PCR products were electrophoresed on 2%
agarose gels and were classified as methylated if a band
with the PCR product was visualized using the methylated
primer. The experiments were performed twice to confirm
the reproducibility of the results. There were no discrepancies between duplicate reactions.
Quantitative bisulfite genome sequencing (qBGS) of the
training set
For qBGS, the MGMT promoter region was amplified
by nested PCR. The sequences of the first-round PCR
primers were 5′-TGGTAAATTAAGGTATAGAGTTTT
AGG-3′ and 5′-GGTTAGGTGTTAGTGATGTT-3′. The
PCR protocol was optimized for bisulfite-treated genomic
DNA; each 10-μl reaction mixture of the modified protocol contained 2.5 mM MgCl2, 3% DMSO, 20 ng bisulfite-
treated genomic DNA, and 1 μl of AmpliTaq Gold. After
an initial incubation at 95°C for 12 min, PCR amplification
was performed using 30 cycles of 95°C for 15 sec, 54°C for
30 sec and 72°C for 1 min, followed by a 4-min final extension. A 1-μl aliquot of the first-round PCR product was
used as the template of the second-round PCR reaction.
The sequences of the second-round PCR primers were 5′TGGTAAATTAAGGTATAGAGTTTTAGG-3′ and 5′-TT
GGATTAGGTTTTTGGGGTT-3′ (fragment size: 662 bp).
The genomic position is chr 10: 131,155,100-131,155,761.
The second-round PCR was performed using KOD-plus
DNA polymerase (TOYOBO) according to the manufacturer’s instructions with 1.5 mM MgSO4 and 3% DMSO.
After an initial incubation at 95°C for 2 min, PCR amplification was performed with 30 cycles of 94°C for 15 sec,
58°C for 30 sec, and 68°C for 1 min. The PCR products
were purified using the MinElute PCR Purification Kit
(QIAGEN) and ligated into the pCR-Blunt plasmid using
the Zero Blunt PCR Cloning Kit (Invitrogen) and a DNA
ligation kit (Takara). MAX Efficiency DH5 Competent
Cells (Invitrogen) were used for transformations. A total
of 96 colonies of each sample were subjected to bisulfite
sequencing using a 3730xl DNA Analyzer (Applied Biosystems). The methylation status was analyzed with
QUMA web tools ( />qBGS for the test set
For the test set, we used next-generation sequencing
(MiSeq, Illumina) instead of Sanger sequencing. The target sequence was amplified by nested PCR. PCR amplification was performed using 40 cycles of 94°C for 30 sec,
54°C for 30 sec, and 72°C for 45 min, followed by a
4-min final extension. The sequences of the first-round
PCR primers were 5′-GGATATGTTGGGATAGTT-3′
and 5′-CCAAAAACCCCAAACCC-3′ [26]. The sequences of the second-round PCR primers were 5′GGATATGTTGGGATAGTT-3′ and 5′- AAATAAATAA
AAATCAAAAC-3′ (fragment size: 216 bp). The annealing temperature was 48°C in the second-round PCR. The
PCR product was attached with an adapter for MiSeq
plus, consisting of an eight- or six-base index. The pooled
PCR library of the test set samples was sequenced by
paired-end sequencing with a MiSeq sequencer. Pairedend reads were aligned to a C-to-T converted reference sequence of the MGMT promoter region using BWA [32].
We used SAMtools to obtain the per-base coverage (pileup
files) and counted non-bisulfite converted sites [33].
Statistical analysis
Statistical analyses were performed using the free statistics software R ( Overall survival (OS) and progression-free survival (PFS) were
defined as the period from surgery to death and from
surgery to radiological detection of tumor progression,
Kanemoto et al. BMC Cancer 2014, 14:641
/>
Page 4 of 11
respectively. Tumor progression was diagnosed based on
the criteria of the Brain Tumor Registry committee
(Japan), which includes: a 25% increase in tumor size,
the appearance of new lesions, or the obvious deterioration of the patient due to a mass effect or perifocal
edema (in Table 1).
Results
Quantitative bisulfite genome sequencing of the training
set
Bisulfite sequencing was performed to fully analyze the
methylation status of the MGMT promoter region. Due
to intratumor heterogeneity, the methylation status of
individual cells is not identical, even within a single glioma tissue. To clarify this heterogeneity, we performed
quantitative bisulfite sequencing and obtained data from
25 to 81 molecules (median, 51) from each sample. This
approach is referred to as quantitative bisulfite genome
sequencing (qBGS). The 662-bp fragment subjected to
qBGS contained 78 CpG sites. One CpG site that is not
located within the CpG island of the MGMT promoter
region was excluded from further analysis. The methylation proportion at each CpG site was calculated as the
fraction of clones with a methylated C at that site in all
sequenced clones. The methylation status of the MGMT
promoter region was then described as a data point in a
77-dimensional space constructed from the methylation
proportions of the 77 CpG sites. We performed a hierarchical cluster analysis with the Ward method using
the raw methylation proportion without any standardization to obtain a general view of the global methylation
features of the MGMT promoter region. The cases were
grouped into four clusters (Figure 1A). These clusters
were correlated with the degree of methylation. The column bars below the clustering indicate the MSP results
for 53 samples. Typical examples of qBGS results are
shown in Figure 2. The samples in cluster 1 were
strongly methylated, the samples in cluster 2 were moderately methylated, the samples in cluster 3 were slightly
methylated, and the samples in cluster 4 were almost
A
cluster 1
cluster 3
cluster 4
cluster 2
MSP
B
C
Cluster 2
n=9
cluster
1 vs 2
1 vs 3
1 vs 4
2 vs 3
2 vs 4
3 vs 4
p-value
0.892
0.686
0.0533
0.789
0.193
0.152
Cluster 1
n=10
Cluster 3
n=14
Cluster 4 n=20
Cluster 2
n=9
cluster
1 vs 2
1 vs 3
1 vs 4
2 vs 3
2 vs 4
3 vs 4
Cluster 3 n=14
p-value
0.631
0.276
0.00491
0.276
0.0204
0.0961
Cluster 1
n=10
Cluster 4 n=20
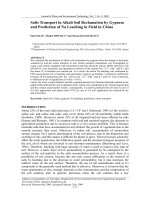
Figure 1 Clustering of the training set and survival analysis. Unsupervised analysis based on the MGMT methylation patterns. (A) A
hierarchical cluster analysis of the methylation of the MGMT promoter in 53 samples. Cluster 1 (Black), strongly methylated samples; cluster 2
(red), moderately methylated; cluster 3 (green), slightly methylated; cluster 4 (blue), mostly unmethylated. The columns below the clustering show
the results obtained using MSP. The gray column indicates methylated, and the white column is unmethylated samples. (B, C) Survival analysis
was performed between all combinations of the four cluster subgroups. For PFS, the analysis showed statistically significant differences between
cluster 1 and cluster 4 (p = 0.00491) and between cluster 2 and cluster 4 (p = 0.0204). For OS, there was no statistically significant difference
between any combination of the four clusters, but there was a trend toward a difference between cluster 1 and cluster 4 (p = 0.0533).
Kanemoto et al. BMC Cancer 2014, 14:641
/>
Page 5 of 11
A
Sample 29 (68 clones) (cluster 1)
B
Sample 46 (61 clones) (cluster 2)
C
Sample 10 (77 clones) (cluster 3)
D
Sample31 (57 clones) (cluster 4)
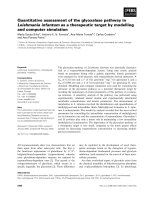
Figure 2 Methylation pattern obtained by qBGS. Methylation pattern observed using qBGS. The black and white circles indicate methylated
and unmethylated CpG sites, respectively. Horizontally, 77 CpG sites are aligned. Vertically, the sequencing results of individual clones are aligned.
(A) Sample 29 from cluster 1 of Figure 1; (B) sample 46 from cluster 2; (C) sample 10 from cluster 3; and (D) sample 31 from cluster 4.
unmethylated. There was a trend toward a prognostic
difference for OS between cluster 1 and cluster 4 (p =
0.0533) (Figure 1B). Statistically significant associations
with PFS were observed between clusters 1 and 4 (p =
0.00491) and between clusters 2 and 4 (p = 0.0204)
(Figure 1C). Several cases that were judged to be methylated (i.e., to have a good prognosis) by MSP belonged to
clusters 3 and 4 (Figure 1A). For example, samples 13
and 16 belonged to cluster 4; both showed four months
of PFS and were described as poor prognosis [2], but
were judged to be methylated and to have a good prognosis by MSP.
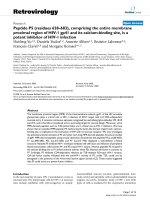
To demonstrate an overview of the methylation status
of the MGMT promoter region, the averages of the
methylation proportions of the CpG sites are shown in
Figure 3. The promoter sequence may be divided into
three segments according to the methylation proportions. The methylation level of the CpG sites in the middle segment, from CpG28 to CpG50, was lower than
that of the other segments (Figure 3). This area is located just upstream of the transcription start site. We
performed univariate Cox proportional hazard analysis
of PFS to identify prognostically important CpG sites
using the methylation proportion as a continuous variable. Based on an analysis using the 53 training samples,
the log-rank p values of 20 CpG sites were less than
0.05. These 20 selected CpG sites were CpG63 (p = 0.0056),
CpG64 (p = 0.0088), CpG77 (p = 0.010), CpG62 (p = 0.012),
CpG56 (p = 0.012), CpG68 (p = 0.014), CpG11 (p = 0.023),
CpG65 (p = 0.025), CpG66 (p = 0.025), CpG59 (p = 0.027),
CpG8 (p = 0.028), CpG60 (p = 0.028), CpG10 (p = 0.030),
CpG7 (p = 0.034),CpG5 (p = 0.034), CpG61 (p = 0.035),
CpG54 (p = 0.038), CpG9 (p = 0.038), CpG47 (p = 0.047),
and CpG67 (p = 0.048). Almost all of the selected sites
were located at positions from CpG5 to CpG11 or from
CpG54 to CpG68 (black columns in Figure 3). However,
only five CpG sites were selected for OS under the same
condition: CpG8 (p = 0.039), CpG28 (p = 0.041), CpG56
(p = 0.041), CpG5 (p = 0.044), and CpG45 (p = 0.049)
(gray columns in Figure 3). Three CpG sites, CpG5,
CpG8, and CpG56, showed a correlation with OS and
PFS. All of the results of univariate Cox analysis are supplied in Additional file 2 (PFS) and Additional file 3 (OS).
Shah et al. reported a similar comprehensive methylation
analysis [34]. Their numbering scheme of CpG sites corresponds to the addition of twenty to our numbering
scheme of sites.
Diagnostic system for prognosis prediction using
quantitative methylation data
As described above, the prognostic significance of each
CpG site is limited, and it would be more effective to
combine the information from multiple CpG sites. One
approach is an unsupervised analysis, including a cluster
analysis, shown above. However, to construct a diagnostic system, supervised learning is more appropriate.
Kanemoto et al. BMC Cancer 2014, 14:641
/>
Page 6 of 11
Miseq sequencing
MSP
chr10:131,155,100
Exon1
CpG site 1
chr10:131,155,761.
77
CpG site number
Figure 3 Proportion of methylation status and survival analysis at each CpG site. Average of the methylation percentage of CpG sites. The
black and gray columns in the top panel indicate CpG sites with correlations with PFS and OS, respectively, that exceed the threshold (p < 0.05).
Here, based on the correlation between OS or PFS and
the methylation status of the MGMT promoter region,
we constructed a diagnostic system to predict the therapeutic outcomes of GB patients based on the methylation proportion of CpG51 - CpG74. Because we
intended to use a next-generation sequencer for the validation study, we selected the CpG sites to be examined
based on the read length restriction of the sequencer.
This diagnostic score was denoted as the M-score
(methylation score) and is defined as a weighted sum of
the methylation proportion as follows:
M ðmethylationÞ score ¼ −
X
Ai X i
i
where ‘Ai’ is a regression coefficient deduced by univariate Cox analysis of PFS at CpG site i and ‘Xi’ is the
methylation proportion at CpG site i. As described
above, a correlation between OS and the methylation
status was not clear in our patient population. We therefore used the same M-score calculation formula for OS
as well. First, the performance of the M-score diagnostic
system was evaluated by leave-one-out-cross-validation
(LOOCV) using the 53 training samples. The 53 samples
were divided into groups consisting of one and 52 samples, and ‘Ai’ was calculated by univariate Cox analysis
using the data for the remaining 52 samples. The
threshold was selected from M-scores of the 52 samples
so that the log-rank p value of the Kaplan-Meier analysis
for the two divided groups was minimized. In cases of
multiple M-scores with the same minimum p value, the
median was selected as the threshold. Next, the M-score
of the one sample was calculated using parameters deduced from the 52 samples, and the sample was classified into either the good or poor prognosis group using
the threshold. This process was repeated until all samples were tested. The LOOCV procedure is schematically shown in Additional file 1: Figure S2. The results of
the LOOCV procedure are shown in Figure 4A and B;
this approach demonstrated excellent prognostic ability
with OS and PFS (OS, p = 0.0381; PFS, p = 0.00122).
Thus, the diagnostic accuracy of our system is better
than that of the MSP-based approach (Figure 4C, D)
(OS, p = 0.993; PFS, p = 0.113).
Validation of the diagnostic system using next-generation
sequencing
For validation of the test set, the parameters (Ai) were
calculated using all 53 samples in the training set, and
the threshold was set at 2.2, the average of the thresholds of the 53 LOOCV processes.
For the 32 test set samples, we performed qBGS with
a next-generation sequencer, MiSeq, to examine the potential future applications of this approach. We also
Kanemoto et al. BMC Cancer 2014, 14:641
/>
Page 7 of 11
Training set
A
p= 0.0381
B
Good prognosis
n=15
p= 0.00122
Good prognosis
n=15
Poor prognosis
n=38
Poor prognosis
n=38
D
C
p= 0.993
p= 0.113
Methylated
n=36
Methylated
n=36
Unmethylated
n=17
E
p= 0.0476
Unmethylated
n=17
Test set
F
Good prognosis
n=12
Good prognosis
n=12
Poor prognosis
n=20
Poor prognosis
n=20
G
p= 0.326
Methylated
n=19
Unmethylated
n=12
Figure 4 (See legend on next page.)
p= 0.0376
H
p= 0.342
Methylated
n=19
Unmethylated
n=12
Kanemoto et al. BMC Cancer 2014, 14:641
/>
Page 8 of 11
(See figure on previous page.)
Figure 4 Survival analysis of the training set by M-score and MSP. In each panel, the red line indicates either a good prognosis (M-score) or
the methylated (MSP) group. The black line indicates either a poor prognosis (M-score) or the unmethylated (MSP) group. (A) training set,
M-score, OS. (B) training set, M-score, PFS. (C) training set, MSP, OS. (D) training set, MSP, PFS. (E) test set, M-score, OS. (F) test set, M-score, PFS.
(G) test set, MSP, OS. (H) test set, MSP, PFS.
performed MSP in all cases except one, due to the loss
of genomic DNA. The mean depth of MiSeq sequencing
was 80,817 reads. The methylation proportion of each
CpG site was obtained, M-scores were calculated, and
the test set samples were classified using the threshold
listed above. Survival analysis indicated a statistically significant difference between the two groups with respect
to PFS (p = 0.0376) and OS (p = 0.0476) (Figure 4E, F).
There was no statistically significant difference between
the two groups by classification with MSP (OS, p = 0.326;
PFS, p = 0.342) (Figure 4G, H).
For potential future applications of this technique, we
designed PCR primers that amplify the same region from
FFPE samples. The method and results are shown in
Additional file 4.
Multivariate Cox regression analysis
We performed Cox regression analysis to evaluate clinical parameters, such as age (above or below 60), gender,
the extent of resection, post-operative chemotherapy
(VAC-feron or TMZ), and the methylation status by the
M-score sequencing method as predictors of OS and
PFS in the GB patients in the test set. The variables with
a p value < 0.2 were analyzed with a backward stepwise
Multivariate Cox proportional hazard model. For OS,
the best predictor was the M-score (p = 0.0585) (Hazard
Ratio, 0.3558), and the next best prognostic factor was
the extent of surgical resection (p = 0.0739) (Hazard
Ratio, 0.5996). The M-score was found to be the best
predictor of PFS (p = 0.0247; Hazard Ratio, 0.334).
Discussion
In this report, we characterized the methylation status of
the entire MGMT promoter region using deep sequencing. The methylation status of each CpG site was quantitatively evaluated by sequencing multiple clones. Based
on these results, we constructed a prognosis predictor
that incorporates the methylation status of multiple CpG
sites using supervised learning. The construction of a
classifier using supervised learning is popular in the field
of gene expression profiling, and we demonstrated here
that the same approach is effective for the prediction of
methylation status.
In our patient population, the correlation of the
methylation status with OS was less clear than that with
PFS. This is most likely due to variation of the therapy
used after the first line therapy. The majority of our patients received repeated surgical resections, second line
chemotherapy or additional radiotherapy. For multivariate analysis, age was not a prognosis factor, unlike in the
past reports. We also performed surgical medical treatment with methylation-positive elderly patients. In particular, repeated surgery was likely to prolong the
survival time of the glioblastoma patients with a poor
prognosis.
MSP is the most widely used assay for methylation.
However, MSP can only detect the CpG sites in the primer region; the methylation status of other CpG sites
has no effect on the amplification. In a prior study, only
12.5% of the results obtained from two MSP experiments matched when the forward and reverse primers
were different [35]. In addition, there is no established
method to confirm the quality of bisulfite-converted
genomic DNA. We assessed the quality using the Ct
value of actin in real-time PCR. Approximately 64% of
our glioma samples were methylation-positive with
MSP. The positive rate was higher than that in other
studies with some exceptions [36,37]. We excluded samples damaged by bisulfite treatment in the actin-based
confirmation system, and this process may have increased the positive rate. This discrepancy in MSP results, which is most likely a false positive, might be
influenced by the T genotype of the MGMT C > T
(rs16906252) enhancer single-nucleotide polymorphism
(SNP), which was reported by McDonald et al. [38] to
interact with MGMT promotor methylation. Vlassenbroeck et al. also evaluated the results of qMSP based
on the copy number of actin using real-time PCR [39]. It
is often difficult to set a threshold for agarose gel patterns of MSP. This problem has been overcome by
quantitative MSP [40,41]. Quantitative MSP was applied
in two recent phase 3 trials of glioma [21,22]. However,
the problem of limited coverage of CpG sites by MSP remains in need of technical improvements.
As discussed above, bisulfite sequencing can cover all
CpG sites. In this context, pyrosequencing is considered
to cover more CpG sites than MSP [26]. The methylation proportions can be semi-quantitatively deduced
from the peak height of each incorporated nucleotide.
The main disadvantage of pyrosequencing is its short read
length [25,26]. qBGS using Sanger sequencing is not subject to this limitation, and its moderate read depth provides more accurate quantitative information. Because
deep sequencing with the Sanger method is laborious, the
use of next-generation sequencing may make this approach more comparable to pyrosequencing.
Kanemoto et al. BMC Cancer 2014, 14:641
/>
The major shortcoming of qBGS and pyrosequencing
is the absence of a consensus regarding the data handling of multidimensional quantitative data. Dunn et al.
and Motomura et al. used the average of the methylation
proportion of multiple CpG sites (CpG51 - CpG62,
Dunn et al.; CpG2 - CpG16, Motomura et al.) [42,43].
Karayan-Tapon et al. used the methylation proportion of
five CpG sites (CpG 53–57) and grouped patients using
the median value of the methylation proportion as the
threshold [25]. We developed the M-score diagnostic
system using the analysis method of gene expression
profiling and calculated the optimized threshold by
LOOCV. The M-score is the weighted sum of the
methylation proportions of multiple CpG sites, which
maximizes the correlation with the survival time. Our
approach is more advanced than a simple summation of
the population of methylated sites, and adding data from
a larger patient population will improve the performance
of the predictor. Bady et al. examined the quantitative
value of 18 CpG sites in the MGMT promoter area using
the Infinium methylation BeadChip and revealed two
distinct CpG sites (CpG10 and CpG68). They converted
multidimensional data to one methylation probability
score using the inverse logit function. The classifier was
validated with an external data set [44]. Both studies indicate a new direction for MGMT methylation assays
based on evaluation of multiple CpG sites.
Shah et al. also quantitatively evaluated the methylation of the MGMT promoter [34]. Although the number
of sequenced clones in that study was far less than that
of our study (median of 10 clones), their results were
similar to our results; the CpG sites located downstream
of the transcription start site were often correlated with
PFS. This prior study indicates that our observations are
likely to be universal, and suggests that our prognosis
predictor may be applicable to other patient populations.
The identification of biomarkers of gliomas has been
an active area of research in recent years. It is well
known that IDH mutations are a strong prognostic factor
[45]. IDH mutations are associated with a hypermethylation phenotype [46], suggesting that the methylation of
the MGMT promoter is one part of a genome-wide
methylation profile [47]. Based on qBGS analysis, we identified different extents of methylation of CpG sites in the
MGMT promoter region.
Recently, the methylation status of MGMT has become a focal point in the management of elderly GB patients. Two MGMT methylation analyses using samples
from large phase 3 trials with elderly GB patients
demonstrated that TMZ monotherapy was superior to
conventional radiation therapy for the management of
MGMT-methylated GB patients. Conversely, TMZ monotherapy was inferior to radiation therapy in GB cases with
unmethylated MGMT [21,22]. These results indicate that
Page 9 of 11
the MGMT methylation status is a strong predictive factor
for the efficacy of TMZ monotherapy in elderly GB patients and that evaluating MGMT methylation status is
necessary for the management of these patients. The relationship between the efficacy of TMZ monotherapy and
qBGS-based methylation analysis of the MGMT promoter
in elderly GB merits further investigation.
In addition to its application for elderly patients, TMZ
monotherapy has been utilized for low-grade glioma patients [20,48]. In this group, the co-deletion of 1p19q
and IDH mutations were molecular prognostic factors.
Given the findings in elderly GB patients, the methylation status of the MGMT promoter may also predict the
outcomes of low-grade glioma patients treated by TMZ
monotherapy. Because the MGMT promoter in normal
tissue is generally unmethylated, methylated MGMT
cases are susceptible to contamination by normal tissue.
An advantage of qBGS is that it is easy to observe the
state of contamination. qBGS also revealed intratumoral
heterogeneity in the methylation of the MGMT promoter, which should be considered when using other
methylation assays. Although qBGS is complicated and
time-consuming, it is an important process for evaluating the methylation features of the MGMT promoter.
Conclusions
We constructed a novel diagnostic system to predict the
prognosis of glioblastoma patients using information regarding the methylation status of the entire MGMT promoter region. A precise assessment of the methylation
status of the MGMT promoter may improve the prediction of disease progression and assist in the choice of
TMZ treatment.
Additional files
Additional file 1: Figure S1. Algorithm of quality assessment of
bisulfite-treated genomic DNA. Figure S2. Schematic representation of
leave-one-out cross-validation.
Additional file 2: Table S1. Table of regression coefficients of CpG sites
based on PFS.
Additional file 3: Table S2. Table of regression coefficients of CpG sites
based on OS.
Additional file 4: Agarose gel image of PCR product using FFPE
genomic DNA.
Abbreviations
MGMT: O6-methylguanine-DNA methyltransferase; MSP: Methylation specific
PCR, CpG, cytidine phosphate guanosine; PFS: Progression-free survival;
OS: Overall survival; GB: Glioblastoma; TMZ: Temozolomide;
qBGS: Quantitative bisulfite genome sequencing; DMSO: Dimethyl sulfoxide.
Competing interests
The authors declare that they have no competing interests.
Kanemoto et al. BMC Cancer 2014, 14:641
/>
Authors’ contributions
MK, AN, KN and KT performed the experiments in this study. MS, YK, YA, SM
and KK supervised the research. MK and KK wrote this manuscript. All
authors approved the final manuscript.
Author details
1
Research Institute, Osaka Medical Center for Cancer and Cardiovascular
Diseases, 1-3-3 Nakamichi, Higashinari-ku, Osaka, Japan. 2Department of
Neurosurgery, Kyoto University Graduate School of Medicine, 54
Kawahara-cho, Shogoin, Sakyo-ku, Kyoto-shi, Kyoto 606-8507, Japan.
3
Department of Neuro-Oncology/Neurosurgery, Saitama Medical University
International Medical Center, 1397-1 Yamane, Hidaka, Saitama 350-1298,
Japan.
Page 10 of 11
15.
16.
17.
Received: 4 March 2014 Accepted: 27 August 2014
Published: 30 August 2014
18.
References
1. Anderson E, Grant R, Lewis SC, Whittle IR: Randomized Phase III controlled
trials of therapy in malignant glioma: where are we after 40 years?
Br J Neurosurg 2008, 22(3):339–349.
2. Stupp R, Mason WP, van den Bent MJ, Weller M, Fisher B, Taphoorn MJ,
Belanger K, Brandes AA, Marosi C, Bogdahn U, Curschmann J, Janzer RC,
Ludwin SK, Gorlia T, Allgeier A, Lacombe D, Cairncross JG, Eisenhauer E,
Mirimanoff RO: Radiotherapy plus concomitant and adjuvant
temozolomide for glioblastoma. N Engl J Med 2005, 352(10):987–996.
3. Stupp R, Hegi ME, Mason WP, van den Bent MJ, Taphoorn MJ, Janzer RC,
Ludwin SK, Allgeier A, Fisher B, Belanger K, Hau P, Brandes AA, Gijtenbeek J,
Marosi C, Vecht CJ, Mokhtari K, Wesseling P, Villa S, Eisenhauer E, Gorlia T,
Weller M, Lacombe D, Cairncross JG, Mirimanoff RO: Effects of radiotherapy
with concomitant and adjuvant temozolomide versus radiotherapy
alone on survival in glioblastoma in a randomised phase III study: 5-year
analysis of the EORTC-NCIC trial. Lancet Oncol 2009, 10(5):459–466.
4. Chinot OL, Wick W, Saran F, Mason WP, Henriksson R, Nishikawa R,
Zeaiter AH, Moore N, Das A, Cloughesy TF: AVAglio: a phase III trial of
bevacizumab added to standard radiotherapy and temozolomide in
patients with newly diagnosed glioblastoma. J Clin Oncol 2011,
29(suppl):abstr TPS136.
5. Friedman HS, Prados MD, Wen PY, Mikkelsen T, Schiff D, Abrey LE, Yung WK,
Paleologos N, Nicholas MK, Jensen R, Vredenburgh J, Huang J, Zheng M,
Cloughesy T: Bevacizumab alone and in combination with irinotecan in
recurrent glioblastoma. J Clin Oncol 2009, 27(28):4733–4740.
6. Gilbert MR, Dignam J, Won M, Blumenthal DT, Vogelbaum MA, Aldape KD,
Colman H, Chakravarti A, Jeraj R, Armstrong TS, Wefel JS, Brown PD, Jaeckle
KA, Schiff D, Atkins JN, Brachman D, Werner-Wasik M, Komaki R, Sulman EP,
Mehta MP: RTOG 0825: Phase III double-blind placebo-controlled trial
evaluating bevacizumab (Bev) in patients (Pts) with newly diagnosed
glioblastoma (GBM). J Clin Oncol 2013, 31(supp):abstr 1.
7. Drablos F, Feyzi E, Aas PA, Vaagbo CB, Kavli B, Bratlie MS, Pena-Diaz J,
Otterlei M, Slupphaug G, Krokan HE: Alkylation damage in DNA and
RNA–repair mechanisms and medical significance. DNA Repair (Amst)
2004, 3(11):1389–1407.
8. Gerson SL: MGMT: its role in cancer aetiology and cancer therapeutics.
Nat Rev Cancer 2004, 4(4):296–307.
9. Kaina B, Christmann M, Naumann S, Roos WP: MGMT: key node in the
battle against genotoxicity, carcinogenicity and apoptosis induced by
alkylating agents. DNA Repair (Amst) 2007, 6(8):1079–1099.
10. Nagarajan RP, Costello JF: Epigenetic mechanisms in glioblastoma
multiforme. Semin Cancer Biol 2009, 19(3):188–197.
11. Everhard S, Tost J, El Abdalaoui H, Criniere E, Busato F, Marie Y, Gut IG,
Sanson M, Mokhtari K, Laigle-Donadey F, Hoang-Xuan K, Delattre JY, Thillet
J: Identification of regions correlating MGMT promoter methylation and
gene expression in glioblastomas. Neuro Oncol 2009, 11(4):348–356.
12. Gerson SL: Clinical relevance of MGMT in the treatment of cancer.
J Clin Oncol 2002, 20(9):2388–2399.
13. Verbeek B, Southgate TD, Gilham DE, Margison GP: O6-Methylguanine-DNA
methyltransferase inactivation and chemotherapy. Br Med Bull 2008,
85:17–33.
14. Esteller M, Garcia-Foncillas J, Andion E, Goodman SN, Hidalgo OF, Vanaclocha
V, Baylin SB, Herman JG: Inactivation of the DNA-repair gene MGMT and the
19.
20.
21.
22.
23.
24.
25.
26.
27.
28.
29.
clinical response of gliomas to alkylating agents. N Engl J Med 2000,
343(19):1350–1354.
Gorlia T, van den Bent MJ, Hegi ME, Mirimanoff RO, Weller M, Cairncross JG,
Eisenhauer E, Belanger K, Brandes AA, Allgeier A, Lacombe D, Stupp R:
Nomograms for predicting survival of patients with newly diagnosed
glioblastoma: prognostic factor analysis of EORTC and NCIC trial
26981-22981/CE.3. Lancet Oncol 2008, 9(1):29–38.
Hegi ME, Diserens AC, Godard S, Dietrich PY, Regli L, Ostermann S, Otten P,
Van Melle G, de Tribolet N, Stupp R: Clinical trial substantiates the
predictive value of O-6-methylguanine-DNA methyltransferase promoter
methylation in glioblastoma patients treated with temozolomide.
Clin Cancer Res 2004, 10(6):1871–1874.
Hegi ME, Diserens AC, Gorlia T, Hamou MF, de Tribolet N, Weller M, Kros JM,
Hainfellner JA, Mason W, Mariani L, Bromberg JE, Hau P, Mirimanoff RO,
Cairncross JG, Janzer RC, Stupp R: MGMT gene silencing and benefit from
temozolomide in glioblastoma. N Engl J Med 2005, 352(10):997–1003.
Hegi ME, Liu L, Herman JG, Stupp R, Wick W, Weller M, Mehta MP, Gilbert MR:
Correlation of O6-methylguanine methyltransferase (MGMT) promoter
methylation with clinical outcomes in glioblastoma and clinical strategies
to modulate MGMT activity. J Clin Oncol 2008, 26(25):4189–4199.
Gallego Perez-Larraya J, Ducray F, Chinot O, Catry-Thomas I, Taillandier L, Guillamo
JS, Campello C, Monjour A, Cartalat-Carel S, Barrie M, Huchet A, Beauchesne P,
Matta M, Mokhtari K, Tanguy ML, Honnorat J, Delattre JY: Temozolomide in
elderly patients with newly diagnosed glioblastoma and poor performance
status: an ANOCEF phase II trial. J Clin Oncol 2011, 29(22):3050–3055.
Taal W, Dubbink HJ, Zonnenberg CB, Zonnenberg BA, Postma TJ,
Gijtenbeek JM, Boogerd W, Groenendijk FH, Kros JM, Kouwenhoven MC, van
Marion R, van Heuvel I, van der Holt B, Bromberg JE, Sillevis Smitt PA,
Dinjens WN, van den Bent MJ: First-line temozolomide chemotherapy in
progressive low-grade astrocytomas after radiotherapy: molecular
characteristics in relation to response. Neuro Oncol 2011, 13(2):235–241.
Malmstrom A, Gronberg BH, Marosi C, Stupp R, Frappaz D, Schultz H,
Abacioglu U, Tavelin B, Lhermitte B, Hegi ME, Rosell J, Henriksson R:
Temozolomide versus standard 6-week radiotherapy versus hypofractionated
radiotherapy in patients older than 60 years with glioblastoma: the Nordic
randomised, phase 3 trial. Lancet Oncol 2012, 13(9):916–926.
Wick W, Platten M, Meisner C, Felsberg J, Tabatabai G, Simon M, Nikkhah G,
Papsdorf K, Steinbach JP, Sabel M, Combs SE, Vesper J, Braun C,
Meixensberger J, Ketter R, Mayer-Steinacker R, Reifenberger G, Weller M:
Temozolomide chemotherapy alone versus radiotherapy alone for
malignant astrocytoma in the elderly: the NOA-08 randomised, phase 3
trial. Lancet Oncol 2012, 13(7):707–715.
Parkinson JF, Wheeler HR, Clarkson A, McKenzie CA, Biggs MT, Little NS,
Cook RJ, Messina M, Robinson BG, McDonald KL: Variation of O(6)methylguanine-DNA methyltransferase (MGMT) promoter methylation in
serial samples in glioblastoma. J Neurooncol 2008, 87(1):71–78.
Rand K, Qu W, Ho T, Clark SJ, Molloy P: Conversion-specific detection of
DNA methylation using real-time polymerase chain reaction
(ConLight-MSP) to avoid false positives. Methods 2002, 27(2):114–120.
Karayan-Tapon L, Quillien V, Guilhot J, Wager M, Fromont G, Saikali S,
Etcheverry A, Hamlat A, Loussouarn D, Campion L, Campone M, Vallette FM,
Gratas-Rabbia-Re C: Prognostic value of O6-methylguanine-DNA
methyltransferase status in glioblastoma patients, assessed by five
different methods. J Neurooncol 2010, 97(3):311–322.
Mikeska T, Bock C, El-Maarri O, Hubner A, Ehrentraut D, Schramm J, Felsberg
J, Kahl P, Buttner R, Pietsch T, Waha A: Optimization of quantitative MGMT
promoter methylation analysis using pyrosequencing and combined
bisulfite restriction analysis. J Mol Diagn 2007, 9(3):368–381.
Aoki T, Takahashi JA, Ueba T, Oya N, Hiraoka M, Matsui K, Fukui T,
Nakashima Y, Ishikawa M, Hashimoto N: Phase II study of nimustine,
carboplatin, vincristine, and interferon-beta with radiotherapy for
glioblastoma multiforme: experience of the Kyoto Neuro-Oncology
Group. J Neurosurg 2006, 105(3):385–391.
Shirahata M, Iwao-Koizumi K, Saito S, Ueno N, Oda M, Hashimoto N, Takahashi
JA, Kato K: Gene expression-based molecular diagnostic system for
malignant gliomas is superior to histological diagnosis. Clin Cancer Res 2007,
13(24):7341–7356.
Shirahata M, Oba S, Iwao-Koizumi K, Saito S, Ueno N, Oda M, Hashimoto N,
Ishii S, Takahashi JA, Kato K: Using gene expression profiling to identify a
prognostic molecular spectrum in gliomas. Cancer Sci 2009,
100(1):165–172.
Kanemoto et al. BMC Cancer 2014, 14:641
/>
30. Reesink-Peters N, Wisman GB, Jeronimo C, Tokumaru CY, Cohen Y, Dong
SM, Klip HG, Buikema HJ, Suurmeijer AJ, Hollema H, Boezen HM, Sidransky
D, van der Zee AG: Detecting cervical cancer by quantitative promoter
hypermethylation assay on cervical scrapings: a feasibility study. Mol
Cancer Res 2004, 2(5):289–295.
31. Esteller M, Hamilton SR, Burger PC, Baylin SB, Herman JG: Inactivation of
the DNA repair gene O6-methylguanine-DNA methyltransferase by
promoter hypermethylation is a common event in primary human
neoplasia. Cancer Res 1999, 59(4):793–797.
32. Li H, Durbin R: Fast and accurate short read alignment with Burrows-Wheeler
transform. Bioinformatics 2009, 25(14):1754–1760.
33. Li H, Handsaker B, Wysoker A, Fennell T, Ruan J, Homer N, Marth G,
Abecasis G, Durbin R: The Sequence Alignment/Map format and
SAMtools. Bioinformatics 2009, 25(16):2078–2079.
34. Shah N, Lin B, Sibenaller Z, Ryken T, Lee H, Yoon JG, Rostad S, Foltz G:
Comprehensive analysis of MGMT promoter methylation: correlation
with MGMT expression and clinical response in GBM. PLoS One 2011,
6(1):e16146.
35. van Nifterik KA, van den Berg J, van der Meide WF, Ameziane N, Wedekind LE,
Steenbergen RD, Leenstra S, Lafleur MV, Slotman BJ, Stalpers LJ, Sminia P:
Absence of the MGMT protein as well as methylation of the MGMT
promoter predict the sensitivity for temozolomide. Br J Cancer 2010,
103(1):29–35.
36. Gerstner ER, Yip S, Wang DL, Louis DN, Iafrate AJ, Batchelor TT: Mgmt
methylation is a prognostic biomarker in elderly patients with newly
diagnosed glioblastoma. Neurology 2009, 73(18):1509–1510.
37. Reifenberger G, Hentschel B, Felsberg J, Schackert G, Simon M, Schnell O,
Westphal M, Wick W, Pietsch T, Loeffler M, Weller M: Predictive impact of
MGMT promoter methylation in glioblastoma of the elderly. Int J Cancer
2012, 131(6):1342–1350.
38. McDonald KL, Rapkins RW, Olivier J, Zhao L, Nozue K, Lu D, Tiwari S,
Kuroiwa-Trzmielina J, Brewer J, Wheeler HR, Hitchins MP: The T genotype of
the MGMT C > T (rs16906252) enhancer single-nucleotide polymorphism
(SNP) is associated with promoter methylation and longer survival in
glioblastoma patients. Eur J Cancer 2013, 49(2):360–368.
39. Vlassenbroeck I, Califice S, Diserens AC, Migliavacca E, Straub J, Di Stefano I,
Moreau F, Hamou MF, Renard I, Delorenzi M, Flamion B, DiGuiseppi J, Bierau
K, Hegi ME: Validation of real-time methylation-specific PCR to determine
O6-methylguanine-DNA methyltransferase gene promoter methylation
in glioma. J Mol Diagn 2008, 10(4):332–337.
40. Hattermann K, Mehdorn HM, Mentlein R, Schultka S, Held-Feindt J: A
methylation-specific and SYBR-green-based quantitative polymerase
chain reaction technique for O6-methylguanine DNA methyltransferase
promoter methylation analysis. Anal Biochem 2008, 377(1):62–71.
41. Metellus P, Coulibaly B, Nanni I, Fina F, Eudes N, Giorgi R, Barrie M, Chinot O,
Fuentes S, Dufour H, Ouafik L, Figarella-Branger D: Prognostic impact of
O6-methylguanine-DNA methyltransferase silencing in patients with
recurrent glioblastoma multiforme who undergo surgery and carmustine
wafer implantation: a prospective patient cohort. Cancer 2009,
115(20):4783–4794.
42. Dunn J, Baborie A, Alam F, Joyce K, Moxham M, Sibson R, Crooks D,
Husband D, Shenoy A, Brodbelt A, Wong H, Liloglou T, Haylock B, Walker C:
Extent of MGMT promoter methylation correlates with outcome in
glioblastomas given temozolomide and radiotherapy. Br J Cancer 2009,
101(1):124–131.
43. Motomura K, Natsume A, Kishida Y, Higashi H, Kondo Y, Nakasu Y, Abe T,
Namba H, Wakai K, Wakabayashi T: Benefits of interferon-beta and
temozolomide combination therapy for newly diagnosed primary
glioblastoma with the unmethylated MGMT promoter: A multicenter
study. Cancer 2011, 117(8):1721–1730.
44. Bady P, Sciuscio D, Diserens AC, Bloch J, van den Bent MJ, Marosi C, Dietrich
PY, Weller M, Mariani L, Heppner FL, McDonald DR, Lacombe D, Stupp R,
Delorenzi M, Hegi ME: MGMT methylation analysis of glioblastoma on the
Infinium methylation BeadChip identifies two distinct CpG regions
associated with gene silencing and outcome, yielding a prediction
model for comparisons across datasets, tumor grades, and CIMP-status.
Acta Neuropathol 2012, 124(4):547–560.
45. Yan H, Parsons DW, Jin G, McLendon R, Rasheed BA, Yuan W, Kos I,
Batinic-Haberle I, Jones S, Riggins GJ, Friedman H, Friedman A, Reardon D,
Herndon J, Kinzler KW, Velculescu VE, Vogelstein B, Bigner DD: IDH1 and
IDH2 mutations in gliomas. N Engl J Med 2009, 360(8):765–773.
Page 11 of 11
46. Noushmehr H, Weisenberger DJ, Diefes K, Phillips HS, Pujara K, Berman BP,
Pan F, Pelloski CE, Sulman EP, Bhat KP, Verhaak RG, Hoadley KA, Hayes DN,
Perou CM, Schmidt HK, Ding L, Wilson RK, Van Den Berg D, Shen H,
Bengtsson H, Neuvial P, Cope LM, Buckley J, Herman JG, Baylin SB, Laird PW,
Aldape K: Identification of a CpG island methylator phenotype that
defines a distinct subgroup of glioma. Cancer Cell 2010, 17(5):510–522.
47. van den Bent MJ, Gravendeel LA, Gorlia T, Kros JM, Lapre L, Wesseling P,
Teepen JL, Idbaih A, Sanson M, Smitt PA, French PJ: A hypermethylated
phenotype is a better predictor of survival than MGMT methylation in
anaplastic oligodendroglial brain tumors: a report from EORTC study
26951. Clin Cancer Res 2011, 17(22):7148–7155.
48. Hoang-Xuan K, Capelle L, Kujas M, Taillibert S, Duffau H, Lejeune J, Polivka
M, Criniere E, Marie Y, Mokhtari K, Carpentier AF, Laigle F, Simon JM,
Cornu P, Broet P, Sanson M, Delattre JY: Temozolomide as initial treatment
for adults with low-grade oligodendrogliomas or oligoastrocytomas and
correlation with chromosome 1p deletions. J Clin Oncol 2004,
22(15):3133–3138.
doi:10.1186/1471-2407-14-641
Cite this article as: Kanemoto et al.: Prognostic prediction of
glioblastoma by quantitative assessment of the methylation status of
the entire MGMT promoter region. BMC Cancer 2014 14:641.
Submit your next manuscript to BioMed Central
and take full advantage of:
• Convenient online submission
• Thorough peer review
• No space constraints or color figure charges
• Immediate publication on acceptance
• Inclusion in PubMed, CAS, Scopus and Google Scholar
• Research which is freely available for redistribution
Submit your manuscript at
www.biomedcentral.com/submit