Co-expression of putative stemness and epithelial-to-mesenchymal transition markers on single circulating tumour cells from patients with early and metastatic breast cancer
Bạn đang xem bản rút gọn của tài liệu. Xem và tải ngay bản đầy đủ của tài liệu tại đây (712.77 KB, 10 trang )
Papadaki et al. BMC Cancer 2014, 14:651
/>
RESEARCH ARTICLE
Open Access
Co-expression of putative stemness and
epithelial-to-mesenchymal transition markers on
single circulating tumour cells from patients with
early and metastatic breast cancer
Maria A Papadaki1†, Galatea Kallergi1*†, Zafeiris Zafeiriou1,2, Lefteris Manouras1, Panayiotis A Theodoropoulos3,
Dimitris Mavroudis1,2, Vassilis Georgoulias1,2 and Sofia Agelaki1,2
Abstract
Background: The detection of circulating tumor cells (CTCs) in peripheral blood (PB) of patients with breast cancer
predicts poor clinical outcome. Cancer cells with stemness and epithelial-to-mesenchymal transition (EMT) features
display enhanced malignant and metastatic potential. A new methodology was developed in order to investigate
the co-expression of a stemness and an EMT marker (ALDH1 and TWIST, respectively) on single CTCs of patients
with early and metastatic breast cancer.
Methods: Triple immunofluorescence using anti-pancytokeratin (A45-B/B3), anti-ALDH1 and anti-TWIST antibodies
was performed in cytospins prepared from hepatocellular carcinoma HepG2 cells and SKBR-3, MCF-7 and MDA.
MB.231 breast cancer cell lines. Evaluation of ALDH1 expression levels (high, low or absent) and TWIST subcellular
localization (nuclear, cytoplasmic or absent) was performed using the ARIOL system. Cytospins prepared from
peripheral blood of patients with early (n = 80) and metastatic (n = 50) breast cancer were analyzed for CTC detection
(based on pan-cytokeratin expression and cytomorphological criteria) and characterized according to ALDH1 and
TWIST.
Results: CTCs were detected in 13 (16%) and 25 (50%) patients with early and metastatic disease, respectively. High
ALDH1 expression (ALDH1high) and nuclear TWIST localization (TWISTnuc) on CTCs was confirmed in more patients with
metastatic than early breast cancer (80% vs. 30.8%, respectively; p = 0.009). In early disease, ALDH1low/neg CTCs
(p = 0.006) and TWISTcyt/neg CTCs (p = 0.040) were mainly observed. Regarding co-expression of these markers,
ALDH1high/TWISTnuc CTCs were more frequently evident in the metastatic setting (76% vs. 15.4% of patients, p = 0.001;
61.5% vs. 12.9% of total CTCs), whereas in early disease ALDH1low/neg/TWISTcyt/neg CTCs were mainly detected (61.5% vs.
20% of patients, p = 0.078; 41.9% vs. 7.7% of total CTCs).
Conclusions: A new assay is provided for the evaluation of ALDH1 and TWIST co-expression at the single CTC-level in
patients with breast cancer. A differential expression pattern for these markers was observed both in early and
metastatic disease. CTCs expressing high ALDH1, along with nuclear TWIST were more frequently detected in patients
with metastatic breast cancer, suggesting that these cells may prevail during disease progression.
* Correspondence:
†
Equal contributors
1
Laboratory of Tumor Cell Biology, School of Medicine, University of Crete,
GR-71110 Heraklion, Crete, Greece
Full list of author information is available at the end of the article
© 2014 Papadaki et al.; licensee BioMed Central Ltd. This is an Open Access article distributed under the terms of the Creative
Commons Attribution License ( which permits unrestricted use, distribution, and
reproduction in any medium, provided the original work is properly credited. The Creative Commons Public Domain
Dedication waiver ( applies to the data made available in this article,
unless otherwise stated.
Papadaki et al. BMC Cancer 2014, 14:651
/>
Background
Circulating tumor cells (CTCs) have been identified in
peripheral blood (PB) of patients with breast cancer and
their presence has been associated with poor disease
outcome [1-4]. It has been suggested that CTCs are extremely heterogeneous and that they include the population of cells giving rise to overt metastases [5]. Therefore
further characterization of CTCs at the single cell level
would be of utmost importance in order to understand
their individual biologic role.
Several studies in many tumor types, including breast
cancer, reported that there is a subset of cells with stemness properties, named cancer stem cells (CSCs). These
cells are proposed to display enhanced malignant and
metastatic potential [6-8]. Tumor cells with increased
activity of the detoxifying enzyme aldehyde dehydrogenase (ALDH) are considered as putative breast CSCs, due
to their self-renewal capacity as shown by serial passages
in Nonobese Diabetic/Severe Combined Immunodeficiency (NOD/SCID) mice and their ability to regenerate
the cellular heterogeneity of the initial tumor [9]. Ginestier et al., showed a correlation between ALDH activity
and ALDH1 expression in breast cancer cells [10].
Moreover, the expression of ALDH1 in primary tumors
has been associated with poor prognosis in patients with
breast cancer [10-12]. We, among others, have recently
reported that CTCs expressing ALDH1 are detectable in
patients with metastatic breast cancer, suggesting that
this “stemness phenotype” could be related to metastases
formation [13,14].
There is growing evidence suggesting that both
tumor growth and metastatic dissemination take place
through a phenotypic modulation known as epithelialto-mesenchymal transition (EMT), a process by which
tumor cells lose their epithelial characteristics and acquire
a mesenchymal phenotype [15,16]. TWIST, a basic helixloop-helix transcription factor has been proposed among
others as a putative biomarker for EMT [17,18]. A positive
association between the expression of TWIST in primary
tumors and the risk for recurrence and poor survival has
been shown in breast cancer [19-21]. Moreover, we have
recently reported that TWIST expressing CTCs are frequently observed in patients with breast cancer [22,23],
suggesting that cancer cells might undergo EMT during
vessel invasion, circulation and migration to metastatic
sites.
Recent studies have shown a direct link between CSCs
and EMT in breast cancer, suggesting that EMT generates cancer cells with stem cell-like traits [24-26]. Coexpression of stem cell and EMT markers at the mRNA
expression level has been shown on CTCs of breast cancer patients [27,28]; however, this has not been demonstrated on single CTCs as yet. Taking into account the
considerable heterogeneity of CTCs, the presence of
Page 2 of 10
both stemness and EMT characteristics on individual
CTCs could distinguish a population of cells with enhanced metastatic potential.
In the present study we developed a new methodology
using the ARIOL system, in order to evaluate the protein
expression pattern of a putative stemness (ALDH1) and
an EMT (TWIST) marker on CTCs of early and metastatic breast cancer patients. We aimed to investigate
the co-expression of these markers at the single CTClevel and to evaluate the incidence of distinct CTC subpopulations in early and metastatic disease.
Methods
Patient samples
Peripheral blood (10 ml) was obtained from patients
with early (n = 80) and metastatic (n = 50) breast cancer,
before the initiation of adjuvant and first-line chemotherapy, respectively. In order to avoid contamination
with epithelial cells derived from the skin, blood was obtained at the middle of vein Ppuncture, after the first
5 ml were discarded. Peripheral blood mononuclear cells
(PBMCs) cytospins were prepared and stored until use.
In the current study, prospectively collected cytospins
were analyzed. Peripheral blood was also obtained from
healthy blood donors (n = 20). All patients and healthy
volunteers gave their written informed consent to participate in the study, which has been approved by the
Ethics and Scientific Committees of the University General Hospital of Heraklion, Crete, Greece.
Cytospin preparation
PBMCs were isolated by Ficoll-Hypaque density gradient
(d = 1,077 gr/mol) centrifugation at 1.800 rpm for 30 min.
PBMCs were washed two times with phosphate-buffered
saline (PBS) and centrifuged at 1.600 rpm for 10 min. Aliquots of 250.000 cells were cyto-centrifuged at 2.000 rpm
for 2 min on glass slides. Air-dried cytospins were stored
at −80°C.
Cell cultures
All cell lines were obtained from American Type Culture
Collection (ATCC). The HepG2 (human liver hepatocellular carcinoma), MCF-7 and MDA.MB.231 cells were
cultured in high glucose GlutaMAX(™) Dulbecco’s
Modified Eagle Medium (DMEM) (GIBCO-BRL Co,
MD, USA), supplemented with 10% fetal bovine serum
(FBS) (GIBCO-BRL) and 1% penicillin/streptomycin
(GIBCO-BRL). MCF-7 cell culture medium was additionally supplemented with 0.28% insulin. SKBR-3 cells
were cultured in high glucose GlutaMAX(™) McCoys5A
medium (GIBCO-BRL) supplemented with 10% FBS and
1% penicillin/streptomycin. Cells were maintained in a
humidified atmosphere of 5% CO2- 95% air at 37°C.
Subcultivation of all cell lines was performed using
Papadaki et al. BMC Cancer 2014, 14:651
/>
0.25% trypsin and 5 mM ethylenediaminetetraacetic acid
(EDTA) (GIBCO-BRL).
Immunofluorescence assay
PBMCs’ cytospin preparations were triple-stained with
pan-cytokeratin, ALDH1 and TWIST. Cytokeratin-positive
cells were detected using the A45-B/B3 anti-mouse antibody (recognizing the CK8, CK18 and CK19; Micromet,
Munich, Germany). PBMCs’ cytospins were also doublestained with pan-cytokeratin and CD45 (common leukocyte antigen), in order to exclude possible ectopic expression of cytokeratins in hematopoietic cells, as
previously described [29,30]. As proposed by Meng et al.
[31], the cytomorphological criteria of high nuclear to
cytoplasmic ratio and size larger than white blood cells,
were also employed in order to characterize a cytokeratinpositive cell as a CTC.
PBMCs’ cytospin preparations were fixed with 3% (v/v)
paraformaldehyde (PFA) in PBS for 30 min and permeabilized with 0.5% Triton X-100 in PBS for 10 min at
room temperature (RT). After an overnight blocking
with PBS supplemented with 1% Bovine Serum A (BSA)
at 4PoPC, cells were double-stained for pan-cytokeratin/
CD45 or triple-stained for pan-cytokeratin/ALDH1/
TWIST. The incubation time for all primary and secondary antibodies was 1 h and 45 min, respectively.
Zenon technology (FITC-conjugated IGg1 antibody)
(Molecular Probes, Invitrogen) was used for the detection of pan-cytokeratin (A45-B/B3 anti-mouse antibody).
CD45 was detected using an anti-rabbit antibody (Santa
Cruz, CA, USA) labelled with Alexa 555 (Molecular
Probes, Invitrogen, Carlsbad, CA, USA); ALDH1 was detected using an anti-mouse antibody (Abcam, Cambridge,
UK) labelled with Alexa 555 (Molecular Probes); TWIST
was detected using an anti-rabbit antibody (Abcam) labelled with Alexa 633 (Molecular Probes). Cells were
post-fixed with 3% (v/v) PFA in PBS for 15 min at RT.
Dapi-antifade reagent (Invitrogen) was finally added to
each sample for cell nuclear staining.
A total of 500.000 PBMCs per patient were analyzed
using the ARIOL system CTCs software (Genetix, UK)
as previously described [22]. Results are referred to patients with detectable CTCs only and are expressed as
number of CTCs/500.000 PBMCs.
Page 3 of 10
of 1, 10 and 100 cells per 1*106 PBMCs. All samples were
processed as previously described for patients’ samples.
To determine the specificity of CTC detection, peripheral blood was obtained from ten healthy donors and
samples were also processed as described above. Furthermore, cytospins of HepG2 cells spiked into healthy
donors’ PBMCs (100/250.000 PBMCs) were used as
positive and negative controls in order to evaluate the
specificity of all antibodies. Negative controls were prepared by omitting the corresponding primary antibody
and adding the secondary IgG isotype antibody.
Evaluation of ALDH1 and TWIST expression in cancer cell
lines using the ARIOL system
Cytospins prepared from all cell lines were triple stained
with anti-pancytokeratin, anti-ALDH1 and anti-TWIST
antibodies and analyzed with the ARIOL system. Positive
and negative controls for each antibody were also
prepared.
HepG2 cell line was used as positive control for
ALDH1 expression, as proposed by the manufacturer. A
differential expression of ALDH1, varying from absent
to high was evident among these cells. In order to define
the cut-offs between high, low and absent ALDH1 expression, 50 randomly selected microscope vision fields
were analyzed and a total of 1.500 cells presenting high,
low or no ALDH1 expression (500 cells each) were measured by the ARIOL system. Measurements represent
the exposure time required for the detection of ALDH1
fluorescent signal. Using the resulting cut-offs, ALDH1
expression was further evaluated in three representative
human breast cancer cell lines: SKBR-3, MCF-7 and
MDA.MB.231 (Table 1).
HepG2 cells were also used as positive control for
TWIST expression, since they co-expressed ALDH1 and
TWIST. A differential TWIST subcellular localization in
nucleus and/or cytoplasm could be observed. In this
study, TWIST was characterized as cytoplasmic when
localized exclusively in the cytoplasm, and as nuclear
when localized in the nucleus, regardless of its colocalization in the cytoplasm. Evaluation of TWIST expression was subsequently performed in SKBR-3, MCF-7
and MDA.MB.231.
Evaluation of sensitivity and specificity of CTC detection
Statistical analysis
The sensitivity of CTC detection using the current
methodology was evaluated by two separate approaches;
MCF-7, SKBR-3 and MDA.MB.231 breast cancer cells
were spiked into separate aliquots of 10 ml peripheral
blood obtained from ten healthy female blood donors, at
a concentration of 1, 10 and 100 cells per ml. Furthermore, MCF-7 cells were spiked into separate aliquots of
10*106 PBMCs from healthy volunteers, at a concentration
Statistical analyses were performed using IBM SPSS Statistics version 20. Chi-square test was used to compare
the frequency of CTC phenotypes among early and
metastatic breast cancer patients. Mann Whitney test
was used to compare the incidence of CTCs with different phenotypes per patient between early and metastatic
disease. Spearman’s rho analysis was used to investigate
the correlation between specific phenotypes among
Papadaki et al. BMC Cancer 2014, 14:651
/>
Page 4 of 10
Table 1 Quantification of ALDH1 expression levels in cancer cell lines using the ARIOL system
HepG2
SKBR3
MCF7
MDA.MB.231
ALDH1 expression
levels
Range
Median ± SEa
Range
Median ± SEa
Range
Median ± SEa
Range
Median ± SEa
High
5 – 25
15 ± 0.25
10 – 25
15 ± 0.23
20 – 25
20 ± 0.11
15 – 25
20 ± 0.18
Low
30 – 55
45 ± 0.30
35 – 55
45 ± 0.29
35 – 55
45 ± 0.29
30 – 55
45 ± 0.29
Negative
60 – 90
70 ± 0.30
60 – 90
80 ± 0.39
60 – 90
75 ± 0.29
60 – 100
80 ± 0.46
a
SE: standard error.
CTCs. P values were considered statistically significant
at the 0.05 level.
Results
Sensitivity and specificity of CTC detection
Spiking of breast cancer cell lines into whole blood obtained from healthy donors, revealed that the recovery
rates of MCF-7 cells were 53%, 21% and 19% for the dilutions of 1, 10 and 100 cells per ml, respectively. The
corresponding values were 27%, 19% and 20% for SKBR3 and 21%, 21% and 31% for MDA.MB.231 cells.
Spiking of MCF-7 cells into PBMCs showed recovery
rates of 80% for the dilution of 1 cell per 1*106 PBMCs and
100% for the dilutions 10 and 100 cells per 1*106 PBMCs.
No cytokeratin-positive cells could be detected in
PBMCs’ cytospins from healthy donors; however, expression of both ALDH1 and TWIST could be identified
among PBMCs in all samples analyzed.
Evaluation of cytospins from HepG2 cells spiked into
PBMCs, prepared as positive and negative controls,
showed high specificity for all the antibodies used in the
current assay (Figure 1). Spiked HepG2 were included as
controls in each separate immunofluorescence experiment performed for patient samples.
Definition of high and low ALDH1 expression levels and
characterization of TWIST sub-cellular localization in
cancer cell lines
HepG2 cell line was used as control for the evaluation of
ALDH1 expression levels. High ALDH1 expression was
evident in the great majority of HepG2 cells; however
cells presenting low or absent ALDH1 expression were
also observed (Figure 2A, Additional file 1A). Measurements (exposure time) for high ALDH1 expression levels
ranged from 5 to 25 (median: 15 ± 0.25), while low
ALDH1 expression levels ranged from 30 to 55 (median:
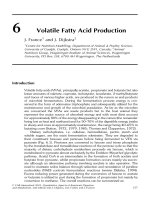
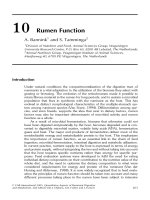
Figure 1 Control experiments for the specificity of Cytokeratin, ALDH1 and TWIST antibodies in HepG2 cells spiked in PBMCs, ARIOL
system. Triple immunofluorescence was performed in cytospin preparations of HepG2 cells spiked in PBMCs from healthy blood donors, using
anti-Cytokeratin (green), anti-ALDH1 (orange) and anti-TWIST (pink) antibodies. Negative controls were prepared for each primary antibody, by
omitting the corresponding primary antibody and adding the secondary IgG isotype antibody. Cell nuclei were stained with Dapi (blue), ARIOL
system (x400).
Papadaki et al. BMC Cancer 2014, 14:651
/>
Page 5 of 10
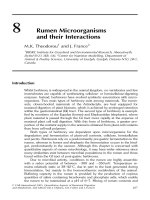
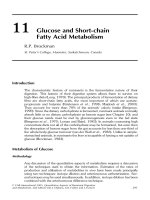
Figure 2 Co-expression of Cytokeratin, ALDH1 and TWIST in cancer cell lines and a single CTC detected in a breast cancer patient,
ARIOL system. Triple immunofluorescence was performed in cytospin preparations using anti-CK (green), anti-ALDH1 (orange) and anti-TWIST
(pink) antibodies. Cell nuclei were stained with Dapi (blue). A) HepG2 control cells and three representative breast cancer cell lines, ARIOL system
(x400). B) A CTC (ALDH1high/TWISTnuc phenotype) detected in a metastatic breast cancer patient, ARIOL system (x200).
45 ± 0.30). Hence, high ALDH1 expression (ALDH1high)
was defined at measurements of 25 or lower, whereas
low ALDH1 expression (ALDH1low) was defined at measurements between 30 to 55. The absence of ALDH1 expression (ALDH1neg) was also evaluated by the use of
negative controls, at measurements of 60 and higher
(range: 60–90, median: 70 ± 0.30). The range of the measurements and the median values with standard error
(SE) within the ALDH1high, ALDH1low and ALDHneg cell
populations are presented in Table 1.
Using the above cut-off points, ALDH1 expression was
subsequently evaluated in three human breast cancer
cell lines: SKBR-3, MCF-7 and MDA.MB.231, representative of the three breast cancer subtypes: HER2-positive
(Human Epidermal Growth Factor Receptor 2), luminal
and basal-like, respectively. ALDH1high, ALDH1low and
ALDHneg cells were detected in all cell lines, with a clear
distinction between high, low and absent ALDH1 expression levels (Figure 2A, Additional file 1A). Comparable median values of measurements within the three
subpopulations (ALDH1high, ALDH1low and ALDHneg)
were confirmed across HepG2 cells and the three breast
cancer cell lines (Table 1).
HepG2 cells were also used as control for the
characterization of TWIST expression. TWIST was localized in the nucleus (TWISTnuc) in the majority of
HepG2 cells; however cells with cytoplasmic TWIST expression (TWISTcyt) and cells lacking TWIST expression
(TWISTneg) were also observed. TWISTnuc, TWISTcyt
and TWISTneg cells were also detected in all breast
Papadaki et al. BMC Cancer 2014, 14:651
/>
Page 6 of 10
Table 2 Incidence of CTC phenotypes according to differential expression patterns of ALDH1 and TWIST in patients
with early and metastatic breast cancer
CTC phenotypes
Patients (%)
Percentage of CTCs per patient (mean; range)
CTCs (%)
Early
Metastatic
p value
Early
Metastatic
p value
Early
Metastatic
ALDH1 high
30.8
80.0
0.009
23 (0–100)
75 (0–100)
0.001
38.7
83.5
ALDH1 low/neg
92.3
32.0
0.006
77 (0–100)
25 (0–100)
0.001
61.3
16.5
TWIST nuc
30.8
80.0
0.009
29 (0–100)
73 (0–100)
0.006
32.3
70.3
TWIST cyt/neg
76.9
40.0
0.040
71 (0–100)
27 (0–100)
0.006
67.7
29.7
Chi-square test (Continuity Correction) and Mann Whitney test were used. Only patients with detectable CTCs were included; early setting: 13 patients and 31
CTCs; metastatic setting: 25 patients and 91 CTCs.
cancer cell lines (Figure 2A, Additional file 1B). Coexpression of ALDH1 and TWIST was also confirmed
in all cell lines.
TWISTnuc and TWISTcyt/neg were identified in 32.3%
and 67.7% of total CTCs, respectively.
ALDH1 and TWIST co-expression
Expression of ALDH1 and TWIST in CTCs of patients with
early breast cancer
CTCs were detected in 13 out of 80 (16.3%) patients,
with a total of 31 CTCs identified [median No. CTCs/
patient: 1 (range: 1–6)].
ALDH1 expression
ALDH1-expressing CTCs were detected in all but one
patient; however CTCs with high ALDH1 expression
(ALDH1high) were observed in 30.8% of patients,
whereas 92.3% had detectable CTCs with low or absent
ALDH1 (ALDH1low/neg) (Table 2). Exclusively ALDH1high
and ALDH1low/neg CTCs were identified in 15.4% and
69.2% of patients, respectively. Regarding the distribution of phenotypes at the CTC level, ALDH1high and
ALDH1low/neg expression was observed in 38.7% and
61.3% of total CTCs, respectively.
TWIST expression
TWIST-expressing CTCs were identified in all but one
patient; in 30.8% of patients CTCs with nuclear TWIST
localization (TWISTnuc) were observed, while 76.9% harvested CTCs with cytoplasmic or absent TWIST expression (TWISTcyt/neg) (Table 2). Exclusively TWISTnuc and
TWISTcyt/neg CTCs were detected in 23.1% and 69.2% of
patients, respectively. Furthermore, the phenotypes
Four different phenotypes could be distinguished according to the co-expression of ALDH1 and TWIST at the single CTC level (Table 3). ALDH1high/TWISTnuc CTCs
were detected in 15.4% of patients, whereas in 61.5%
ALDH1low/neg/TWISTcyt/neg CTCs were identified. There
were no patients presenting exclusively ALDH1high/
TWISTnuc CTCs, while 53.8% of patients had exclusively
ALDH1low/neg/TWISTcyt/neg CTCs. Moreover, ALDH1high/
TWISTnuc and ALDH1low/neg/TWISTcyt/neg phenotypes
were expressed in 12.9% and 41.9% of total CTCs. The frequency of the two other phenotypes (ALDH1high/TWISTcyt/neg
and ALDH1low/neg/ TWISTnuc) among patients and
CTCs is also shown in Table 3.
A heterogeneous distribution of specific CTC phenotypes in individual patients was observed as shown in
Tables 2 and 3, by the differential mean percentages of
CTC subpopulations per patient. This variability is further depicted in Table 4 demonstrating the incidence of
different CTC phenotypes in index patients with early
disease.
Expression of ALDH1 and TWIST in CTCs of patients with
metastatic breast cancer
The presence of CTCs was documented in 25 out of 50
(50%) patients, with a total of 91 CTCs detected [median
No. CTCs/ patient: 2 (range: 1–21)].
Table 3 Incidence of CTC phenotypes according to the co-expression of ALDH1 and TWIST on single CTCs of patients
with early and metastatic breast cancer
CTC phenotypes
Patients (%)
Early
Metastatic
Percentage of CTCs per patient (mean; range)
p value
Early
Metastatic
p value
CTCs (%)
Early
Metastatic
ALDH1high / TWISTnuc
15.4
76.0
0.001
6 (0–50)
64 (0–100)
0.000
12.9
61.5
ALDH1high / TWISTcyt/neg
23.1
24.0
1.000
17 (0–100)
11 (0–100)
0.746
25.8
22.0
ALDH1low/neg / TWISTnuc
30.8
12.0
0.330
23 (0–100)
8 (0–100)
0.152
19.4
8.8
ALDH1low/neg / TWISTcyt/neg
61.5
20.0
0.078
54 (0–100)
16 (0–100)
0.026
41.9
7.7
Chi-square test (Continuity Correction) and Mann Whitney test were used. Only patients with detectable CTCs were included; early setting: 13 patients and 31
CTCs; metastatic setting: 25 patients and 91 CTCs.
Papadaki et al. BMC Cancer 2014, 14:651
/>
Page 7 of 10
Table 4 Distribution of CTC phenotypes according to ALDH1 and TWIST co-expression in index patients with early and
metastatic breast cancer
Patients
Early
1
Total CTC No
3
ALDH1high/TWISTnuc
ALDH1high/TWISTcyt/neg
ALDH1low/neg/TWISTnuc
ALDH1low/neg/TWISTcyt/neg
CTC No (%)
CTC No (%)
CTC No (%)
CTC No (%)
0
(0)
0
(0)
0
(0)
3
(100)
2
5
0
(0)
0
(0)
0
(0)
5
(100)
3
3
1
(33.3)
0
(0)
2
(66.7)
0
(0)
4
6
3
(50)
1
(16.7)
2
(33.3)
0
(0)
5
6
0
(0)
6
(100)
0
(0)
0
(0)
1
2
2
(100)
0
(0)
0
(0)
0
(0)
2
11
10
3
2
1
Metastatic
(90.9)
1
(9.1)
0
(0)
0
(0)
(50)
0
(0)
1
(50)
0
(0)
4
3
1
(20)
5
21
5
(23.8)
2
14
(80)
0
(0)
0
(0)
(66.7)
0
(0)
2
(9.5)
6
2
0
(0)
0
(0)
0
(0)
2
(100)
7
11
3
(27.2)
2
(18.2)
6
(54.5)
0
(0)
ALDH1 expression
ALDH1-expressing CTCs were evident in all patients;
however, ALDH1high CTCs were detected in 80% of patients (p = 0.009, compared to early disease), whereas
ALDH1low/neg CTCs were observed in 32% (p = 0.006)
(Table 2). Exclusively ALDH1high and ALDH1low/neg CTCs
were detected in 68% and 20% of patients (p = 0.006 and
p = 0.009, respectively, compared to early patients). Moreover, ALDH1high and ALDH1low/neg was identified in
83.5% and 16.5% of total CTCs, respectively.
respectively. The incidence of ALDH1high/TWISTcyt/neg
and ALDH1low/neg/TWISTnuc CTCs was similar to early
disease (Table 3). As shown for early disease, distinct CTC
phenotypes could be observed in individual metastatic patients (Tables 3 and 4). An ALDH1high/TWISTnuc CTC is
depicted in Figure 2B.
Finally, a positive correlation between ALDH1high and
TWISTnuc expression was confirmed on CTCs of metastatic patients (p = 0.001, Spearman’s rho analysis),
whereas ALDH1low/neg was associated with TWISTcyt/neg
(p = 0.001).
TWIST expression
TWIST-expressing CTCs were also detected in all patients; however TWISTnuc CTCs were identified in 80%
of patients, while TWISTcyt/neg were observed in 40%
(p = 0.009 and p = 0.040, compared to early disease)
(Table 2). Exclusively TWISTnuc and TWISTcyt/neg CTCs
were detected in 64% (p = 0.040) and 20% (p = 0.009) of
patients. Furthermore, the phenotypes TWISTnuc and
TWISTcyt/neg were observed in 70.3% and 29.7% of total
CTCs, respectively.
ALDH1 and TWIST co-expression
Evaluation of ALDH1 and TWIST co-expression on
single CTCs showed that 76% of patients harvested
ALDH1high/TWISTnuc CTCs (p = 0.001, compared to early
patients), whereas 20% had detectable ALDH1low/neg/
TWISTcyt/neg CTCs (p = 0.078) (Table 3). Exclusively
ALDH1high/TWISTnuc and ALDH1low/neg/TWISTcyt/neg
CTCs were detected in 56% (p = 0.002) and 16% (p = 0.078)
of patients, respectively. In the CTC level, the phenotypes
ALDH1high/TWISTnuc and ALDH1low/neg/TWISTcyt/neg
were confirmed in 61.5% and 7.7% of total CTCs,
Discussion
CTCs are considered to be the active source of metastatic spread; however only a few of these cells are capable of forming metastatic deposits in distant organs.
Indeed, although the presence of CTCs in patients with
breast cancer has been associated with poor prognosis
[2,4], many patients do not relapse even when CTCs are
detected in their blood. Thus, besides detection, further
phenotypic characterization of these cells might provide
additional information for their metastatic potential.
Metastasis is a complex multistep cascade of events
and cancer cells need to be highly equipped in order to
fulfill the metastatic process. CSCs are suggested to have
the ability to self-renew and regenerate the tumor [8].
Moreover, EMT has been linked to cancer progression
and acquisition of stem cell-like properties [32]. Thus,
CTCs co-expressing stem cell and EMT markers could
be actively involved in tumor progression. We have reported that the stemness markers CD44/CD24 and
ALDH1 are expressed in CTCs of patients with metastatic breast cancer [14]. Moreover, we have recently
Papadaki et al. BMC Cancer 2014, 14:651
/>
shown that the EMT markers TWIST and Vimentin
were frequently expressed on CTCs of patients with
early and metastatic breast cancer [22]. In this study, we
developed a new methodology to investigate the expression pattern of ALDH1 and TWIST on CTCs of breast
cancer patients and to evaluate their co-expression at
the single CTC level.
The expression of ALDH1 in primary tumors has been
associated with poor patient outcome in several cancers,
including breast cancer [10,12,33]. Moreover, differential
ALDH1 expression levels have been demonstrated and a
positive correlation has been suggested between high
ALDH1 and worse clinical outcome [34-36]. High
ALDH1 protein expression has also been associated with
high ALDH enzymatic activity, a putative marker for
CSCs [37]. Accordingly, in the present immunofluorescence assay, a quantitative analysis of ALDH1 expression
levels by the use of the ARIOL system software was
employed [22].
With the provided quantification method, a clear distinction between high and low ALDH1 expression was
demonstrated in HepG2 control cell line. The evaluation
of ALDH1 expression in three breast cancer cell lines
representative of HER2-positive, luminal and basal-like
subtypes, further confirmed the presence of ALDH1high,
ALDH1low and ALDHneg cells within each cell line. The
comparable range and median expression values of each
cell subpopulation among all cell lines verified the objectivity of ALDH1 quantification irrespectively of the
specific breast cancer subtype and allowed its application
on patient samples.
Interestingly, although ALDH1-expressing CTCs were
identified in almost all CTC-positive patients, the pattern of ALDH1 expression differed among CTCs in both
clinical settings. Moreover, ALDH1high CTCs were more
frequently observed in metastatic patients, whereas
ALDH1low/neg CTCs were mainly detected in patients
with early disease. This observation suggests that
ALDH1high CTCs predominate during disease progression and leads to the assumption that CTCs bearing
stemness characteristics may have an active role in the
metastatic process. We have previously reported a lower
frequency of ALDH1high CTCs in patients with metastatic breast cancer, which could be explained by the
lower number of patients included in that study, as well
as by the different methodologies used for the titration
of ALDH1 expression [14].
TWIST is a transcription factor with a pivotal role in
EMT induction, both in normal and cancer cells [38].
The expression of TWIST in breast tumors has been
correlated to increased metastatic potential and poor
survival [19]. In the present study, we further analyzed
the subcellular localization of TWIST on CTCs, since efficient nuclear localization is essential for a protein to
Page 8 of 10
operate as an activator and/or repressor of transcription
of target genes [39]. Furthermore, Yuen et al. showed
that nuclear TWIST localization predicted the metastatic potential of prostate tumors [40], whereas in
esophageal squamous cell carcinoma, it was associated
with lymph node metastasis [41]. The data presented in
the current study are in agreement with our previously
reported results showing that TWIST is expressed in the
majority of CTCs derived from patients with breast cancer [22]. Here we further show that CTCs present a differential TWIST subcellular localization pattern. In
addition, we demonstrate that TWISTnuc CTCs were
more frequently detected in metastatic patients, while in
early disease TWISTcyt/neg CTCs were mainly observed.
This observation suggests that TWIST localization may
be related with functional cellular properties during the
different stages of the disease. It could be hypothesized
that TWISTnuc CTCs are undergoing EMT and selected
during disease progression. In accordance, a recent study
showed that CTCs of breast cancer patients exhibit dynamic changes in epithelial and mesenchymal composition and that the presence of CTCs in EMT state was
associated with disease progression [42].
Previous studies have also reported the expression of
ALDH1 and TWIST on CTCs of early and metastatic
breast cancer patients [27,43], though at a lower frequency. This could be attributed to methodological differences, since the AdnaTest used in these studies
analyzes mRNA expression in CTC-positive blood samples, whereas in the current assay protein expression on
single CTCs is evaluated.
Using the present assay, four different CTC phenotypes were identified according to the simultaneous
evaluation of both markers. An interesting finding was
the considerable inter- and intra-patient heterogeneity
regarding the frequency of distinct CTC subpopulations
either in the early or the metastatic disease setting.
Moreover, a differential distribution of phenotypes was evident comparing the two groups of patients; ALDH1high/
TWISTnuc CTCs were more prominent among metastatic
patients, whereas the ALDH1low/neg/TWISTcyt/neg phenotype predominated in patients with early disease. The
finding that ALDH1high and TWISTnuc phenotypes were
mainly co-expressed in the same CTC, as well as their
positive correlation shown in metastatic disease, further
supports the hypothesis of a link between stemness and
EMT characteristics on cancer cells. [44,45]. This is also
in agreement with recent studies showing that overexpression of TWIST induces ALDH1 expression in cell
lines [46,47].
In the current study, CTCs bearing high ALDH1 expression, along with nuclear TWIST localization, are not
proven to be cancer stem cells undergoing EMT. Further
experiments with functional assays would be required to
Papadaki et al. BMC Cancer 2014, 14:651
/>
validate their stemness and EMT properties. Nevertheless, this is beyond the scope of the current report which
aimed in the evaluation of previously suggested stemness
and EMT markers on single CTCs. The higher prevalence of these markers in metastatic breast cancer patients suggests that they could possibly distinguish a
subpopulation of CTCs with aggressive biological properties. Therefore, phenotypic characterization of CTCs
according to the expression of ALDH1 and TWIST
merits further evaluation in a larger cohort of patients,
in order to investigate the clinical significance of the
above findings.
Conclusions
The current study provides a new methodology for the
evaluation of ALDH1 and TWIST co-expression on single CTCs of patients with breast cancer. Using this assay,
distinct CTC phenotypes, according to ALDH1 expression levels and TWIST subcellular localization, were
designated in patients with early and metastatic breast
cancer. The higher incidence of CTCs bearing putative
stem cell and EMT traits in metastatic disease, suggests
that these characteristics may prevail on CTCs during
disease progression. A correlation between stemness and
EMT features was further confirmed on single CTCs.
Additional file
Additional file 1: Expression of ALDH1 and TWIST in cancer cell
lines, ARIOL system. Single immunofluorescence was performed in
cytospin preparations from HepG2 control cells and three breast cancer
cell lines, ARIOL system (x400). The different phenotypes according to the
expression pattern of ALDH1 and TWIST are shown indicatively in MCF7
cells. A) ALDH1high, ALDH1low and ALDH1neg cells were observed within
all cell lines, by staining with anti-ALDH1 antibody (orange). B) TWISTnuc,
TWISTcyt and TWISTneg cells were detected within each cell line, using an
anti-TWIST antibody (pink). Cell nuclei were stained with Dapi (blue).
Competing interests
The authors declare that they have no competing interests.
Authors’ contributions
MAP developed the methodology and performed the acquisition, analysis
and interpretation of data. She also performed the cell cultures, the
immunofluorescence experiments and drafted the manuscript. GK
participated in study design and coordination, development of the
methodology and data interpretation and was involved in drafting the
manuscript. ZZ helped to draft the manuscript. LM performed the cytospin
preparations of patients’ samples. PAT participated in the design of the study
and data interpretation and helped in drafting the manuscript. DM and VG
provided general support, participated in study design and data
interpretation and were involved in drafting the manuscript. SA conceived
the study, participated in study coordination and data interpretation,
supervised the study and was involved in drafting the manuscript. All the
authors gave their final approval of the version to be published.
Acknowledgements
The present work was funded by SYNERGASIA 2009 PROGRAMME. This
Programme is co-funded by the European Regional Development Fund and
National Resources (General Secretariat of Research and Technology in
Greece), Project code: Onco-Seed diagnostics. This work was also funded by
Page 9 of 10
a Post graduate Scholarship from the School of Medicine, University of Crete,
Heraklion, Greece.
Author details
1
Laboratory of Tumor Cell Biology, School of Medicine, University of Crete,
GR-71110 Heraklion, Crete, Greece. 2Department of Medical Oncology,
University Hospital of Heraklion, GR-71110 Heraklion, Crete, Greece.
3
Laboratory of Biochemistry, School of Medicine, University of Crete,
GR-71110 Heraklion, Crete, Greece.
Received: 19 September 2013 Accepted: 29 August 2014
Published: 3 September 2014
References
1. Cristofanilli M, Broglio KR, Guarneri V, Jackson S, Fritsche HA, Islam R,
Dawood S, Reuben JM, Kau SW, Lara JM, Krishnamurthy S, Ueno NT,
Hortobagyi GN, Valero V: Circulating tumor cells in metastatic breast
cancer: biologic staging beyond tumor burden. Clin Breast Cancer 2007,
7:471–479.
2. Xenidis N, Ignatiadis M, Apostolaki S, Perraki M, Kalbakis K, Agelaki S,
Stathopoulos EN, Chlouverakis G, Lianidou E, Kakolyris S, Georgoulias V,
Mavroudis D: Cytokeratin-19 mRNA-positive circulating tumor cells after
adjuvant chemotherapy in patients with early breast cancer. J Clin Oncol
2009, 27:2177–2184.
3. Bidard FC, Vincent-Salomon A, Sigal-Zafrani B, Dieras V, Mathiot C, Mignot L,
Thiery JP, Sastre-Garau X, Pierga JY: Prognosis of women with stage IV
breast cancer depends on detection of circulating tumor cells rather
than disseminated tumor cells 11. Ann Oncol 2008, 19:496–500.
4. Androulakis N, Agelaki S, Perraki M, Apostolaki S, Bozionelou V, Pallis A, Kalbakis
K, Xyrafas A, Mavroudis D, Georgoulias V: Clinical relevance of circulating
CK-19mRNA-positive tumour cells before front-line treatment in patients
with metastatic breast cancer. Br J Cancer 2012, 106:1917–1925.
5. Hoon DS, Ferris R, Tanaka R, Chong KK, ix-Panabieres C, Pantel K: Molecular
mechanisms of metastasis. J Surg Oncol 2011, 103:508–517.
6. Croker AK, Goodale D, Chu J, Postenka C, Hedley BD, Hess DA, Allan AL:
High aldehyde dehydrogenase and expression of cancer stem cell
markers selects for breast cancer cells with enhanced malignant and
metastatic ability. J Cell Mol Med 2008, 13:2236–2252.
7. Lohberger B, Rinner B, Stuendl N, Absenger M, Liegl-Atzwanger B, Walzer SM,
Windhager R, Leithner A: Aldehyde dehydrogenase 1, a potential marker for
cancer stem cells in human sarcoma 5. PLoS One 2012, 7:e43664.
8. Al-Hajj M, Wicha MS, ito-Hernandez A, Morrison SJ, Clarke MF: Prospective
identification of tumorigenic breast cancer cells. Proc Natl Acad Sci U S A
2003, 100:3983–3988.
9. Charafe-Jauffret E, Ginestier C, Iovino F, Wicinski J, Cervera N, Finetti P, Hur
MH, Diebel ME, Monville F, Dutcher J, Brown M, Viens P, Xerri L, Bertucci F,
Stassi G, Dontu G, Birnbaum D, Wicha MS: Breast cancer cell lines contain
functional cancer stem cells with metastatic capacity and a distinct
molecular signature. Cancer Res 2009, 69:1302–1313.
10. Ginestier C, Hur MH, Charafe-Jauffret E, Monville F, Dutcher J, Brown M,
Jacquemier J, Viens P, Kleer CG, Liu S, Schott A, Hayes D, Birnbaum D, Wicha
MS, Dontu G: ALDH1 is a marker of normal and malignant human
mammary stem cells and a predictor of poor clinical outcome. Cell Stem
Cell 2007, 1:555–567.
11. Ohi Y, Umekita Y, Yoshioka T, Souda M, Rai Y, Sagara Y, Sagara Y, Sagara Y,
Tanimoto A: Aldehyde dehydrogenase 1 expression predicts poor
prognosis in triple-negative breast cancer. Histopathology 2011, 59:776–780.
12. Yoshioka T, Umekita Y, Ohi Y, Souda M, Sagara Y, Sagara Y, Sagara Y, Rai Y,
Tanimoto A: Aldehyde dehydrogenase 1 expression is a predictor of
poor prognosis in node-positive breast cancers: a long-term follow-up
study. Histopathology 2011, 58:608–616.
13. Gradilone A, Naso G, Raimondi C, Cortesi E, Gandini O, Vincenzi B, Saltarelli
R, Chiapparino E, Spremberg F, Cristofanilli M, Frati L, Aglianò AM, Gazzaniga
P: Circulating tumor cells (CTCs) in metastatic breast cancer (MBC):
prognosis, drug resistance and phenotypic characterization. Ann Oncol
2011, 22:86–92.
14. Theodoropoulos PA, Polioudaki H, Agelaki S, Kallergi G, Saridaki Z,
Mavroudis D, Georgoulias V: Circulating tumor cells with a putative stem
cell phenotype in peripheral blood of patients with breast cancer. Cancer
Lett 2010, 288:99–106.
Papadaki et al. BMC Cancer 2014, 14:651
/>
15. Polyak K, Weinberg RA: Transitions between epithelial and mesenchymal
states: acquisition of malignant and stem cell traits. Nat Rev Cancer 2009,
9:265–273.
16. Willipinski-Stapelfeldt B, Riethdorf S, Assmann V, Woelfle U, Rau T, Sauter G,
Heukeshoven J, Pantel K: Changes in cytoskeletal protein composition
indicative of an epithelial-mesenchymal transition in human
micrometastatic and primary breast carcinoma cells. Clin Cancer Res 2005,
11:8006–8014.
17. Zeisberg M, Neilson EG: Biomarkers for epithelial-mesenchymal transitions.
J Clin Invest 2009, 119:1429–1437.
18. Yang J, Mani SA, Donaher JL, Ramaswamy S, Itzykson RA, Come C, Savagner
P, Gitelman I, Richardson A, Weinberg RA: Twist, a master regulator of
morphogenesis, plays an essential role in tumor metastasis 1. Cell 2004,
117:927–939.
19. Martin TA, Goyal A, Watkins G, Jiang WG: Expression of the transcription
factors snail, slug, and twist and their clinical significance in human
breast cancer. Ann Surg Oncol 2005, 12:488–496.
20. Yang J, Mani SA, Weinberg RA: Exploring a new twist on tumor
metastasis. Cancer Res 2006, 66:4549–4552.
21. Watson MA, Ylagan LR, Trinkaus KM, Gillanders WE, Naughton MJ, Weilbaecher
KN, Fleming TP, Aft RL: Isolation and molecular profiling of bone marrow
micrometastases identifies TWIST1 as a marker of early tumor relapse in
breast cancer patients 1. Clin Cancer Res 2007, 13:5001–5009.
22. Kallergi G, Papadaki MA, Politaki E, Mavroudis D, Georgoulias V, Agelaki S:
Epithelial-mesenchymal transition markers expressed in circulating
tumor cells of early and metastatic breast cancer patients. Breast Cancer
Res 2011, 13:R59.
23. Strati A, Markou A, Parisi C, Politaki E, Mavroudis D, Georgoulias V, Lianidou
E: Gene expression profile of circulating tumor cells in breast cancer by
RT-qPCR 2. BMC Cancer 2011, 11:422.
24. Mani SA, Guo W, Liao MJ, Eaton EN, Ayyanan A, Zhou AY, Brooks M,
Reinhard F, Zhang CC, Shipitsin M, Campbell LL, Polyak K, Brisken C, Yang J,
Weinberg RA: The epithelial-mesenchymal transition generates cells with
properties of stem cells 16. Cell 2008, 133:704–715.
25. Shipitsin M, Campbell LL, Argani P, Weremowicz S, Bloushtain-Qimron N,
Yao J, Nikolskaya T, Serebryiskaya T, Beroukhim R, Hu M, Halushka MK,
Sukumar S, Parker LM, Anderson KS, Harris LN, Garber JE, Richardson AL,
Schnitt SJ, Nikolsky Y, Gelman RS, Polyak K: Molecular definition of breast
tumor heterogeneity4. Cancer Cell 2007, 11:259–273.
26. Morel AP, Lievre M, Thomas C, Hinkal G, Ansieau S, Puisieux A: Generation
of breast cancer stem cells through epithelial-mesenchymal transition.
PLoS One 2008, 3:e2888.
27. Aktas B, Tewes M, Fehm T, Hauch S, Kimmig R, Kasimir-Bauer S: Stem cell
and epithelial-mesenchymal transition markers are frequently
overexpressed in circulating tumor cells of metastatic breast cancer
patients. Breast Cancer Res 2009, 11:R46.
28. Raimondi C, Gradilone A, Naso G, Vincenzi B, Petracca A, Nicolazzo C,
Palazzo A, Saltarelli R, Spremberg F, Cortesi E, Gazzaniga P: Epithelialmesenchymal transition and stemness features in circulating tumor cells
from breast cancer patients. Breast Cancer Res Treat 2011, 130:449–455.
29. Kallergi G, Mavroudis D, Georgoulias V, Stournaras C: Phosphorylation of
FAK, PI-3 K, and impaired actin organization in CK-positive
micrometastatic breast cancer cells. Mol Med 2007, 13:79–88.
30. Kallergi G, Markomanolaki H, Giannoukaraki V, Papadaki MA, Strati A, Lianidou
ES, Georgoulias V, Mavroudis D, Agelaki S: Hypoxia-inducible factor-1alpha
and vascular endothelial growth factor expression in circulating tumor cells
of breast cancer patients. Breast Cancer Res 2009, 11:R84.
31. Meng S, Tripathy D, Frenkel EP, Shete S, Naftalis EZ, Huth JF, Beitsch PD,
Leitch M, Hoover S, Euhus D, Haley B, Morrison L, Fleming TP, Herlyn D,
Terstappen LW, Fehm T, Tucker TF, Lane N, Wang J, Uhr JW: Circulating
tumor cells in patients with breast cancer dormancy. Clin Cancer Res
2004, 10:8152–8162.
32. Hollier BG, Evans K, Mani SA: The epithelial-to-mesenchymal transition
and cancer stem cells: a coalition against cancer therapies. J Mammary
Gland Biol Neoplasia 2009, 14:29–43.
33. Avoranta ST, Korkeila EA, Ristamaki RH, Syrjanen KJ, Carpen OM, Pyrhonen
SO, Sundstrom JT: ALDH1 expression indicates chemotherapy resistance
and poor outcome in node-negative rectal cancer. Hum Pathol 2013,
44:966–974.
34. Neumeister V, Agarwal S, Bordeaux J, Camp RL, Rimm DL: In situ
identification of putative cancer stem cells by multiplexing ALDH1,
Page 10 of 10
35.
36.
37.
38.
39.
40.
41.
42.
43.
44.
45.
46.
47.
CD44, and cytokeratin identifies breast cancer patients with poor
prognosis. Am J Pathol 2010, 176:2131–2138.
Su Y, Qiu Q, Zhang X, Jiang Z, Leng Q, Liu Z, Stass SA, Jiang F: Aldehyde
dehydrogenase 1 A1-positive cell population is enriched in tumorinitiating cells and associated with progression of bladder cancer. Cancer
Epidemiol Biomarkers Prev 2010, 19:327–337.
Li T, Su Y, Mei Y, Leng Q, Leng B, Liu Z, Stass SA, Jiang F: ALDH1A1 is a
marker for malignant prostate stem cells and predictor of prostate
cancer patients' outcome. Lab Invest 2010, 90:234–244.
Deng S, Yang X, Lassus H, Liang S, Kaur S, Ye Q, Li C, Wang LP, Roby KF,
Orsulic S, Connolly DC, Zhang Y, Montone K, Bützow R, Coukos G, Zhang L:
Distinct expression levels and patterns of stem cell marker, aldehyde
dehydrogenase isoform 1 (ALDH1), in human epithelial cancers. PLoS
One 2010, 5:e10277.
Kang Y, Massague J: Epithelial-mesenchymal transitions: twist in
development and metastasis 1. Cell 2004, 118:277–279.
Schwoebel ED, Moore MS: The control of gene expression by regulated
nuclear transport. Essays Biochem 2000, 36:105–113.
Yuen HF, Chua CW, Chan YP, Wong YC, Wang X, Chan KW: Significance of
TWIST and E-cadherin expression in the metastatic progression of
prostatic cancer. Histopathology 2007, 50:648–658.
Gong T, Xue Z, Tang S, Zheng X, Xu G, Gao L, Zhao G, Hong L, Tang G,
Zhang H, Wang R, Jiang Y, Fan D: Nuclear expression of Twist promotes
lymphatic metastasis in esophageal squamous cell carcinoma. Cancer Biol
Ther 2012, 13:606–613.
Yu M, Bardia A, Wittner BS, Stott SL, Smas ME, Ting DT, Isakoff SJ, Ciciliano
JC, Wells MN, Shah AM, Concannon KF, Donaldson MC, Sequist LV, Brachtel
E, Sgroi D, Baselga J, Ramaswamy S, Toner M, Haber DA, Maheswaran S:
Circulating breast tumor cells exhibit dynamic changes in epithelial and
mesenchymal composition. Science 2013, 339:580–584.
Kasimir-Bauer S, Hoffmann O, Wallwiener D, Kimmig R, Fehm T: Expression
of stem cell and epithelial-mesenchymal transition markers in primary
breast cancer patients with circulating tumor cells. Breast Cancer Res
2012, 14:R15.
Vazquez-Martin A, Oliveras-Ferraros C, Cufi S, Del BS, Martin-Castillo B,
Menendez JA: Metformin regulates breast cancer stem cell ontogeny by
transcriptional regulation of the epithelial-mesenchymal transition (EMT)
status 7. Cell Cycle 2010, 9:3807–3814.
Yang MH, Hsu DS, Wang HW, Wang HJ, Lan HY, Yang WH, Huang CH, Kao
SY, Tzeng CH, Tai SK, Chang SY, Lee OK, Wu KJ: Bmi1 is essential in Twist1induced epithelial-mesenchymal transition. Nat Cell Biol 2010, 12:982–992.
Vesuna F, Lisok A, Kimble B, Domek J, Kato Y, van der Groep P, Artemov D,
Kowalski J, Carraway H, van Diest P, Raman V: Twist contributes to
hormone resistance in breast cancer by downregulating estrogen
receptor-alpha 16. Oncogene 2012, 31:3223–3234.
Li J, Zhou BP: Activation of beta-catenin and Akt pathways by Twist are
critical for the maintenance of EMT associated cancer stem cell-like
characters. BMC Cancer 2011, 11:49.
doi:10.1186/1471-2407-14-651
Cite this article as: Papadaki et al.: Co-expression of putative stemness
and epithelial-to-mesenchymal transition markers on single circulating
tumour cells from patients with early and metastatic breast cancer. BMC
Cancer 2014 14:651.
Submit your next manuscript to BioMed Central
and take full advantage of:
• Convenient online submission
• Thorough peer review
• No space constraints or color figure charges
• Immediate publication on acceptance
• Inclusion in PubMed, CAS, Scopus and Google Scholar
• Research which is freely available for redistribution
Submit your manuscript at
www.biomedcentral.com/submit