Dual tracer evaluation of dynamic changes in intratumoral hypoxic and proliferative states after radiotherapy of human head and neck cancer xenografts using radiolabeled FMISO and FLT
Bạn đang xem bản rút gọn của tài liệu. Xem và tải ngay bản đầy đủ của tài liệu tại đây (1.99 MB, 9 trang )
Fatema et al. BMC Cancer 2014, 14:692
/>
RESEARCH ARTICLE
Open Access
Dual tracer evaluation of dynamic changes in
intratumoral hypoxic and proliferative states after
radiotherapy of human head and neck cancer
xenografts using radiolabeled FMISO and FLT
Chowdhury Nusrat Fatema1, Songji Zhao1,2*, Yan Zhao3, Wenwen Yu1,4, Ken-ichi Nishijima5,6, Koichi Yasuda7,
Yoshimasa Kitagawa4, Nagara Tamaki3 and Yuji Kuge5,6
Abstract
Background: Radiotherapy is an important treatment strategy for head and neck cancers. Tumor hypoxia and
repopulation adversely affect the radiotherapy outcome. Accordingly, fractionated radiotherapy with dose escalation or
altered fractionation schedule is used to prevent hypoxia and repopulation. 18F-fluoromisonidazole (FMISO) and
18
F-fluorothymidine (FLT) are noninvasive markers for assessing tumor hypoxia and proliferation, respectively. Thus, we
evaluated the dynamic changes in intratumoral hypoxic and proliferative states following radiotherapy using the dual
tracers of 18F-FMISO and 3H-FLT, and further verified the results by immunohistochemical staining of pimonidazole
(a hypoxia marker) and Ki-67 (a proliferation marker) in human head and neck cancer xenografts (FaDu).
Methods: FaDu xenografts were established in nude mice and assigned to the non-radiation-treated control and two
radiation-treated groups (10- and 20-Gy). Tumor volume was measured daily. Mice were sacrificed 6, 24, and 48 hrs and
7 days after radiotherapy. 18F-FMISO, and 3H-FLT and pimonidazole were injected intravenously 4 and 2 hrs before
sacrifice, respectively. Intratumoral 18F-FMISO and 3H-FLT levels were assessed by autoradiography. Pimonidazole and
Ki-67 immunohistochemistries were performed.
Results: In radiation-treated mice, tumor growth was significantly suppressed compared with the control group, but
the tumor volume in these mice gradually increased with time. Visual inspection showed that intratumoral 18F-FMISO
and 3H-FLT distribution patterns were markedly different. Intratumoral 18F-FMISO level did not show significant changes
after radiotherapy among the non-radiation-treated control and radiation-treated groups, whereas 3H-FLT level
markedly decreased to 59 and 45% of the non-radiation-treated control at 6 hrs (p < 0.0001) and then gradually
increased with time in the 10- and 20-Gy-radiation-treated groups. The pimonidazole-positive hypoxic areas were
visually similar in both the non-radiation-treated control and radiation-treated groups. No significant differences were
observed in the percentage of pimonidazole-positive cells and Ki-67 index.
Conclusion: Intratumoral 18F-FMISO level did not change until 7 days, whereas 3H-FLT level markedly decreased at 6 hrs
and then gradually increased with time after a single dose of radiotherapy. The concomitant monitoring of dynamic
changes in tumor hypoxia and proliferation may provide important information for a better understanding of tumor
biology after radiotherapy and for radiotherapy planning, including dose escalation and altered fractionation schedules.
Keywords: Fluoromisonidazole, Fluorothymidine, Radiotherapy, Tumor reoxygenation and proliferation, Head and neck
cancer xenograft
* Correspondence:
1
Department of Tracer Kinetics & Bioanalysis, Graduate School of Medicine,
Hokkaido University, Kita 15, Nishi 7, Kita-ku, Sapporo 060-8638, Japan
2
Department of Molecular Imaging, Graduate School of Medicine, Hokkaido
University, Sapporo, Japan
Full list of author information is available at the end of the article
© 2014 Fatema et al.; licensee BioMed Central Ltd. This is an Open Access article distributed under the terms of the Creative
Commons Attribution License ( which permits unrestricted use, distribution, and
reproduction in any medium, provided the original work is properly credited. The Creative Commons Public Domain
Dedication waiver ( applies to the data made available in this article,
unless otherwise stated.
Fatema et al. BMC Cancer 2014, 14:692
/>
Background
Over the past few decades, the preferred treatment strategies for squamous cell carcinoma of the head and neck
have gradually shifted from surgery to organ-preservation
approaches such as radiotherapy with or without chemotherapy. Tumor hypoxia and accelerated tumor proliferation are important factors that adversely affect the efficacy
of radiotherapy [1-3]. Accordingly, in recent radiotherapy
strategies, dose escalation and altered fractionation schedules are widely applied to prevent tumor hypoxia and accelerated tumor proliferation [2]. Head and neck tumors
are highly hypoxic in nature and also show accelerated
proliferation of clonogenic tumor cells during the course
of treatment, which hinders the efficacy of radiotherapy
and leads to locoregional treatment failure [4,5]. Particularly in the case of moderately or poorly radiosensitive
cancers, how they respond to radiotherapy remains a
clinical dilemma for medical professionals. Sometimes
there is no good outcome even after an entire session of
radiotherapy.
Better understanding of the tumor microenvironment
such as the tumor hypoxic state and proliferative activity
allows a better optimal individualized plan for radiotherapy (such as dose escalation or altered fractionation
schedule). For this purpose, numerous immunohistochemical or immunofluorescence microscopy techniques
have been established. However, biopsy or excised tissue
samples are required for all these techniques, and collection of such samples is invasive and prone to sampling
error. Recently, the exploration of tumor hypoxic and
proliferative states has shifted to diagnostic imaging
owing to the rapidly developing field of molecular imaging. Specific biomarker probes can be administered
and visualized in vivo with the aid of functional imaging
modalities such as PET. 18F-Fluoromisonidazole (FMISO)
and 18F-fluorothymidine (FLT) are widely used for noninvasive imaging of tumor hypoxia and tumor proliferation,
respectively [6-13]. FMISO is reduced and trapped in hypoxic cells, and reflects tumor hypoxia. The proliferation
marker FLT reflects thymidine kinase 1 (TK1) activity,
which is extremely sensitive to ionizing radiation, and
changes in FLT uptake level directly reflect the biological
effect of radiation therapy [14,15].
Intratumoral hypoxia or proliferative activity following
radiotherapy was evaluated in several studies using
FMISO or FLT [7-13]. There have been no studies, however, in which the dynamic changes in intratumoral hypoxic state and proliferative activity after single-dose
radiotherapy were simultaneously evaluated using the
dual tracers of FMISO and FLT. Such investigations may
provide important information for a better understanding of tumor biology after radiotherapy and for radiotherapy planning, including dose escalation and altered
fractionation schedules, particularly in moderately or
Page 2 of 9
poorly radiosensitive head and neck carcinoma. Thus, in
this study, we simultaneously evaluated the dynamic
changes in intratumoral hypoxic and proliferative states
using FMISO and FLT, and further verified the results
by immunohistochemical staining of pimonidazole and
Ki-67 after a single dose of radiation of human head and
neck cancer xenografts using a moderately radiosensitive
cancer cell line, FaDu.
Methods
Radiopharmaceuticals
18
F-FMISO was obtained from the Hokkaido University
Hospital Cyclotron Facility, which was synthesized as
previously described [16-18]. [Methyl-3H (N)]-3′-fluoro
3′-deoxythymidine (3H-FLT) (specific activity, 74–370
GBq/mmol) was purchased from Moravek Biochemicals
Inc., CA.
Xenograft model and irradiation
All experimental protocols were approved by the Laboratory Animal Care and Use Committee of Hokkaido
University (approval number 13–0057) and were performed according to the Guidelines for Animal Experiments at the Graduate School of Medicine, Hokkaido
University. Nine-week-old male BALB/c athymic nude
mice (supplied by Japan SLC, Inc., Hamamatsu, Japan)
were used in all experiments. A human head and neck
cancer xenograft model was established in mice using
the human head and neck squamous cell carcinoma cell
line FaDu. FaDu cells (5 × 10⁶ cells/0.1 ml) were inoculated subcutaneously into the right flank of each mouse,
as previously described [12].
When the tumors reached 12–14 mm in diameter,
the mice were randomly assigned to three groups: one
non-radiation-treated control group (Control) and two
radiation-treated groups at 10 and 20 Gy (Treat-10 Gy
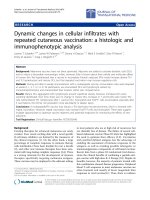
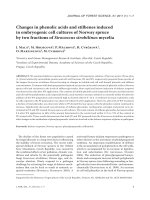
and Treat-20 Gy) (n = 19 for each group) (Figure 1).
Data were collected at four time points for each group
(6, 24, and 48 hrs, and 7 days from irradiation to killing; n = 5 for the time points of 6, 24, and 48 hrs and
n = 4 for the time points of 7 days). A tumor growth curve
was derived from the animals assigned to day 7 in each
group. Tumor size was measured every day from the start
of the radiation treatment and tumor volume was calculated using the following formula: π/6 × largest diameter ×
(smallest diameter)2.
In the radiation-treated groups, tumors were irradiated
at a single dose of 10 or 20 Gy using an X-ray generator
(MBR- 1520R-3; Hitachi, Tokyo, Japan) at a dose rate of
1.69 Gy/min, as previously described [12].
Dual tracer (18F-FMISO and 3H-FLT) ARG study
Two hours after 18F-FMISO (18.5 MBq) injection, the mice
were intravenously injected with 3H-FLT (0.185 MBq) and
Fatema et al. BMC Cancer 2014, 14:692
/>
Page 3 of 9
reference to the H&E sections. 18F-FMISO or 3H-FLT
radioactivity in each ROI was separately recorded and
calculated as percentage injected dose per gram (%ID/g)
and normalized with body weight [(%ID/g) × kg], as previously described [12,20,21].
Immunohistochemical staining
Figure 1 Experimental protocol of this study.
pimonidazole (a hypoxia marker) (60 mg/kg body weight).
Two hours after 3H-FLT and pimonidazole injections,
these mice were sacrificed and the tumors were excised.
The excised tumors were then embedded in Tissue-Tek
medium (Sakura Finetechnical Co., Ltd., Tokyo, Japan)
with a calf muscle section and frozen in isopentane/dry
ice. Serial cross sections of 10 μm (for autoradiographic
exposure) or 5 μm (immunohistochemical staining) thickness were immediately cut and thaw-mounted on a glass
slide.
The distribution of each tracer in the tumor tissue was
determined by dual-tracer ARG [19]. Briefly, the same
cryostat cross sections were exposed twice to phosphor
imaging plates (Fuji Imaging Plate BAS-SR 2025 for 18F
and BAS-TR 2025 for 3H, Fuji Photo Film Co., Ltd.,
Japan) together with a set of calibrated standards [20].
The first autoradiographic exposure was performed overnight to detect the radioactivity of 18F-FMISO. To allow
the decay of 18F activity, the second exposure was started
1 week later to visualize the distribution of 3H-FLT. The
second exposure required 5 weeks. After each exposure,
the imaging plates were scanned using a Fuji Bio-imaging
Analyzer FLA-7000 (Fuji Photo Film Co., Ltd., Minato-ku,
Tokyo, Japan), and the images obtained were analyzed
using image analysis software Multi Gauge (Ver. 3.0, Fuji
Photo Film Co., Ltd., Japan).
For the quantitative evaluation of 18F-FMISO and 3HFLT radioactivities, ROIs were placed to cover the entire
tumor tissue and muscles on each ARG image with
Frozen sections of the tumor were stained for pimonidazole (a hypoxia marker) and Ki-67 (a proliferation
marker) to assess hypoxia and proliferation, respectively.
The immunohistochemical staining of pimonidazole
(HypoxyprobeTM-1, HIP Inc.) was performed using a
monoclonal antibody (rabbit IgG1, HIP Inc.) and that
of Ki-67 was performed using a monoclonal rabbit antihuman Ki-67 antibody (clone SP6) (Thermo Fisher Scientific, CA, USA). For the quantitative analysis of hypoxia,
the percentage of the area positively stained by the antipimonidazole antibody in the entire tumor cross section
was calculated as the hypoxic fraction (%pimonidazolepositive area) using Image J. For the quantitative analysis
of tumor proliferation, the Ki-67 labeling index, that is,
the percentage of the number of Ki-67-positive nuclei to
the total number of nuclei, was used. The number of Ki67-positive nuclei and the total number of nuclei were
counted under a microscope field (x400 magnification,
0.644 mm2 per field) using Image J. H&E staining was also
performed.
Statistical analyses
All statistical analyses were performed using Stat View
version 5.0 (SAS Institute, Inc.). All values are expressed
as mean ± SD (standard deviation). One-factor repeated
measures analysis of variance (ANOVA) was carried out
to compare tumor volume among the non-radiationtreated control and radiation-treated (10 and 20 Gy)
groups. Two-way factorial ANOVA was performed to
compare intratumoral 18F-FMISO level, intratumoral
3
H-FLT uptake level, hypoxic fraction and percentage of
Ki-67 labeling index with time among the three groups.
One-way ANOVA followed by a Bonferroni post-hoc
test was used to assess the significance of difference
among the three groups at each time point and among
the time points in each group for tumor volume and
intratumoral 3H-FLT uptake level. Linear regression
analysis was performed to determine the correlation
between the tracer uptake levels of 18F-FMISO and
3
H-FLT. A p value of < 0.05 was considered statistically
significant.
Results
Tumor volume change
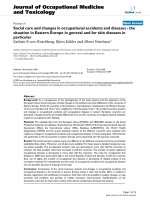
The changes in tumor volume are shown in Figure 2. In
the non-radiation-treated control group, tumor volume
increased with time. Compared with the control group,
Fatema et al. BMC Cancer 2014, 14:692
/>
Figure 2 Growth curves of tumors in non-radiation-treated
control and 10- and 20-Gy radiation-treated mice. Data are
expressed as mean ± SD. *p < 0.01 for both Control vs Treat-10 Gy
and Control vs Treat-20 Gy.
the tumor growth was significantly suppressed in mice
treated with 10 and 20 Gy radiation, but the tumor volume in these mice gradually increased with time. A
significant difference in tumor volume was observed
between the non-radiation-treated control and the
radiation-treated groups on day 7 (p < 0.01 for both
Control vs Treat-10 Gy and Control vs Treat-20 Gy),
whereas no statistically significant difference was observed between the two radiation-treated groups. No significant differences in tumor volume were noted among
the three groups until day 6.
Visual and quantitative analysis of
ARG image
18
F-FMISO and 3H-FLT
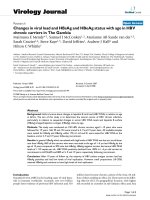
Figure 3 shows the representative merged images of 18FFMISO and 3H-FLT ARG. In the non-radiation-treated
control group, 18F-FMISO was distributed mostly in the
central part of the tumor tissue at all time points. The
10- and 20-Gy-radiation-treated groups also showed a
similar 18F-FMISO distribution pattern to the control
group (Figure 3). On the other hand, 3H-FLT was distributed mostly in the peripheral part of the tumor tissue
in both the non-radiation-treated control and radiationtreated groups, and 3H-FLT uptake level was low at
6 hrs compared with the control group, and then gradually increased with time, 24 and 48 hrs, and day 7 after
10 and 20 Gy radiation treatment (Figure 3).
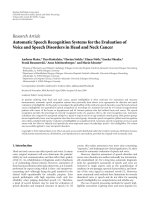
Figure 4 shows the quantitative analysis of intratumoral 18F-FMISO and 3H-FLT uptake level and their
Page 4 of 9
Figure 3 Representative merged images of 18F-FMISO and
3
H-FLT ARG. Red represents 18F-FMISO distribution and green
represents 3H-FLT distribution. The dotted line represents the outline
of muscle tissue.
correlation. In the non-radiation-treated control group,
the 18F-FMISO level slightly increased with time, but the
differences were not significant. No significant differences were observed among the non-radiation-treated
control group and the radiation-treated groups at any
time points. The 18F-FMISO levels in the tumors were
0.06 ± 0.03, 0.05 ± 0.01, and 0.04 ± 0.04 [(%ID/g) × kg] at
6 hrs, 0.06 ± 0.01, 0.06 ± 0.01, and 0.06 ± 0.025 [(%ID/g) ×
kg] at 24 hrs, 0.07 ± 0.02, 0.07 ± 0.01, and 0.07 ± 0.02
[(%ID/g) × kg] at 48 hrs, and 0.08 ± 0.02, 0.07 ± 0.01, and
0.06 ± 0.01 [(%ID/g) × kg] on day 7 in the non-radiationtreated control and the 10- and 20-Gy-radiation-treated
groups, respectively (Figure 4A). On the other hand,
intratumoral 3H-FLT uptake level significantly decreased
to 59 and 45% (p < 0.0001) at 6 hrs in the 10- and 20Gy-radiation-treated groups compared with the nonradiation-treated control group. Thereafter, intratumoral
3
H-FLT uptake level gradually increased with time in both
the radiation-treated groups, and the 3H-FLT uptake levels
on day 7 were significantly higher than those at 6 hrs in
the corresponding radiation-treated groups. The intratumoral 3H-FLT uptake levels were 64 and 50% at 24 hrs
(p < 0.01 for both), 64 and 59% at 48 hrs (p < 0.01 for
both), and 81 and 81% on day 7 (p = NS for both) in the
mice treated at 10 and 20 Gy, respectively, compared with
the non-radiation-treated control mice (Figure 4B). The
intratumoral 3H-FLT uptake levels in the tumors were
5.11 ± 0.62, 3.06 ± 0.42, and 2.34 ± 0.52 [(%ID/g) × kg] at
6 hrs, 5.72 ± 0.90, 3.70 ± 0.88, and 2.86 ± 0.42 [(%ID/g) ×
kg] at 24 hrs, 6.56 ± 1.63, 4.22 ± 0.53, and 3.84 ± 0.94
[(%ID/g) × kg] at 48 hrs, and 6.11 ± 0.86, 5.08 ± 0.95, and
4.99 ± 1.48 [(%ID/g) × kg] on day 7 in the non-radiation-
Fatema et al. BMC Cancer 2014, 14:692
/>
Page 5 of 9
(A)
(C)
(B)
Figure 4 Quantitative analysis of intratumoral (A) 18F-FMISO and (B) 3H-FLT uptake levels by ARG and (C) regression analysis of the
uptake levels of 18F-FMISO and 3H-FLT. Data are expressed as mean ± SD. *p < 0.01 and **p < 0.0001 for both Control vs Treat-10 Gy and
Control vs Treat-20 Gy. †p < 0.001, 6 hrs vs day 7 for each group radiation-treated with 10 and 20 Gy.
treated control and the 10- and 20-Gy-radiation-treated
groups, respectively (Figure 4B). The relationship between 18F-FMISO and 3H-FLT uptake levels is shown in
Figure 4C. No significant correlation was observed between the two tracer distributions (r = 0.081, p = 0.54).
Immunohistochemical staining
Representative images and the quantitative analysis of
hypoxia (%pimonidazole-positive cells) by pimonidazole
(A)
IHC are shown in Figure 5. The pimonidazole-positive
hypoxic areas were visually similar in both the nonradiation-treated control and radiation-treated groups
(Figure 5A). The hypoxic fractions in tumors were 12.0 ±
2.6, 11.6 ± 2.7, and 9.8 ± 1.4% at 6 hrs, 12.1 ± 1.8, 12.3 ±
1.8, and 11.6 ± 0.77% at 24 hrs, 10.07 ± 3.0, 11.49 ± 3.0,
and 10.65 ± 2.1% at 48 hrs, and 10.8 ± 3.6, 9.23 ± 0.86, and
10.46 ± 2.6% on day 7 in the non-radiation-treated control
and the 10- and 20-Gy radiation-treated groups, respectively
(B)
Figure 5 Microscopy images and quantitative analysis of hypoxia. (A) Microscopy images and (B) quantitative analysis of hypoxia.
(A) Representative images of pimonidazole staining (brown staining in pimonidazole-positive cells). (B) Mean hypoxic fraction ± SD.
Fatema et al. BMC Cancer 2014, 14:692
/>
(Figure 5B). No significant differences were observed in
the percentage of pimonidazole-positive cells among the
three groups (F = 0.36; p = 0.69) at various time points
(F = 1.43; p = 0.24).
Figure 6 shows the representative images and the
quantitative evaluation of Ki-67 labeling index by IHC.
No significant differences were observed in the percentage of Ki-67 labeling index with time and among the
three groups (Figure 6A). The Ki-67 labeling indices in
tumor tissues were 60.7 ± 10.8, 60.3 ± 13.4, and 59.1 ±
19.4% at 6 hrs, 57.7 ± 12.3, 54.8 ± 10.9, and 55.5 ± 16.2%
at 24 hrs, 58.2 ± 23.1, 58.7 ± 14.6, and 54.2 ± 14.3% at
48 hrs, and 63.0 ± 20.4, 60.6 ± 15.6, and 59.3 ± 11.9% on
day 7 in the non-radiation-treated control and the 10- and
20-Gy radiation-treated groups, respectively (Figure 6B).
Discussion
The major findings of this dual-tracer study are as follows. Intratumoral 18F-FMISO level did not show any
significant dynamic changes with time after single-dose
radiotherapy among the non-radiation-treated control
and radiation-treated groups. On the other hand, intratumoral 3H-FLT uptake level significantly decreased at
6 hrs and then gradually increased with time in the
radiation-treated groups (Figures 3, 4A, B). In the visual
analysis of intratumoral 18F-FMISO and 3H-FLT ARG
images, 18F-FMISO was distributed mostly in the central
part of the tumor tissue, whereas 3H-FLT was distributed in the peripheral part of the tumor tissue in both
the non-radiation-treated control and radiation-treated
groups (Figure 3). In the radiation-treated groups, tumor
growth was suppressed compared with that in the nonradiation-treated control group, but tumor volume in
these mice gradually increased with time (Figure 2). The
hypoxia fraction determined by pimonidazole IHC also
showed no significant changes with time after single-
Page 6 of 9
dose radiotherapy among the non-radiation-treated control and radiation-treated groups (Figure 5A, B). The
tumor proliferation marker, Ki-67 labeling index, did not
show significant changes among the non-radiation-treated
control and radiation-treated groups (Figure 6A, B). These
findings indicate that radiation-induced intratumoral hypoxic and proliferative changes differed. These two factors
showed different behaviors following radiotherapy until
7 days in the FaDu xenografts. Radiation-induced lethal/
sublethal cellular damage followed by DNA repair and redistribution [22,23] may underlie the dynamic changes in
proliferation activity, whereas reoxygenation after a singledose radiotherapy did not occur in FaDu xenografts.
Several studies have shown that reoxygenation of tumors occurs 4–10 hrs (early stage) and 1 or 2 days (late
stage) after single-dose radiotherapy [3,24,25]. After
radiotherapy, transient changes caused by cell death are
likely to occur during the oxygenation of surviving cells.
Owing to the increase in oxygen levels and therefore an
increase in radiosensitivity of a subset of tumor cell
population [3,25]. Therefore in our study, first 18FFMISO level was expected to decrease in concert with
the attenuation of tumor hypoxia (%pimonidazole-positive area decrease) following radiotherapy as radiationinduced reoxygenation. Early detection of such changes
may lead to the decrease in radiotherapy dose and total
time in the fractionated radiotherapy schedule, which
can reduce the undesirable side effects of radiotherapy.
However, our data showed that tumor volume in the
treated mice did not decrease following radiotherapy,
and the intratumoral hypoxic state also did not change
after the single dose of radiotherapy until 7 days. The
hypoxia marker pimonidazole IHC also showed no significant changes among the non-radiation treated control and radiation-treated groups after radiotherapy.
These findings may indicate that a single-dose 10- or
Figure 6 Microscopy images and quantitative analysis of Ki-67 labeling index. (A) Microscopy images and (B) quantitative analysis of Ki-67
labeling index. (A) Representative images of Ki-67 staining (brown staining in Ki-67 positive cells). (B) Mean Ki-67 labeling index ± SD.
Fatema et al. BMC Cancer 2014, 14:692
/>
20-Gy radiotherapy has no effect on the hypoxic state in
FaDu xenografts. FaDu cells are undifferentiated human
hypopharyngeal squamous cell carcinoma cells that are
characterized by moderate radiosensitivity [26,27]. KastenPisula et al. [28] showed that the apoptotic changes occurring in FaDu cells are very minimal and no changes were
observed after a single dose of radiation over time. Less radiosensitivity and less apoptotic response to radiotherapy
of the FaDu cells would be the possible reasons for the absence of changes in the hypoxia state after a single dose of
radiotherapy until 7 days in our study. Changes in the
tumor hypoxic state depend on many individualized
tumor properties, including the number of cells affected
by reoxygenation, the degree of oxygen increase, and the
timing or progression of this effect during therapy [24,25].
For these aggressive and less radiosensitive cell lines such
as FaDu, further radiotherapy fractionation might induce
reoxygenation. Petersen et al. [29] showed that significant
reoxygenation (hypoxic changes) occurs after 12 days of
fractionated radiotherapy (3 Gy/12f/12d = total 36 Gy) in
FaDu xenografts. Another study [30] also showed that the
mean pO2 (Oxylab pO2 system) significantly increased
after 2 weeks of accelerated fractionated radiotherapy
(total dose of 40 Gy). All these results also partially support the findings of our study.
On the other hand, the intratumoral 3H-FLT uptake
level in this FaDu xenograft significantly decreased at an
early time point (6 hrs) and then gradually but significantly increased with time, showing the dynamic proliferative changes as in our previous study [12]. FLT is a
substrate of TK1, and FLT uptake positively correlates
with cell growth and TK1 activity. The rapid decrease in
FLT uptake level observed may be due to a rapid decrease in TK1 activity after radiation treatment [11,14].
After radiotherapy, the strategy to deal with damaged
DNA can be divided in to three components in eukaryotes: recognition of damaged DNA; a period of damage
assessment; and the implementation of the appropriate
response, namely, DNA repair and redistribution of cells
among the cell-cycle phases or cell death [22]. These
DNA repair and redistribution of cells among the cellcycle phase might lead to cellular proliferation, which
may increase TK1 activity and may be reflected by the
increase in intratumoral FLT uptake level with time after
a single dose of radiotherapy, as we discussed in our previous study [12]. In our study, we found the suppression
of tumor growth after radiation treatment compared
with the non-radiation-treated control group. However,
there were no significant changes in the Ki-67 index
among the non-radiation-treated control and radiationtreated groups in our study. Ki-67 is a nuclear protein
and expressed during the late G1, S, G2, and M phases
of the cell cycle. Radiotherapy causes G2/M phase arrest
and the arrested cells during the cell cycle also contain
Page 7 of 9
Ki-67 even though they are not actively proliferating, as
we discussed in our previous study [12].
Human head and neck tumors showed different hypoxic and proliferative patterns after radiotherapy, even
when they have the same histological feature [31]. Thus,
evaluation of dynamic changes in intratumoral hypoxic
and proliferative states using the dual tracers FMISO
and FLT is important. In our study, we used the less radiosensitive cell line FaDu and found no changes in
intratumoral 18F-FMISO level. On the other hand, the
intratumoral 3H-FLT uptake level significantly decreased
at 6 hrs and then gradually increased with time. These
findings indicate that single-dose 10- or 20-Gy radiotherapy may not affect the hypoxic state but still affect
proliferative activity in this aggressive and less radiosensitive cell line. In our case, further radiotherapy fractionation may cause reoxygenation (decrease in 18F-FMISO
level) and delay the gradual enhancement of proliferation.
In this study, no significant hypoxic changes were found
between 10- and 20-Gy radiation doses. Therefore, further
radiotherapy fractionation (10 Gy or less) without dose escalation will be appropriate for this situation. If no marked
changes occur after further radiotherapy fractionation, an
immediate shift to a combination therapy or surgical procedures would be the treatment of choice. Thus, early
evaluation of dynamic changes in intratumoral hypoxic
and proliferative states by a dual-tracer study may provide important information for a better understanding of
tumor biology after radiotherapy and for radiotherapy
planning including dose escalation and altered fractionation schedules.
The limitation of our study was that only one tumor
model, i.e., a moderately radiosensitive cancer cell line,
was used to evaluate the dynamic changes in the tumor
microenvironment (intratumoral hypoxic state and proliferative activity) after a single dose of radiation using dual
tracers of 18F-FMISO and 3H-FLT. Various cancer cell
lines, such as radiosensitive and radioresistant cancer cell
lines should be used to confirm our present results.
Conclusions
Our animal model showed no dynamic changes in intratumoral 18F-FMISO level after single-dose radiotherapy.
On the other hand, 3H-FLT uptake level significantly decreased at 6 hrs and then gradually increased with time.
These findings indicate that radiation-induced intratumoral hypoxic and proliferative changes differed and
these two factors show different behaviors until 7 days
in the FaDu xenografts. Thus, concomitant monitoring
of dynamic changes in intratumoral hypoxic states and
proliferative activity may provide important information
for a better understanding of tumor biology after radiotherapy and for radiotherapy planning, including dose
escalation and altered fractionation schedules.
Fatema et al. BMC Cancer 2014, 14:692
/>
Competing interests
This study was supported (in part) by the Creation of Innovation Centers for
Advanced Interdisciplinary Research Areas Program, Ministry of Education,
Culture, Sports, Science and Technology, Japan. This study was also partially
supported by JSPS KAKENHI grant no. 23591742. No other potential conflict
of interest relevant to this article was reported.
Page 8 of 9
11.
12.
Authors’ contribution
CNF drafted the manuscript and performed the experiment, all data analysis,
immunohistochemical staining of pimonidazole and Ki-67. SZ designed the
experiments, performed data analysis and revised the manuscript. YZ and
WY helped in the study design, and also acquired and analyzed data. KN, KY
and YK participated in discussion and data interpretation. NT conceived of
the study and revised the manuscript. YK conceived of the study, performed
data analysis and revised the manuscript. All authors read and approved the
final manuscript.
13.
14.
Acknowledgement
The authors are grateful to the staff of the Department of Nuclear Medicine,
Central Institute of Isotope Science and Department Oral Diagnosis and
Medicine, Hokkaido University.
15.
Author details
1
Department of Tracer Kinetics & Bioanalysis, Graduate School of Medicine,
Hokkaido University, Kita 15, Nishi 7, Kita-ku, Sapporo 060-8638, Japan.
2
Department of Molecular Imaging, Graduate School of Medicine, Hokkaido
University, Sapporo, Japan. 3Department of Nuclear Medicine, Graduate
School of Medicine, Hokkaido University, Sapporo, Japan. 4Department of
Oral Diagnosis and Medicine, Graduate School of Dental Medicine, Hokkaido
University, Sapporo, Japan. 5Department of Integrated Molecular Imaging,
Graduate School of Medicine, Hokkaido University, Sapporo, Japan. 6Central
Institute of Isotope Science, Hokkaido University, Sapporo, Japan.
7
Department of Radiation Medicine, Graduate School of Medicine, Hokkaido
University, Sapporo, Japan.
17.
16.
18.
19.
20.
Received: 19 June 2014 Accepted: 17 September 2014
Published: 22 September 2014
21.
References
1. Argiris A, Karamouzis MV, Raben D, Ferris RL: Head and neck cancer. Lancet
2008, 371:1695–1709.
2. Corry J, Rischin D: Strategies to overcome accelerated repopulation and
hypoxia–what have we learned from clinical trials? Semin Oncol 2004,
31:802–808.
3. Ljungkvist AS, Bussink J, Kaanders JH, Wiedenmann NE, Vlasman R, van der
Kogel AJ: Dynamics of hypoxia, proliferation and apoptosis after
irradiation in a murine tumor model. Radiat Res 2006, 165:326–336.
4. Isa AY, Ward TH, West CM, Slevin NJ, Homer JJ: Hypoxia in head and neck
cancer. Br J Radiol 2006, 79:791–798.
5. Withers HR, Taylor JM, Maciejewski B: The hazard of accelerated tumor
clonogen repopulation during radiotherapy. Acta Oncol 1988, 27:131–146.
6. Rajendran JG, Schwartz DL, O’Sullivan J, Peterson LM, Ng P, Scharnhorst J,
Grierson JR, Krohn KA: Tumor hypoxia imaging with [F-18]
fluoromisonidazole positron emission tomography in head and neck
cancer. Clin Cancer Res 2006, 12:5435–5441.
7. Nagane M, Yasui H, Yamamori T, Zhao S, Kuge Y, Tamaki N, Kameya H,
Nakamura H, Fujii H, Inanami O: Radiation-induced nitric oxide mitigates
tumor hypoxia and radioresistance in a murine SCCVII tumor model.
Biochem Biophys Res Commun 2013, 437:420–425.
8. Narita T, Aoyama H, Hirata K, Onodera S, Shiga T, Kobayashi H, Murata J,
Terasaka S, Tanaka S, Houkin K: Reoxygenation of glioblastoma multiforme
treated with fractionated radiotherapy concomitant with temozolomide:
changes defined by 18F-fluoromisonidazole positron emission
tomography: two case reports. Jpn J Clin Oncol 2012, 42:120–123.
9. Yasuda K, Onimaru R, Okamoto S, Shiga T, Katoh N, Tsuchiya K, Suzuki R,
Takeuchi W, Kuge Y, Tamaki N, Shirato H: [18F] fluoromisonidazole and a
new PET system with semiconductor detectors and a depth of
interaction system for intensity modulated radiation therapy for
nasopharyngeal cancer. Int J Radiat Oncol Biol Phys 2013, 85:142–147.
10. Okamoto S, Shiga T, Yasuda K, Ito YM, Magota K, Kasai K, Kuge Y, Shirato H,
Tamaki N: High reproducibility of tumor hypoxia evaluated by
22.
23.
24.
25.
26.
27.
28.
29.
18
F-fluoromisonidazole PET for head and neck cancer. J Nucl Med 2013,
54:201–207.
Yang YJ, Ryu JS, Kim SY, Oh SJ, Im KC, Lee H, Lee SW, Cho KJ, Cheon GJ,
Moon DH: Use of 3′-deoxy-3′- [18F] fluorothymidine PET to monitor early
responses to radiation therapy in murine SCCVII tumors. Eur J Nucl Med
Mol Imaging 2006, 33:412–419.
Fatema CN, Zhao S, Zhao Y, Murakami M, Yu W, Nishijima K, Tamaki N,
Kitagawa Y, Kuge Y: Monitoring tumor proliferative response to
radiotherapy using 18F-fluorothymidine in human head and neck cancer
xenograft in comparison with Ki-67. Ann Nucl Med 2013, 27:355–362.
Sugiyama M, Sakahara H, Sato K, Harada N, Fukumoto D, Kakiuchi T, Hirano
T, Kohno E, Tsukada H: Evaluation of 3′-deoxy-3′-18F-fluorothymidine for
monitoring tumor response to radiotherapy and photodynamic therapy
in mice. J Nucl Med 2004, 45:1754–1758.
He Q, Skog S, Welander I, Tribukait B: X-irradiation effects on thymidine
kinase (TK): I. TK1 and 2 in normal and malignant cells. Cell Prolif 2002,
35:69–81.
Schwartz JL, Tamura Y, Jordan R, Grierson JR, Krohn KA: Effect of p53
activation on cell growth, thymidine kinase-1 activity, and 30- deoxy-30
fluorothymidine uptake. Nucl Med Biol 2004, 31:419–423.
Tang G, Wang M, Tang X, Gan M, Luo L: Fully automated one-pot
synthesis of [18F]fluoromisonidazole. Nucl Med Biol 2005, 32:553–558.
Hatano T, Zhao S, Zhao Y, Nishijima K, Kuno N, Hanzawa H, Sakamoto T,
Tamaki N, Kuge Y: Biological characteristics of intratumoral [F-18]
fluoromisonidazole distribution in a rodent model of glioma. Int J Oncol
2013, 42:823–830.
Murakami M, Zhao S, Zhao Y, Chowdhury NF, Yu W, Nishijima K, Takiguchi
M, Tamaki N, Kuge Y: Evaluation of changes in the tumor
microenvironment after sorafenib therapy by sequential histology and
18
F-fluoromisonidazole hypoxia imaging in renal cell carcinoma. Int J
Oncol 2012, 41:1593–1600.
Kasprzak KS, Dencker L, Larsson BS: Isotopic and nuclear analytical
techniques in biological systems: a critical survey. Pure Appl Chem 1991,
63:1269–1306.
Brown RS, Leung JY, Fisher SJ, Frey KA, Ethier SP, Wahl RL: Intratumoral
distribution of tritiated fluorodeoxyglucose in breast carcinoma. I. Are
inflammatory cells important? J Nucl Med 1995, 36:1854–1861.
Zhao S, Kuge Y, Mochizuki T, Takahashi T, Nakada K, Sato M, Takei T,
Tamaki N: Biologic correlates of intratumoral heterogeneity in
18
F-FDG distribution with regional expression of glucose transporters
and hexokinase-II in experimental tumor. J Nucl Med 2005,
46:675–682.
Wong CS: Experimental radiotherapy. In The Basic Science Of Oncology.
Edited by Tannock IF, Hill RP. New York, NY: McGraw-Hill; 1998:322–34926.
Wither HR: Radiation biology and treatment option in radiation
oncology. Cancer Res 1999, 59(Suppl):1676p–1684p.
Bussink J, Kaanders JH, Rijken PF, Raleigh JA, van der Kogel AJ: Changes in
blood perfusion and hypoxia after irradiation of a human squamous cell
carcinoma xenograft tumor line. Radiat Res 2000, 153:398–404.
Crokart N, Jordan BF, Baudelet C, Ansiaux R, Sonveaux P, Grégoire V,
Beghein N, DeWever J, Bouzin C, Feron O, Gallez B: Early reoxygenation in
tumors after irradiation: determining factors and consequences for
radiotherapy regimens using daily multiple fractions. Int J Radiat Oncol
Biol Phys 2005, 63:901–910.
Suit HD, Zietman A, Tomkinson K, Ramsay J, Gerweck L, Sedlacek R:
Radiation response of xenografts of a human squamous cell carcinoma
and a glioblastoma multiforme: a progress report. Int J Radiat Oncol Biol
Phys 1990, 18:365–373.
Toulany M, Dittmann K, Krüger M, Baumann M, Rodemann HP:
Radioresistance of K-Ras mutated human tumor cells is mediated
through EGFR-dependent activation of PI3K-AKT pathway. Radiother
Oncol 2005, 76:143–150.
Kasten-Pisula U, Menegakis A, Brammer I, Borgmann K, Mansour WY,
Degenhardt S, Krause M, Schreiber A, Dahm-Daphi J, Petersen C, Dikomey E,
Baumann M: The extreme radiosensitivity of the squamous cell
carcinoma SKX is due to a defect in double-strand break repair. Radiother
Oncol 2009, 90:257–264.
Petersen C, Eicheler W, Frömmel A, Krause M, Balschukat S, Zips D,
Baumann M: Proliferation and micromilieu during fractionated irradiation
of human FaDu squamous cell carcinoma in nude mice. Int J Radiat Biol
2003, 79:469–477.
Fatema et al. BMC Cancer 2014, 14:692
/>
Page 9 of 9
30. Harriss W, Bezak E, Yeoh E, Hermans M: Measurement of
reoxygenation during fractionated radiotherapy in head and neck
squamous cell carcinoma xenografts. Australas Phys Eng Sci Med 2010,
33:251–263.
31. Ljungkvist AS, Bussink J, Rijken PF, Kaanders JH, van der Kogel AJ,
Denekamp J: Vascular architecture, hypoxia, and proliferation in firstgeneration xenografts of human head-and-neck squamous cell
carcinomas. Int J Radiat Oncol Biol Phys 2002, 54:215–228.
doi:10.1186/1471-2407-14-692
Cite this article as: Fatema et al.: Dual tracer evaluation of dynamic
changes in intratumoral hypoxic and proliferative states after
radiotherapy of human head and neck cancer xenografts using
radiolabeled FMISO and FLT. BMC Cancer 2014 14:692.
Submit your next manuscript to BioMed Central
and take full advantage of:
• Convenient online submission
• Thorough peer review
• No space constraints or color figure charges
• Immediate publication on acceptance
• Inclusion in PubMed, CAS, Scopus and Google Scholar
• Research which is freely available for redistribution
Submit your manuscript at
www.biomedcentral.com/submit