Proteomic study reveals a functional network of cancer markers in the G1-Stage of the breast cancer cell cycle
Bạn đang xem bản rút gọn của tài liệu. Xem và tải ngay bản đầy đủ của tài liệu tại đây (1.62 MB, 17 trang )
Tenga and Lazar BMC Cancer 2014, 14:710
/>
RESEARCH ARTICLE
Open Access
Proteomic study reveals a functional network of
cancer markers in the G1-Stage of the breast
cancer cell cycle
Milagros J Tenga and Iulia M Lazar*
Abstract
Background: Cancer cells are characterized by a deregulated cell cycle that facilitates abnormal proliferation by
allowing cells to by-pass tightly regulated molecular checkpoints such as the G1/S restriction point. To facilitate
early diagnosis and the identification of new drug targets, current research efforts focus on studies that could lead
to the development of protein panels that collectively can improve the effectiveness of our response to the
detection of a life-threatening disease.
Methods: Estrogen-responsive MCF-7 cells were cultured and arrested by serum deprivation in the G1-stage of the
cell cycle, and fractionated into nuclear and cytoplasmic fractions. The protein extracts were trypsinized and
analyzed by liquid chromatography - mass spectrometry (MS), and the data were interpreted with the Thermo
Electron Bioworks software. Biological characterization of the data, selection of cancer markers, and identification of
protein interaction networks was accomplished with a combination of bioinformatics tools provided by GoMiner,
DAVID and STRING.
Results: The objective of this work was to explore via MS proteomic profiling technologies and bioinformatics data
mining whether randomly identified cancer markers can be associated with the G1-stage of the cell cycle, i.e., the
stage in which cancer cells differ most from normal cells, and whether any functional networks can be identified
between these markers and placed in the broader context of cell regulatory pathways. The study enabled the
identification of over 2000 proteins and 153 cancer markers, and revealed for the first time that the G1-stage of the
cell cycle is not only a rich source of cancer markers, but also a host to an intricate network of functional
relationships within the majority of these markers. Three major clusters of interacting proteins emerged:
(a) signaling, (b) DNA repair, and (c) oxidative phosphorylation.
Conclusions: The identification of cancer marker regulatory components that act not alone, but within networks,
represents an invaluable resource for elucidating the moxlecular mechanisms that govern the uncontrolled
proliferation of cancer cells, as well as for catalyzing the development of protein panels with biomarker and drug
target potential, screening tests with improved sensitivity and specificity, and novel cancer therapies aimed at
pursuing multiple drug targets.
Keywords: Cell cycle, Cancer markers, Proteomics, Mass spectrometry
* Correspondence:
Department of Biological Sciences, Virginia Polytechnic Institute and State
University, 1981 Kraft Drive, Blacksburg, VA 24061, USA
© 2014 Tenga and Lazar; licensee BioMed Central Ltd. This is an Open Access article distributed under the terms of the
Creative Commons Attribution License ( which permits unrestricted use,
distribution, and reproduction in any medium, provided the original work is properly credited. The Creative Commons Public
Domain Dedication waiver ( applies to the data made available in this
article, unless otherwise stated.
Tenga and Lazar BMC Cancer 2014, 14:710
/>
Background
Howard and Pelc described four consecutive phases of
the cell cycle: G1, S, G2 and M [1]. Each phase needs to
be completed before the next one can proceed: the G1phase is a period of growth in preparation for replication, the S-phase a period in which the DNA content is
duplicated, the G2-phase a period of growth in preparation for mitosis, and the M-phase a period in which the
cell divides into two identical daughter cells. Multiple
regulatory events, termed checkpoints, verify whether
certain cellular processes have occurred properly before
allowing the cells to proceed from one phase to another
[2-6]. For example, DNA damage checkpoints at the G1/
S and G2/M transition boundaries, and spindle checkpoints during the M-phase, have been recognized. These
checkpoints allow either for DNA repair, or correct
chromosome alignment on the mitotic spindle, respectively, before the next steps of the cell cycle can proceed.
In 1978, Pardee described the G1/S restriction point
(R-point) as an essential regulatory event in the G1phase [3]. The period before the R-point is uniquely sensitive to growth factor stimulation, and in the absence of
mitogenic signaling, normal cells exit the cell cycle and
enter a reversible dormant/quiescent state termed G0.
Alternatively, in the presence of major perturbations in
the cell cycle regulatory machinery, such as DNA damage, normal cells attempt to repair such damage, or in
the case of failure, commit apoptosis. Unlike normal
cells, cancer cells evolved the ability to evade the restriction point and continue through the cell cycle even if
DNA damage is detected. After the R-point, both normal
and cancer cells are unaffected by the removal of growth
factors or other deregulatory events, and enter the Sphase, committing to a round of cell division. Therefore,
the R-point emerges as the most critical point in cell
cycle control. Key to its regulation is the phosphorylation of the retinoblastoma protein (pRb or RB1) by active cyclin D-CDK4/6 and cyclin E-CDK2 complexes in
early and late G1, respectively, an event that results in
the release of E2F transcription factors that signal the
cell to continue into the S-phase, replicate and proliferate. Hundreds of E2F target genes that are involved in
DNA replication and cell cycle signaling, as well as DNA
damage repair, programmed cell death, development and
cell differentiation, have been identified. Traditional molecular biology and biochemistry approaches have greatly
contributed to understanding breast cancer cell cycle
regulation. However, the introduction of high-throughput
genomic and proteomic methods, and the escalating development of novel bioinformatics tools, have revolutionized cancer research. Large lists of genes and proteins
involved in important biological processes are generated
with the aim of providing a comprehensive picture of all
concurring events in a cell, the challenge continuing to
Page 2 of 17
rest with the interpretation of such voluminous data. As
the mechanisms used by cancer cells to escape the Rrestriction point continue to remain unclear, the objective
of this study was to use mass spectrometry technologies
to generate a comprehensive map of proteins that are
expressed in the critical G1-stage of the cell cycle in a representative model system of ER + breast cancer such as
MCF-7, and make use of bioinformatics tools to explore:
(a) whether cancer marker proteins reported by previous
studies (rather unrelated) can be associated with this stage
of the cell cycle, (b) whether a particular subcellular
localization is characteristic for these proteins, and (c)
whether these markers form regulatory networks that promote cell proliferation and can be placed in a broader context of cancer-relevant functional roles to advance a panel
with biomarker and drug target potential.
Methods
Cell processing
MCF-7 cells (ATCC, Manassas, VA) were grown in
EMEM with 10% FBS and 10 μg/mL bovine insulin, in
an incubator at 37°C with 5% CO2 [7,8]. The cells were
arrested in the G1-phase by serum-deprivation for 48 h,
in a medium consisting of DMEM and 4 mM L-glutamine, harvested, separated into nuclear and cytoplasmic
fractions (Cell Lytic™ NuCLEAR™ extraction kit, Sigma, St.
Louis, MO), digested with trypsin (Promega Corporation
(Madison, WI) at 37°C for 24 h (50:1 substrate:enzyme
ratio), and analyzed by nano-liquid chromatography (LC)MS/MS with a linear trap quadrupole (LTQ/Thermo Electron Corporation, San Jose, CA) mass spectrometer. FACS
analysis was performed with a Beckman Coulter EPICS
XL-MCL analyzer (Brea, CA, USA). The protein content
was measured by the Bradford assay on a SmartSpec Plus
spectrophotometer (Bio-Rad, Hercules, CA). The sample
analyzed by MS contained 2 μg/μL MCF-7 proteins. LC
separations were performed with an Agilent 1100 LC system (Palo Alto, CA) and in-house prepared nanoseparation columns (100 μm i.d. x 12 cm) packed with
5 μm Zorbax SB-C18 particles. Common reagents were
purchased from Sigma, cell culture media from ATCC
and Invitrogen (Carlsbad, CA), and HPLC-solvents from
Fisher Scientific (Fair Lawn, NJ). Sample preparation and
LC-MS/MS analysis protocols were described in detail in
previous manuscripts [7,8].
Data processing
A minimally redundant Homo sapiens protein database
from SwissProt (2008/40,009 entries) and the Bioworks
3.3 software (Thermo Electron) were used for protein
identifications. Conditions for peptide selection included: only fully tryptic fragments with maximum two
missed cleavages, no posttranslational modifications,
peptide and fragment ion tolerances set at 2 amu and
Tenga and Lazar BMC Cancer 2014, 14:710
/>
1 amu, respectively,% fragment ion coverage >30% (from
any combination of theoretical b, y and a ions), all peptides matched to unique proteins in the database, and
Sequest Xcorr vs. charge state parameters set at 1.9, 2.2
and 3.8 for singly, doubly and triply charged peptides,
respectively. At the protein level, the Bioworks p-score
threshold was set at ≤0.001. Proteins matched by one
unique peptide were considered only when could be
identified in at least two biological states or replicates. A
few proteins matched by a single peptide count were
allowed in the analysis, due to their relevance, but the
associated SwissProt IDs should be treated in such cases
with prudence due to the possibility of existing protein
isoforms that share the same peptide. The peptide pvalues were for these cases < 0.001. False discovery rates
(FDR) were determined by searching the raw data
against a forward-reversed protein sequence database.
FDRs were <3% and <1% at the protein and peptide
levels, respectively. Specific parameter settings for the
use of bioinformatics tools were: GoMiner included all
evidence codes; STRING parameters were set to high
confidence, ≤10 interactors, network depth 1 and all active prediction methods; the DAVID enrichment p-score
threshold was 1.3 (shown as -log transformed value),
with a Homo sapiens background and classification stringency set to medium.
Results and discussion
Sample and data analysis
While the key events of the cell cycle control take place
in the nucleus, a number of relevant signaling pathways
activated by mitogenic stimuli proceed through the cytoplasm, prior to impacting the nuclear sequence of events.
Furthermore, many proteins are shuttled between the cytoplasm and nucleus as a means of functional activation/
Page 3 of 17
deactivation. To increase the number of identifiable proteins and generate a comprehensive map of the biological
processes that unfold in the G1-stage of the cell cycle, the
MCF-7 cells were separated into nuclear and cytoplasmic
fractions. Three biological replicates were prepared to
enable a confident selection of identifiable proteins, and
five LC-MS/MS technical replicates were performed to
maximize the number of identifiable proteins and the
number of spectral counts per protein [7,8]. A total of six
samples were generated from the two cell states [i.e., G1phase nuclear (G1N1, G1N2 and G1N3) and G1-phase
cytoplasmic (G1C1, G1C2 and G1C3)] and a total of 30
LC-MS/MS analyses were performed. Reproducibility was
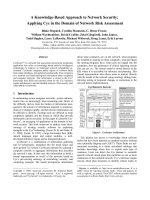
assessed at every step of the analysis. The cell cycle distribution in each cell culture was evaluated by flow cytometry
(Figure 1). The arrested cells were found primarily in G1
(~81%), and only a small proportion in S (~10%) and G2
(~7%), respectively. A bar graph illustrating the trend in
protein identifications is provided in Figure 2. Each biological replicate displays cumulative protein identifications
in 5 LC-MS/MS analyses, and new protein identifications
relative to the previous replicates. After MS data processing and filtering, in-house developed Perl-scripts were used
for aligning protein and peptide spectral count data [9]. A
total of 2375 proteins were identified, of which, 2000 with
two or more spectral counts. The average number of identified proteins and matching counts in each of the 6 cell
states was 1176 (CV = 7.5%) and 4030 (CV = 8.9%), respectively, with a total of 1515 proteins in the combined
nuclear fractions and 1572 in the combined cytoplasmic
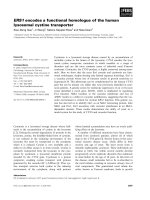
fractions. The correlation coefficient of protein identifications based on spectral count data in any two biological
replicates of a cell state reached values as high as R = 0.96,
as shown in a representative comparison involving the
G1N1 and G1N2 fractions containing a total of 1239
Figure 1 FACS analysis of MCF-7 cells. (A) Bar graph illustrating the reproducibility of cell cycle arrest in G1 by serum deprivation for 48 hours
in three biological replicate cultures; (B) FACS diagram of G1-stage MCF-7 cells.
Tenga and Lazar BMC Cancer 2014, 14:710
/>
# Proteins identified
Page 4 of 17
Biological states and replicates
Figure 2 Reproducibility of protein identifications in three biological replicates of G1N/G1C MCF-7 cells.
proteins (Figure 3A). As expected, however, due to biological and technical variability, the effective overlap of protein IDs between all three replicates did not exceed ~75%
(Figure 3B). Nevertheless, the above described workflow enabled the identification of a sufficient number of proteins
for extracting meaningful biological information despite the
lack of a high-end mass spectrometer platform for performing the experiments. The ExPASy Proteomics Server [10],
GoMiner [11], DAVID Bioinformatics Resources [12,13],
STRING functional protein association networks 8.3 [14]
and the GeneCards [15] bioinformatics tools were used for
the functional interpretation of the data. GoMiner analysis
revealed that the nuclear cell fractions comprised 57–62%
and 59–64% proteins with nuclear and cytoplasmic
categorization, respectively. The cytoplasmic fractions
comprised primarily cytoplasmic proteins (83–84%), and
only a small fraction of nuclear proteins (32–33%). While
complete separation of the two cell fractions was not experimentally achievable, the nuclear enrichment process resulted in an increase of the nuclear proteins from 15–20%
in a whole cell extract, to >50% in the nuclear-enriched
A
fraction. DAVID functional clustering of the MCF-7 proteins with two or more spectral counts returned over 150
clusters with enrichment scores > 1.3. The large number of
clusters reflects that the dataset is representative of a broad
range of basic biological processes that occur in a cell. The
top scoring clusters included processes related to the biosynthesis and processing of nucleotides, RNA, proteins and
ATP, and to transport, proteasome and metabolism.
Additional file 1 lists the identified proteins, their total
spectral count, and their identification in the nuclear or
cytoplasmic fractions. The overlapping nuclear/cytoplasmic
categories (i.e., ~30%) included proteins with roles in gene
expression/translation/protein biosynthesis, glycolysis, glucose/carbohydrate metabolism, and intracellular transport.
Query for putative cancer markers
Overall, from the list of 2375 proteins, GoMiner/DAVID
categorization returned a considerable number of proteins involved in biological processes representative of
all hallmarks of cancer [6,16] that matched multiple
pathways in the Kegg cancer diagram, i.e., proliferation,
B
Figure 3 Protein overlaps among biological replicates of MCF-7 cells. (A) Scatter plot of protein identifications in two biological replicates of
MCF-7 G1N cells (G1N1 vs. G1N2, total 1239 proteins). (B) Venn diagram of protein overlaps between three biological replicates of MCF-7 G1N cells.
Tenga and Lazar BMC Cancer 2014, 14:710
/>
cell cycle, apoptosis, evasion of apoptosis, failed repair of
genes, insensitivity to growth factors, sustained angiogenesis, and PPAR signaling [17]. The list of 2375 was
queried for the presence of proteins with role in cancer
development or with previously reported biomarker potential. The search in the DAVID disease database
returned a list of 96 proteins associated with cancer, of
which 51 proteins were matched to breast cancer. Table 1
enlists the identified markers and spectral count data,
categorized according to biological processes of relevance to cancer. Additional file 2 enlists supplemental
information such as associated GO biological processes,
GO cellular compartments, GO molecular functions,
Kegg pathways and associated diseases, STRING descriptions, full Sequest report and gene abbreviations.
Table 1 was complemented with a set of 57 G1-stage
proteins with known significance to cell cycle regulation
and cancer [6,12,15], shown as entries in italic, to
amount to a total of 153 protein I.D.s.
Proteins of relevance to cancer, but not identified in
the dataset, were included in the discussion, but were
not included in the generation of lists, figures or the
STRING diagrams. Cancer-relevant proteins were
present in both nuclear (100 proteins) and cytoplasmic
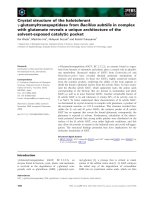
(102 proteins) fractions. Most importantly, a STRING
protein-protein interaction diagram revealed a widespread connectivity between these randomly mapped
cancer proteins, and redundant identification of the
same categories with relevance to cell cycle regulation
and proliferation, suggesting the possibility of a useful
biomarker panel for diagnostic purposes, or of novel
drug candidates that could be targeted synergistically in
cancer therapy (Figure 4). Three main networks emerged
from the list: (1) signaling and cell cycle regulation, (2)
maintenance of genome integrity and DNA repair, and
(3) oxidative phosphorylation, stress, energy production
and metabolism. While the advocated protein panel is
not necessarily specific to MCF-7, and while differential
expression profiling was not the purpose of the present
study, preliminary comparisons to non-tumorigenic G1arrested MCF-10 cells confirmed that roughly two thirds
of the MCF-7 markers changed spectral counts more
than 2-fold, and some even more than 10-fold, when
comparted to MCF-10. The results also confirm that
proteomic analysis of relevant cancerous cell states can
capture in a single experiment protein panels that previously could be identified only by multiple studies, with
various model systems, and using various biochemical/
biological approaches and tools. A subset of proteins displayed either very small, or, essentially, no change in
spectral counts (APEX1, KU70/KU86, LEG3, PARP1,
PGK1, PHB, PRDX2, PRKDC, RAC1, RHOA/RHOC,
SHC1, TBB3/TBB5, TYB4, UCRI, ZO). Future work will
discuss in detail the quantitative comparison of the two
Page 5 of 17
cell lines in both nuclear and cytoplasmic fractions. The
functional relevance of the most prominent protein
clusters that were identified within the three major
categories, as well as their broader impact on cancer cell
proliferation is discussed below.
Cell cycle regulation, proliferation and checkpoint
Among the key cell cycle and proliferation regulators,
the cell cycle and mitotic checkpoint proteins with essential roles in maintaining the integrity of the cell division process (PRKDC, TP53BP1, BUB3, RB1), the
proliferation markers (PCNA, KI-67, 14-3-3 sigma,
PHB), the cyclin dependent kinases CDK2 and CDK1
(CDC2), the alpha and beta catalytic subunits of the protein phosphatase type 1 PP1 (PP1A and PP1B), and a
series of other proteins that control transcription regulation, chromatin maintenance, mitosis, signaling and proteasome degradation, were identified. The phosphorylation
of the RB1 protein by cyclin D1-CDK4/6 complexes plays
an important role in cell advancement through the cell
cycle and the regulation of the R-point: the unphosphorylated form is present in G0, hypophosphorylation correlates to entry into G1, and hyperphosphorylation is
concurrent with passing of the restriction point and completion of the cell cycle. Upon exit from mitosis, the phosphate groups are removed by the Ser/Thr-protein
phosphatase PP1 proteins [6]. Along with the cyclin-CDK
complexes, protein phosphatases play an important role in
cell cycle control through their modulation of signal transduction pathways. Active CDK2 is essential after the Rpoint, in late G1 and S, one of its roles in S being the
phosphorylation of pol-α:primase which promotes DNA
synthesis in S. Active CDK1 is essential in the M-phase,
and also for entry into the S-phase in the absence of
CDK2 [18]. Along with RB1, the guardian of the R-point
gate, BUB3 acts as an M-phase mitotic spindle assembly
checkpoint protein and inhibitor of the anaphase promoting complex (APC) that tags cell cycle proteins with ubiquitin for proteasomal degradation by the 26S proteasome
[15]. TP53BP, through its association with p53, plays a key
role in DNA damage response and transcription regulation, and PRKDC, a Ser/Thr kinase, in association with
XRCC5/6 is a first-line responder and sensor of DNA
damage. In parallel with their essential function in DNA
repair, these proteins have additional roles in cell cycle
regulation [12-15].
Consistent with cancer cell propagation, a number of
known proliferation markers were detectable, i.e., PCNA,
antigen Ki-67, 14-3-3 sigma and prohibitin-PHB [15,19].
PCNA is involved in the control of eukaryotic DNA replication, and displays high expression levels in proliferating
cells. Ki-67 is a marker of proliferation, being detectable in
all stages of the cell cycle, except G0. 14-3-3 sigma is an
adaptor protein which is involved in multiple signaling
Tenga and Lazar BMC Cancer 2014, 14:710
/>
Page 6 of 17
Table 1 Biological categorization of MCF-7 proteins matched in the DAVID disease/cancer database (entries in italic are
not all cancer markers, but were included in the list due to their functional relevance to the marker proteins)
ID
Protein name
MW
Total counts Cancer Breast cancer
Cell cycle/division/check-point/proliferation
O43684
BUB3_HUMAN Mitotic checkpoint protein BUB3
37131.2
78
Cancer
Breast cancer
P06400
RB_HUMAN Retinoblastoma-associated protein
106091.7 15
Cancer
Breast cancer
P12004
PCNA_HUMAN Proliferating cell nuclear antigen
28750.3
17
Cancer
P35232
PHB_HUMAN Prohibitin
29785.9
96
Cancer
Breast cancer
P78527
PRKDC_HUMAN DNA-dependent protein kinase catalytic subunit
468786.9 889
Cancer
Breast cancer
P07437
TBB5_HUMAN Tubulin beta chain
49639
230
Cancer
Breast cancer
Q13509
TBB3_HUMAN Tubulin beta-3 chain
50400.3
127
Cancer
Breast cancer
Q14980
NUMA1_HUMAN Nuclear mitotic apparatus protein 1
238113.2 505
Cancer
Breast cancer
Q12888
TP53B_HUMAN Tumor suppressor p53-binding protein 1
213440.8 7
Cancer
Breast cancer
Q6P1J9
CDC73_HUMAN Parafibromin
60539.2
12
Cancer
P37231
PPARG_HUMAN Peroxisome proliferator-activated receptor gamma
57583.2
5
Cancer
P46013
KI67_HUMAN Antigen KI-67
358471.9 50
P31947
1433S_HUMAN 14-3-3 protein sigma
27756.7
Q8IX12
CCAR1_HUMAN Cell division cycle and apoptosis regulator protein 1
132738.6 72
P06493
CDC2_HUMAN Cell division control protein 2 homolog
34073.9
20
P62136
PP1A_HUMAN Serine/threonine-protein phosphatase PP1-alpha catalytic subunit
37487.8
179
P62140
PP1B_HUMAN Serine/threonine-protein phosphatase PP1-beta catalytic subunit
37162.6
9
Q13616
CUL1_HUMAN Cullin-1
89622
12
Q13547
HDAC1_HUMAN Histone deacetylase 1
55067.8
120
Q92769
HDAC2_HUMAN Histone deacetylase 2
55328.8
31
O14737
PDCD5_HUMAN Programmed cell death protein 5
14276.3
6
Q07812
BAX_HUMAN Apoptosis regulator BAX
21170.8
1
Cancer
Q13153
PAK1_HUMAN Serine/threonine-protein kinase PAK 1
60608.8
4
Cancer
O43464
HTRA2_HUMAN Serine protease HTRA2, mitochondrial precursor
48811
5
O75340
PDCD6_HUMAN Programmed cell death protein 6
21854.8
103
O95831
AIFM1_HUMAN Apoptosis-inducing factor 1, mitochondrial precursor
66859
57
P55957
BID_HUMAN BH3-interacting domain death agonist
21981.1
7
Q13158
FADD_HUMAN Protein FADD
23264.9
10
Q8IX12
CCAR1_HUMAN Cell division cycle and apoptosis regulator protein 1
132738.6 72
Q8N8D1
PDCD7_HUMAN Programmed cell death protein 7
54666.3
4
Q96IZ0
PAWR_HUMAN PRKC apoptosis WT1 regulator protein
36545.5
5
Q9BTC0
DIDO1_HUMAN Death-inducer obliterator 1
243720.8 76
Q9BZZ5
API5_HUMAN Apoptosis inhibitor 5
57525.2
75
Q9NR28
DBLOH_HUMAN Diablo homolog, mitochondrial precursor
27113.7
8
Q9NYF8
BCLF1_HUMAN Bcl-2-associated transcription factor 1
106058.7 80
Q9ULZ3
ASC_HUMAN Apoptosis-associated speck-like protein containing a CARD
21613.3
43
67951
4
Breast cancer
67
Apoptosis
Cancer
DNA Repair
O00255
MEN1_HUMAN Menin
Cancer
P09874
PARP1_HUMAN Poly [ADP-ribose] polymerase 1
113012.4 342
Cancer
P12004
PCNA_HUMAN Proliferating cell nuclear antigen
28750.3
17
Cancer
P12956
KU70_HUMAN ATP-dependent DNA helicase 2 subunit 1
69799.2
398
Cancer
Breast cancer
Breast cancer
Tenga and Lazar BMC Cancer 2014, 14:710
/>
Page 7 of 17
Table 1 Biological categorization of MCF-7 proteins matched in the DAVID disease/cancer database (entries in italic are
not all cancer markers, but were included in the list due to their functional relevance to the marker proteins)
(Continued)
P13010
KU86_HUMAN ATP-dependent DNA helicase 2 subunit 2
82652.4
367
P16455
MGMT_HUMAN Methylated-DNA--protein-cysteine methyltransferase
21632.2
22
Cancer
Breast cancer
P18074
ERCC2_HUMAN TFIIH basal transcription factor complex helicase subunit
86854.3
3
Cancer
Breast cancer
P18887
XRCC1_HUMAN DNA-repair protein XRCC1
69483.1
15
Cancer
Breast cancer
P20585
MSH3_HUMAN DNA mismatch repair protein Msh3
127376.1 5
Cancer
P27695
APEX1_HUMAN DNA-(apurinic or apyrimidinic site) lyase
35532.2
78
Cancer
P29372
3MG_HUMAN DNA-3-methyladenine glycosylase
32842.8
36
Cancer
P35244
RFA3_HUMAN Replication protein A 14 kDa subunit
13559.9
29
Cancer
P43246
MSH2_HUMAN DNA mismatch repair protein Msh2
104676.8 21
Cancer
P46063
RECQ1_HUMAN ATP-dependent DNA helicase Q1
73409.1
P49916
DNL3_HUMAN DNA ligase 3
102625.5 4
Cancer
P52701
MSH6_HUMAN DNA mismatch repair protein MSH6
152688.4 37
Cancer
P54727
RD23B_HUMAN UV excision repair protein RAD23 homolog B
43144.6
Cancer
Breast cancer
P78527
PRKDC_HUMAN DNA-dependent protein kinase catalytic subunit
468786.9 889
Cancer
Breast cancer
Q01831
XPC_HUMAN DNA-repair protein complementing XP-C cells
105915.3 14
Cancer
Breast cancer
Q12888
TP53B_HUMAN Tumor suppressor p53-binding protein 1
213440.8 7
Cancer
Breast cancer
Q92466
DDB2_HUMAN DNA damage-binding protein 2
47833.4
Cancer
Q92878
RAD50_HUMAN DNA repair protein RAD50
153795.8 11
Cancer
Breast cancer
Q9UBB5
MBD2_HUMAN Methyl-CpG-binding domain protein 2
43228
7
Cancer
Breast cancer
Cancer
10
78
5
Q9UHN1 DPOG2_HUMAN DNA polymerase subunit gamma-2, mitochondrial precursor
54876.3
7
P39748
42566.1
114
FEN1_HUMAN Flap endonuclease 1
Cancer
Breast cancer
Breast cancer
Cancer
Breast cancer
Angiogenesis
P13489
RINI_HUMAN Ribonuclease inhibitor
49941.2
17
Cancer
P40763
STAT3_HUMAN Signal transducer and activator of transcription 3
88011.4
13
Cancer
Q16539
MK14_HUMAN Mitogen-activated protein kinase 14
41267.1
2
Q14119
VEZF1_HUMAN Vascular endothelial zinc finger 1
56326.5
9
Q13685
AAMP_HUMAN Angio-associated migratory cell protein
46721.5
1
Q9UQB8
BAIP2_HUMAN Brain-specific angiogenesis inhibitor 1-associated protein
60829.7
5
Q92793
CBP_HUMAN CREB-binding protein
265180.1 2
Migration/invasion/adhesion/metastasis
P07858
CATB_HUMAN Cathepsin B precursor
37796.8
6
Cancer
P15941
MUC1_HUMAN Mucin-1 precursor
121999.6 4
Cancer
P17931
LEG3_HUMAN Galectin-3
26172.1
77
Cancer
P35222
CTNB1_HUMAN Catenin beta-1
85442.3
1
Cancer
P62328
TYB4_HUMAN Thymosin beta-4
5049.5
15
Cancer
Q06124
PTN11_HUMAN Tyrosine-protein phosphatase non-receptor type 11
68393.4
2
Cancer
Q08380
LG3BP_HUMAN Galectin-3-binding protein precursor
65289.4
2
Cancer
Q13153
PAK1_HUMAN Serine/threonine-protein kinase PAK 1
60608.8
4
Cancer
Q13330
MTA1_HUMAN Metastasis-associated protein MTA1
80737.4
13
Cancer
O60716
CTND1_HUMAN Catenin delta-1
108103.3 37
P07339
CATD_HUMAN Cathepsin D precursor
44523.7
105
P07355
ANXA2_HUMAN Annexin A2
38579.8
627
Breast cancer
Tenga and Lazar BMC Cancer 2014, 14:710
/>
Page 8 of 17
Table 1 Biological categorization of MCF-7 proteins matched in the DAVID disease/cancer database (entries in italic are
not all cancer markers, but were included in the list due to their functional relevance to the marker proteins)
(Continued)
P09493
TPM1_HUMAN Tropomyosin alpha-1 chain
32688.7
91
P12814
ACTN1_HUMAN Alpha-actinin-1
102992.7 441
P23528
COF1_HUMAN Cofilin-1
18490.7
P35221
CTNA1_HUMAN Catenin alpha-1
100008.6 100
P35580
MYH10_HUMAN Myosin-10
228796.8 136
P60953
CDC42_HUMAN Cell division control protein 42 homolog precursor
21296.9
3
P61586
RHOA_HUMAN Transforming protein RhoA precursor
21754.1
12
P62258
1433E_HUMAN 14-3-3 protein epsilon
29155.4
136
P63000
RAC1_HUMAN Ras-related C3 botulinum toxin substrate 1 precursor
21436.3
9
Q07157
ZO1_HUMAN Tight junction protein ZO-1
195338.8 32
Q13418
ILK_HUMAN Integrin-linked protein kinase
51386
Q9UDY2
ZO2_HUMAN Tight junction protein ZO-2
133890.2 5
Q13685
AAMP_HUMAN Angio-associated migratory cell protein
46721.5
1
P08134
RHOC_HUMAN Rho-related GTP-binding protein RhoC precursor
21992.3
4
154
508
43
Differentiation
P15531
NDKA_HUMAN Nucleoside diphosphate kinase A
17137.7
Cancer
Breast cancer
P33076
C2TA_HUMAN MHC class II transactivator
123379.3 2
O60869
EDF1_HUMAN Endothelial differentiation-related factor 1
16358.9
9
O95758
ROD1_HUMAN Regulator of differentiation 1
56466.5
15
P09382
LEG1_HUMAN Galectin-1
14706.2
7
P17931
LEG3_HUMAN Galectin-3
26172.1
77
P23771
GATA3_HUMAN Trans-acting T-cell-specific transcription factor GATA3
47885.3
3
P35221
CTNA1_HUMAN Catenin alpha-1
100008.6 100
P37231
PPARG_HUMAN Peroxisome proliferator-activated receptor gamma
57583.2
P40763
STAT3_HUMAN Signal transducer and activator of transcription 3
Q8TB36
GDAP1_HUMAN Ganglioside-induced differentiation-associated protein 1
O00170
AIP_HUMAN AH receptor-interacting protein
37640.2
18
Cancer
Breast cancer
O14908
GIPC1_HUMAN PDZ domain-containing protein GIPC1
36026.7
34
Cancer
Breast cancer
P01112
RASH_HUMAN GTPase HRas precursor
21284.6
6
Cancer
Breast cancer
P02786
TFR1_HUMAN Transferrin receptor protein 1
84818
19
Cancer
Breast cancer
P08107
HSP71_HUMAN Heat shock 70 kDa protein 1
70009.2
560
Cancer
P11142
HSP7C_HUMAN Heat shock cognate 71 kDa protein
70854.4
895
Cancer
P15941
MUC1_HUMAN Mucin-1 precursor
121999.6 4
Cancer
P16615
AT2A2_HUMAN Sarcoplasmic/endoplasmic reticulum calcium ATPase 2
114682.7 8
Cancer
P29353
SHC1_HUMAN SHC-transforming protein 1
62812.6
8
Cancer
P33076
C2TA_HUMAN MHC class II transactivator
123379.3 2
Cancer
P34931
HS71L_HUMAN Heat shock 70 kDa protein 1 L
70331.5
482
Cancer
P35222
CTNB1_HUMAN Catenin beta-1
85442.3
1
Cancer
P37231
PPARG_HUMAN Peroxisome proliferator-activated receptor gamma
57583.2
5
Cancer
P40763
STAT3_HUMAN Signal transducer and activator of transcription 3
88011.4
13
Cancer
P78527
PRKDC_HUMAN DNA-dependent protein kinase catalytic subunit
468786.9 889
Cancer
Cancer
5
Cancer
88011.4
13
Cancer
41225.8
2
Breast cancer
Signaling
Cancer
Breast cancer
Breast cancer
Breast cancer
Tenga and Lazar BMC Cancer 2014, 14:710
/>
Page 9 of 17
Table 1 Biological categorization of MCF-7 proteins matched in the DAVID disease/cancer database (entries in italic are
not all cancer markers, but were included in the list due to their functional relevance to the marker proteins)
(Continued)
Q04206
TF65_HUMAN Transcription factor p65
60181.6
2
Cancer
Q06124
PTN11_HUMAN Tyrosine-protein phosphatase non-receptor type 11
68393.4
2
Cancer
Q07812
BAX_HUMAN Apoptosis regulator BAX
21170.8
1
Cancer
Q13085
COA1_HUMAN Acetyl-CoA carboxylase 1
265382.7 1
Cancer
Q13153
PAK1_HUMAN Serine/threonine-protein kinase PAK 1
60608.8
Cancer
Q14653
IRF3_HUMAN Interferon regulatory factor 3
47189.7
2
Cancer
Q15796
SMAD2_HUMAN Mothers against decapentaplegic homolog 2
52272.8
1
Cancer
Q5JWF2
GNAS1_HUMAN Guanine nucleotide-binding protein G(s) subunit alpha isoforms XLas 110955.6 67
Cancer
Q7LG56
RIR2B_HUMAN Ribonucleoside-diphosphate reductase subunit M2 B
Cancer
40710.5
4
5
Breast cancer
Breast cancer
Q8WUF5 IASPP_HUMAN RelA-associated inhibitor
89036
15
Cancer
Q92466
DDB2_HUMAN DNA damage-binding protein 2
47833.4
5
Cancer
Q96RG5
Q96RG5_HUMAN Insulin receptor substrate 2 insertion mutant
137347.9 1
Cancer
Breast cancer
P31947
1433S_HUMAN 14-3-3 protein sigma
27756.7
67
P62993
GRB2_HUMAN Growth factor receptor-bound protein 2
25190.4
32
P46108
CRK_HUMAN Proto-oncogene C-crk
33810
18
Q16539
MK14_HUMAN Mitogen-activated protein kinase 14
41267.1
2
P42224
STAT1_HUMAN Signal transducer and activator of transcription 1-alpha/be
87279.6
62
Q13547
HDAC1_HUMAN Histone deacetylase 1
55067.8
120
Q92769
HDAC2_HUMAN Histone deacetylase 2
55328.8
31
P56545
CTBP2_HUMAN C-terminal-binding protein 2
48914.2
26
Q13363
CTBP1_HUMAN C-terminal-binding protein 1
47505.6
8
Q92793
CBP_HUMAN CREB-binding protein
265180.1 2
Q13616
CUL1_HUMAN Cullin-1
89622
12
P62136
PP1A_HUMAN Serine/threonine-protein phosphatase PP1-alpha catalytic subunit
37487.8
179
P62140
PP1B_HUMAN Serine/threonine-protein phosphatase PP1-beta catalytic subunit
37162.6
9
P06493
CDC2_HUMAN Cell division control protein 2 homolog
34073.9
20
P61586
RHOA_HUMAN Transforming protein RhoA precursor
21754.1
12
P08134
RHOC_HUMAN Rho-related GTP-binding protein RhoC precursor
21992.3
4
Oxidative processes/redox
P00441
SODC_HUMAN Superoxide dismutase [Cu-Zn]
15925.9
35
Cancer
Breast cancer
P03891
NU2M_HUMAN NADH-ubiquinone oxidoreductase chain 2
38934.8
4
Cancer
Breast cancer
P04040
CATA_HUMAN Catalase
59718.9
3
Cancer
Breast cancer
P04179
SODM_HUMAN Superoxide dismutase [Mn], mitochondrial precursor
24706.6
1
Cancer
Breast cancer
P10599
THIO_HUMAN Thioredoxin
11729.7
28
Cancer
Breast cancer
P15559
NQO1_HUMAN NAD(P)H dehydrogenase [quinone] 1
30848
40
Cancer
Breast cancer
P16435
NCPR_HUMAN NADPH–cytochrome P450 reductase
76641.4
22
Cancer
Breast cancer
P21912
DHSB_HUMAN Succinate dehydrogenase [ubiquinone] iron-sulfur subunit
31608.9
5
Cancer
P47985
UCRI_HUMAN Cytochrome b-c1 complex subunit Rieske, mitochondrial precursor
29649.4
2
Cancer
Q99757
THIOM_HUMAN Thioredoxin, mitochondrial precursor
18371.6
1
Cancer
Breast cancer
Q07973
CP24A_HUMAN Cytochrome P450 24A1, mitochondrial precursor
58837.6
15
Cancer
Breast cancer
P30041
PRDX6_HUMAN Peroxiredoxin-6
25019.2
150
P30044
PRDX5_HUMAN Peroxiredoxin-5, mitochondrial precursor
22012.5
110
Breast cancer
Tenga and Lazar BMC Cancer 2014, 14:710
/>
Page 10 of 17
Table 1 Biological categorization of MCF-7 proteins matched in the DAVID disease/cancer database (entries in italic are
not all cancer markers, but were included in the list due to their functional relevance to the marker proteins)
(Continued)
P30048
PRDX3_HUMAN Thioredoxin-dependent peroxide reductase, mitochondrial precursor
27675.2
48
P32119
PRDX2_HUMAN Peroxiredoxin-2
21878.2
102
Q06830
PRDX1_HUMAN Peroxiredoxin-1
22096.3
191
Various metabolic functions and DNA/RNA processing
O43708
MAAI_HUMAN Maleylacetoacetate isomerase
24166.7
4
Cancer
Breast cancer
P00390
GSHR_HUMAN Glutathione reductase, mitochondrial precursor
56221
1
Cancer
Breast cancer
P00492
HPRT_HUMAN Hypoxanthine-guanine phosphoribosyltransferase
24563.6
32
Cancer
P00558
PGK1_HUMAN Phosphoglycerate kinase 1
44586.2
466
Cancer
P07099
HYEP_HUMAN Epoxide hydrolase 1
52915
9
Cancer
P11172
PYR5_HUMAN Uridine 5'-monophosphate synthase
52188.7
11
Cancer
P11586
C1TC_HUMAN C-1-tetrahydrofolate synthase, cytoplasmic
101495.6 149
Cancer
Breast cancer
P15531
NDKA_HUMAN Nucleoside diphosphate kinase A
17137.7
Cancer
Breast cancer
P21266
GSTM3_HUMAN Glutathione S-transferase Mu 3
26542.2
59
Cancer
Breast cancer
P21964
COMT_HUMAN Catechol O-methyltransferase
30017.6
35
Cancer
Breast cancer
P23921
RIR1_HUMAN Ribonucleoside-diphosphate reductase large subunit
90012.5
4
Cancer
Breast cancer
P30876
RPB2_HUMAN DNA-directed RNA polymerase II subunit RPB2
133810.7 2
Cancer
P34896
GLYC_HUMAN Serine hydroxymethyltransferase, cytosolic
53049.1
23
Cancer
Breast cancer
P35520
CBS_HUMAN Cystathionine beta-synthase
60548.3
9
Cancer
Breast cancer
P61604
CH10_HUMAN 10 kDa heat shock protein, mitochondrial
10924.9
58
Cancer
P78417
GSTO1_HUMAN Glutathione transferase omega-1
27548
16
Cancer
Breast cancer
Q07973
CP24A_HUMAN Cytochrome P450 24A1, mitochondrial precursor
58837.6
15
Cancer
Breast cancer
Q13085
COA1_HUMAN Acetyl-CoA carboxylase 1
265382.7 1
Cancer
Breast cancer
154
Q7LG56
RIR2B_HUMAN Ribonucleoside-diphosphate reductase subunit M2 B
40710.5
Q7Z5J4
RAI1_HUMAN Retinoic acid-induced protein 1
203223.9 11
Q92820
GGH_HUMAN Gamma-glutamyl hydrolase precursor
35941.2
17
Cancer
Q9UBB5
MBD2_HUMAN Methyl-CpG-binding domain protein 2
43228
7
Cancer
54876.3
7
Cancer
49639
230
Cancer
Q9UHN1 DPOG2_HUMAN DNA polymerase subunit gamma-2, mitochondrial precursor
5
Breast cancer
Cancer
Cancer
Breast cancer
Cytoskeleton organization
P07437
TBB5_HUMAN Tubulin beta chain
P62328
TYB4_HUMAN Thymosin beta-4
5049.5
15
Cancer
Q13509
TBB3_HUMAN Tubulin beta-3 chain
50400.3
127
Cancer
Breast cancer
Q14980
NUMA1_HUMAN Nuclear mitotic apparatus protein 1
238113.2 505
Cancer
Breast cancer
Q92747
ARC1A_HUMAN Actin-related protein 2/3 complex subunit 1A
41542.7
Cancer
1
Breast cancer
Transport/trafficking
O14908
GIPC1_HUMAN PDZ domain-containing protein GIPC1
36026.7
34
Cancer
O75915
PRAF3_HUMAN PRA1 family protein 3
21600.4
19
Cancer
Q8N1B4
VPS52_HUMAN Vacuolar protein sorting-associated protein 52 homolog
82169.8
14
Cancer
pathways, having a role in inhibiting G2/M cell cycle progression under p53 regulation. It modulates the activity of
signaling proteins by binding to phospho-Ser/Thr motifs,
and was found to be down-regulated in cancer cells. Prohibitin, on the other hand, inhibits DNA synthesis, and is
Breast cancer
believed to be a negative regulator of cell proliferation.
Other players of the DNA replication machinery such as
the origin replication complex (ORC) subunits 3, 4 and 5,
the mini-chromosome maintenance (Mcm) proteins 2, 4
and 7, the replication protein A3 (RPA3 of RFA3) and flap
Tenga and Lazar BMC Cancer 2014, 14:710
/>
Page 11 of 17
1
2
3
Figure 4 STRING functional association network of 153 G1-stage cancer markers: (1) maintenance of genome integrity/DNA repair;
(2) signaling/cell cycle regulation; (3) energy production/metabolism/stress/oxidative phosphorylation.
endonuclease 1 (FEN1), as well as key proteins of the proteasomal degradation pathway, were detected. Protein
degradation by the 26S proteasome pathway is an essential
cell cycle regulatory process as it acts as a one-way switch
that guarantees correct cell cycle phase transitions [20].
CUL1, a member of the Skp/Cullin/F-box complex (SCF)
that controls the levels of CDK inhibitors p21 and p27,
was also identified in the data set. Altogether, the data
Tenga and Lazar BMC Cancer 2014, 14:710
/>
suggest that key positive and negative regulators of the cell
cycle machinery are identifiable by MS in G1-arrested
cells, and that these regulators act in various stages of protein synthesis and degradation, or protein alteration by
posttranslational modifications.
Apoptosis
Apoptosis is a tightly regulated process of cell destruction which cancer cells evade in a variety of ways, and
this resistance has been recognized as a hallmark of
tumorigenesis [16,21]. The extrinsic pathway involves
the activation of transmembrane death receptors from
the tumor necrosis factor (TNF) superfamily (e.g., FAS
and TNF-α) by death signals/ligands from the cell
surface. Ligand binding results in the recruitment of
FAS-associated death domain protein FADD which associates with procaspase-8 causing its activation and
entry into the execution phase. The intrinsic pathway is
triggered by a variety of stimuli such as growth factor
withdrawal, hypoxia and direct DNA damage, among
other factors, and acts through the p53 stress sensor.
Once phosphorylated by DNA checkpoint proteins
(ATM and CHK2), MDM2 mediated ubiquitination and
tagging for proteolysis is impeded, and p53 proceeds to
the activation of pro-apoptotic BCL-2 and repression of
anti-apoptotic BCL-2 family of proteins. Increased p53
levels also lead to the increase of reactive oxygen species (ROS) that cause mitochondrial damage and release of DIABLO, ARTS and HTRA2 that activate the
mitochondrial caspase cascade. The most relevant
apoptosis protein markers that were identified included
BAX (BCL-2 associated X protein which accelerates
programmed cell death by binding to- and antagonizing
apoptosis repressor BCL-2), AIFM1 (apoptosis-inducing factor 1), PDCD5/6/7 (with roles in induction and/
or acceleration of apoptosis), DIDO1 (a programmed
cell death protein), CCAR1 (a cell cycle and apoptosis
regulator), ASC (a caspase-mediated apoptotic factor),
HTRA2 (an inhibitor of the activity of inhibitors of
apoptosis proteins), BID (BH3-interacting domain
death agonist, a pro-apoptotic protein from the BCL-2
family), PAWR (a down-regulator of anti-apoptotic
BCL-2), PAK1 (with roles in protection against apoptosis), API5 (an apoptosis inhibitor), and members of
the m-TOR signaling pathway proteins with roles in
cell survival and evasion of apoptosis [15,21]. Beyond
apoptosis, the activities of these proteins have broad
ramifications into a multitude of signaling pathways
including MAPK, ErbB and p53. BAX and PAK1 represent not only the most interconnected pro- and antiapoptotic markers, but also provide a link between the
DNA damage repair, proliferation and signaling protein
clusters (see Figure 4).
Page 12 of 17
DNA damage response
Cells have developed various DNA repair mechanisms to
correct for genomic damage caused by replication errors,
chemical or environmental factors. The DNA damage
repair proteins that were identified in G1 represent a
large cluster of interacting proteins in Figure 4, and
match the entire range of DNA damage response
(DDR) pathways including mismatch repair (MSH),
base excision repair (XRCC), nucleotide excision repair
(XPC, PNKP, ERCC2), single and double strand break
repair (XRCC, TP53BP, RAD50, PARP, PCNA, APEX,
LIG3, PRKDC), homologous recombination and nonhomologous endjoining [22]. A manifold of connections
among all DNA repair proteins highlights the complex
set of mechanisms that were developed by cells to preserve the genome integrity. Proteins with multiple interactions and roles such as PARP1 and PCNA are at
the center of the DNA damage response network, and,
as noted earlier for the apoptotic proteins, provide the
functional link between the DNA damage, proliferation
and cell cycle signaling clusters. As PARP1 has been
found to be involved in the initiation of ssDNA break
repair, and to play a major role in tumor development
when dsDNA break repair cannot proceed via BRCA1/
BRCA2 mediated homologus recombination due to
various BRCA1/BRCA2 deficiencies, a variety of PARP
inhibitors are under development for treating not just
cancer, but also stroke and cardiovascular diseases [15].
Angiogenesis
Angiogenesis is the highly regulated process of new
blood vessel formation for the purpose of nutrient and
oxygen supply required for cell function and survival
[16]. Angiogenesis is a hallmark of cancer, but can be
tied to other processes in the cell such as inflammation
and wound healing [23]. G1-proteins with roles in
angiogenesis included the gene products of MAPK14
(mitogen activated protein kinase), AAMP (angioassociated migratory cell protein), VEZF1 (vascular
endothelial zinc finger), RNH1 (RINI) (ribonuclease/
angiogenin inhibitor), STAT3 and p300/CBP (CREBbinding protein) [15]. MAPK14 can be activated by
proinflammatory cytokines and through its kinase activity has roles in cell cycle regulation. AAMP has
additional roles in cell migration and VEZF1 in transcription regulation and cellular defense response.
RNH1 is an angiogenin inhibitor, STAT3 an angiogenesis modulator, while the p300/CBP proteins act as
transcriptional co-activators of the angiogenic factor
VEGF (vascular endothelial growth factor) [15,16,23].
Both pro- and anti-angiogenic factors possess various
additional biological functions. MAPK14 and STAT3
lie at the heart of multiple signaling pathways that mediate gene expression in response to various stimuli,
Tenga and Lazar BMC Cancer 2014, 14:710
/>
and play central roles in many cellular processes that link
angiogenesis to cell growth, proliferation and apoptosis.
Page 13 of 17
proteins CDC42 and RAC [15]. It is known to regulate
cell motility and morphology.
Differentiation
Cell adhesion, migration, tissue invasion
Cell adhesion and migration play important roles in
the initiation of tumor invasion and metastasis [24,25].
Several tight junction (TJ) proteins, among which ZO1
and ZO2, and numerous adherens junction (AJ) proteins, which included α- and δ-catenin, were identified.
Tight junctions (TJ) regulate the passage of ions and
solutes between cells, while adherens junctions (AJ)
participate in the initiation and stabilization of cell-cell
contacts. Much broader roles in signal transduction,
gene expression, cell cycle modulation and cytoskeleton regulation have been, however, described for these
proteins. Transmembrane E-cadherin proteins use
their extracellular domain to interact with E-cadherins
on adjacent cells, and their intracellular domain to interact
with p120-catenin (δ-catenin/CTND), α-catenin (CTNA)
and β-catenin (CTNB). The catenins provide a link to the
actin cytoskeleton and signaling pathways. Reduced levels
of CTNA have been implicated in epithelial cancers, including breast cancer, and have been associated with increased invasiveness. CTND plays a role in the regulation
of cell motility by interaction with RHO GTPases, and it
has been implicated in breast cancer progression. On the
cell surface, MUC1 (mucin), a membrane-bound Oglycosylated protein, plays additional roles in cell adhesion
(the α-subunit) and the modulation of intracellular signaling pathways (the β-subunit) that include ERK, SRC,
NF-kappa-B, RAS/MAPK and p53. Changes in the glycosylation pattern or overexpression of this protein have
been frequently associated with carcinomas [26].
Cell motility involves cytoskeleton reorganization to
extend the cell into the intended direction, as well as
sever and create cell adhesions at the trailing and leading
edges, respectively [27]. RHO, RAC and CDC42 are well
studied cell motility regulators that belong to the RHO
subfamily of RAS superfamily of GTPases [6]. Overexpression of these proteins has been linked to progression
and metastasis of breast cancer. In addition, CATD, an
estrogen regulated aspartyl protease that cleaves substrates such as fibronectin and laminin, has been associated with cell invasion and tumor invasiveness in breast
cancer. TYB4 (with roles in actin polymerization),
PTN11 (a protein tyrosine phosphatase involved in signaling) and LEG3 (carbohydrate binding) play additional
roles in cell adhesion, migration and proliferation, while
the expression of the MTA1 protein was correlated with
metastatic potential [28]. PAK1, a Ser/Thr p21-activating
kinase, is part of a family of proteins that link RHO
GTPases to cytoskeleton reorganization and nuclear signaling, serving as targets for the small GTP binding
Cell differentiation, proliferation and cell cycle regulation are processes that work concurrently, but independently, sharing certain key players with individual
regulatory function [29]. Differentiation is the process by
which unspecialized cells reach a terminal, nonproliferative state by acquiring structural and functional
characteristics to perform a specific function [6]. Blocking of differentiation plays an important role in cancer
pathogenesis, as poor cell differentiation correlates to
more aggressive tumor phenotypes, and viceversa. There
is evidence suggesting that the mechanisms that prevent
hyperphosphorylation of RB favor differentiation, while
mechanisms that promote RB hyperphosphorylation
favor a block in differentiation [6]. Complementing the
cell cycle and cell proliferation regulators (RB, MAPK,
RAS-related proteins and protein phosphatases), a series
of proteins with various roles in differentiation have
been identified: GATA3, PPARG, EDF1, NME1 or
NDKA, LGALS1 or LEG1, LGALS3, CTNNA1, GDAP1
and ROD1 [15]. GATA3, a transcriptional activator involved in the differentiation of luminal epithelial cells
such as MCF-7 and that has been suggested as a breast
cancer predictor, displays an inverse correlation to metastasis capability and strong association with estrogen
receptors, though it does not appear to be involved in
the estradiol signaling pathway [30]. In addition, GATA3
represses adipocyte differentiation by suppressing the
peroxisome proliferator-activated receptor γ (PPARG).
On the other hand, EDF1 (endothelial differentiationrelated factor), a transcriptional activator, stimulates
PPARG activities. The NME1, LGALS, CTNNA1 (catenin, alpha1), GDAP1 and ROD1 proteins have roles in
inducing or blocking cell differentiation. The overlapping functional relationships between differentiation, invasive properties, angiogenesis and proliferation are
clearly observable in Figure 4, and point in the direction
of the same signaling proteins, strengthening the relevance of this protein set to determining cell fate.
Oxidative phosphorylation/stress//redox regulation
Oxidative phosphorylation is an energy-producing metabolic pathway composed of five mitochondrial membranebound multiprotein complexes (I-V) which use the energy
generated by electron transfer to synthesize ATP [31,32].
A number of proteins belonging to NADH dehydrogenase,
NADH ubiquinone oxidoreductase and ATP synthase
complexes, cytochrome b-c complexes/oxidases, peroxiredoxins and thioredoxins, were identified. Aberrancies in
oxidative phosphorylation such as electron leakage leading
to oxidative stress, and mutations in these complexes,
Tenga and Lazar BMC Cancer 2014, 14:710
/>
have been reported in cancer. Reactive oxygen species
(ROS) formed from leaked electrons play a role in DNA
damage and apoptosis, inducing oxidative stress, which in
turn can promote angiogenesis and metastasis. Peroxiredoxins and antioxidant enzymes, such as [Cu-Zn] superoxide dismutase (SODC or SOD1, and SODM or SOD2)
and catalase (CATA) modulate the levels of ROS and are
important players in the cellular detoxification processes.
While overproduction of ROS induces cell death, moderate levels reportedly can confer resistance to apoptosis
and promote cell proliferation. Over expression of SOD1
and CATA has been reported in breast tumors and other
types of cancer. APEX1, with roles in cell detoxification
and the redox regulation of transcriptional factors, also
displays activities in the base excision repair of DNA lesions induced by oxidative and alkylating agents where it
functions as an apurinic/apyrimidinic endodeoxyribonuclease [15]. While this group of proteins formed a rather
independent cluster of interacting partners in Figure 4
(see cluster 3), the link to the signaling and DNA damage
response clusters is clearly evidenced through the superoxide radical capturing SOD1 and SOD2 proteins.
Page 14 of 17
Signaling
The largest sub-set of cancer markers included 48 proteins with various roles in modulating a broad range of
signal transduction events (Table 2). Numerous pathways that promote cell proliferation are activated by the
binding of various ligands to cell surface receptor tyrosine kinases (RTKs). SH2-containing proteins such as
GRB2, SHC, STAT3 which bind phosphorylated RTKs,
were present in the cytoplasmic fractions. GRB2, SHC1
and CRK are known as adaptor proteins because of their
specific role as intermediates in protein-protein interactions [6,16]. When GRB2 binds a phosphorylated RTK
directly or through SHC1, it can initiate a signaling cascade by successive binding of SOS, a guanine nucleotide
exchange factor that activates the membrane bound
RAS protein by replacing GDP with GTP. Out of four
existing mammalian RAS proteins, H-RAS was identified
in the cytoplasmic fractions. RAS has a vast list of effector proteins which can activate different signaling
pathways, of which the major ones are RAL-GDS, RAC/
RHO, RAF, PI3K and RAL-GEF. The RAF mitogenic pathway has been described as possibly the most relevant to
Table 2 Signaling pathways and associated proteins
Pathway
Representative proteins
MAPK: Proliferation, differentiation, migration
HRAS/RASH, HSP71, HSP7C, HS71L, NF-kappa-β or TF65/RELA, GNAS,
PAK1, RAC1, SHC1, MAPK14, GRB2, CRK
ErbB: Proliferation, differentiation, survival, angiogenesis and adhesion/
motility/migration/invasion
SHC1, PAK1, GRB2, CRK, HRAS
Cell cycle: Proliferation
SMAD2, SHC1, 1433s/SFNC/stratifin, HDAC1/2, CREBBP, CUL1, CDC2
DNA damage repair: Maintenance of genome integrity
PARP1, TP53BP, PCNA, PRKDC, DDB2, CREBBP (Table 1)
Apoptosis: Cell death
BCLF1, BAX, TF65, IASPP
p53: Cell cycle arrest, apoptosis, senescence, inhibition of angiogenesis/
metastasis, inhibition of IGF-1/mTOR pathway
BAX, RIR2B, DDB2, CDC2, 1433s
TGF-β: proliferation, apoptosis, differentiation, migration
SMAD2, CREBBP, CUL1, RHOA
NF-kappa-B: Regulation of genes involved in immunity, inflammation,
cell survival
NF-kappa-β/TF65/RELA
Wnt: Cell division, development, adhesion
CTNB1, SMAD2, CTBP2, CREBBP, CUL1, RAC1
Jak/STAT: Growth, proliferation, development, cell fate, immunity,
cell cycle, apoptosis
STAT 3, PTN11, STAT1, GRB2, CREBBP
Toll-like: Innate immune responses to pathogenic bacteria
TLR2, IRF3, TF65, MAPK14, STAT1, RAC1
Notch: Proliferative signaling, angiogenesis
HDAC1, CTBP1/2, CREBBP
VEGF: Angiogenesis
MAPK14, SHC1, RAC1, HRAS
Adhesion/integrin signaling: Cell migration, tissue invasion
CTNB1, PAK1, GRB2, CRK, HRAS, RAC1, PP1A/B, CDC2, RHOA, ILK,
MUC1, PTN11
Ca signaling: Proliferation, apoptosis, metabolism
AT2A2, GNAS1
Insulin signaling: Maintenance of energy metabolism/homeostasis
Q96RG5, TFR1, PTN11, COA1, SHC1, GRB2, CRK, PP1A/B
Chemokine: Immune response, cell growth, differentiation, survival,
migration, apoptosis, regulation of cytoskeleton
STAT3, PAK1, TF65, SHC1, GRB2, CRK, STAT1, RHOA, RAC1, HRAS
PPAR signaling: Lipid metabolism, adipocyte differentiation
PPARG, ILK
Fatty acid biosynthesis
COA1
Tenga and Lazar BMC Cancer 2014, 14:710
/>
cancer pathogenesis due to its capability to activate several
growth-promoting genes, provide anchorage independence, repress contact inhibition, change cell shape and in
general promote proliferation [6,16]. Downstream proteins
in this pathway include the extracellular regulated protein
kinases (ERK) ERK1 and ERK2. Pertinent to the G1/S
transition, activation of ERK1 and ERK2 is required up to
late G1 for expression of cyclin D1 and successful S entry,
though the activity of these proteins is not necessary after
the R-point. Further implications of RAS activation involve sustained angiogenesis and evasion of apoptosis.
Overall, the deregulation of the SOS-RAS-RAF-MAPK
signaling cascade is heavily implicated in acquired growth
factor autonomy. In the larger landscape, RTK initiated
signaling integrates ErbB, Jak/STAT, integrin, insulin, cell
cycle/DNA repair and apoptosis signaling, chemokine signaling integrates Jak/STAT, G-protein and Ca signaling
pathways, while Ras, downstream in the cell, further modulates the outcome of TGF-β, Wnt and NF-kB signaling.
The ultimate result is a complex orchestration of crosstalk and positive/negative feed-back loops that control cell
cycle progression.
Discussion
A first important finding of this study reveals that the
majority of cancer marker proteins that were compiled
in the DAVID disease database from rather random and
unrelated studies on cancer, and that were identified in
MCF-7 G1 cells, are not isolated players in the development of the disease, but part of multiple regulatory networks that integrate seamlessly with the hallmarks of
cancer. A close examination of Figure 4 reveals that the
proteins displaying the largest number of interactions
(>10-15) also represent the functional links between the
three major clusters: SOD1, SOD2 and CAT (from the
oxidative stress cluster), PARP1, PCNA and APEX1
(from the DNA damage cluster) and STAT3, RAC1,
RELA and ILK (from the signaling cluster). A STRING
interaction diagram of this circle of proteins and of a
few additional regulatory proteins with >5 interactors
highlights in detail these central functional relationships
(Figure 5). The outcome is conclusive: DNA damage coexists with oxidative phosphorylation and stress, and, in
response, multiple signaling pathways work in tandem to
determine the fate of the cell. Cancer marker signaling
proteins such as STAT3, RAC1, RELA and ILK are involved through their parent pathways essentially in all
aspects of signal transduction (Table 2: Jak/STAT, NFkappa-β, MAPK, Wnt, Toll-like, VEGF, chemokine, integrin), linking a vast array of extracellular stimuli to the
intracellular signaling cascades that govern cell proliferation, repair, differentiation, immune response, invasion,
metastasis or death. SOD2, SOD1 and CATA are key
antioxidant defense enzymes that alleviate the toxic
Page 15 of 17
CDC42 CTNNA1
CTNND1
GRB2
MAPK14
CTNNB1
ANXA2
SMAD2STAT1 PTPN11
RB1
CRBBP
HRAS
RELA RAC1
ILK
STAT3
SOD1
PARP1
CAT
SOD2
PCNA
XRCC6
CDK1
MSH6
XRCC5
MSH2
ERCC2
PRKDC
APEX1
XRCC1
TXN
PRDX4
PRDX6
PRDX1
PRDX5
PRDX2
SHMT1
RRM1
Figure 5 STRING functional association network of central cancer
markers that link the DNA repair, signaling and metabolic clusters.
effects of hydrogen peroxide and superoxide anions/radicals produced as a result of various metabolic processes,
while PARP1 and PCNA orchestrate DNA replication
and damage repair functions to ensure healthy cell proliferation. Alterations in the activity of these genes and
their protein products associate inherently, therefore,
with the development of cancerous cell states. While
members of all three major clusters were represented in
both the nuclear and cytoplasmic cellular subfractions,
the DNA damage repair components prevailed in the
nuclear fraction, while the signaling and cellular detoxification components in the cytoplasm. Based on their
functional roles, the nuclear markers and some of the
signaling proteins are indicative of a network of drug
targets, while the cytoplasmic proteins of a network or
putative biomarkers, respectively. In recent years, the
value of such a network-based set of markers has been
recognized [33,34]. New concepts such as network biomarkers and dynamical network biomarkers have gained
popularity, primarily due to the promises brought to improving early diagnostics, sensitivity and specificity, and
to behaving more robustly with smaller number of samples [33]. Moreover, the study of network models has
suggested that therapies aimed at the inhibition of a
number of drug targets, even if small and even if partial,
can be much more effective than therapies aimed at the
complete inhibition of a single target [34].
The second finding of this study reveals that a common thread of the identified cancer marker clusters is
the presence of both agonist and antagonist members
within the cluster. The results confirm that entire signaling pathways may have both proliferative and inhibitory
Tenga and Lazar BMC Cancer 2014, 14:710
/>
outcomes. For example, the activation of STAT1 and
STAT3 results in opposite effects on tumorigenesis.
While STAT3 is considered an oncogene that promotes
cell survival/proliferation, motility and immune tolerance, STAT1 is a tumor suppressor through its antiproliferative, pro-apoptotic and angiogenesis-inhibitor
activities [23]. The active TGF-β signaling pathway has,
on the other hand, a role in growth inhibition. Upon activation of the pathway, SMAD2 and SMAD3 undergo
phosphorylation in the cytosol followed by binding of either phosphorylated protein to SMAD4, nuclear translocation of the complex, and transcription factor activity.
Relevant to cell cycle control, the CDK inhibitors p15
and p21 are the important targets of this pathway [6].
Repression of TGF-β signaling is therefore a way in
which cancer cells can achieve insensitivity to antigrowth signals. For example, EVI1 and AML1/EVI1 inhibit the transcription factor activity of SMAD3 in the
nucleus by direct interaction through a zinc-finger motif.
Furthermore, CTBP (C-terminal binding protein), a
transcriptional repressor necessary for the inhibition of
SMAD3 by EVI1, recruits a histone deacetylase (HDAC)
complex which aids in the repression of antigrowth signals [24]. The two CTBP vertebrate homologues
(CTBP1 and CTBP2), as well as the histone deacetylases
HDAC1 and HDAC2, were identified in the nuclear fractions, suggesting that important participants of acquisition of insensitivity to antigrowth signals are in place in
MCF-7 cells. For a complex disease such as cancer, that
hosts entirely deregulated but viable signaling pathways,
the identification of a novel regulatory network such as
suggested by Figures 4 and 5, of its components and of its
dynamic behavior, is expected to have a major impact on
clarifying the mechanistic details of disease progression.
The third finding of the study reveals that the identified signaling clusters control or modulate not one, but
several cancer-related biological processes. Likewise,
physiological responses within a cell are elicited not
through one, but through multiple signaling pathways.
The MAPK and Jak/STAT pathways have ramifications
within, virtually, all biological processes that determine
the fate of a cell. The delineation of a panel of proteins
that modulate cell adhesion/motility/metastasis (CTNB1,
MUC1, PAK1, RAC1, RHOA, PTN11, CRK, GRB2,
PP1A/B), while simultaneously playing central roles in
signaling pathways such as MAPK, ErbB, IGF and Jak/
STAT (and, as a result, in all aspects of cell division,
proliferation, apoptosis and differentiation, see Tables 1
and 2), is vital to providing insights into the mechanism
used by cancer cells to invade adjacent tissues and into
the correlation of these processes with events occurring
within the cytoplasmic signal-transduction pathways.
Simultaneously, the placement of both pro- and antiapoptotic proteins within a broader panorama of cell
Page 16 of 17
cycle regulation, survival, proliferation and differentiation proteins is critical to exploring the impact of antiapoptotic factor up-regulation or pro-apoptotic factor
down-regulation in cancer. Such perspectives can reveal
clues into whether cancer cells have (or not) the ability
to activate self-destruction signaling mechanisms, and
into the strategies evolved by cancer cells to evade apoptosis and respond to cellular signals that indicate a malfunction of the cell proliferation machinery or the presence of
physiological stress. Future protein differential expression
studies will be able to validate which networks prevail in
the case of particular pathological cancer phenotypes.
Conclusions
In this work, through proteomic profiling of the G1
stage of MCF-7 cells, and by making use of publically
available information and bioinformatics tools, we uncovered a highly interconnected network of nuclear and
cytoplasmic cancer markers with regulatory role in biological processes representative of all hallmarks of cancer.
Protein interaction analysis and biological characterization
of the data revealed that clusters pertaining to cell cycle
regulation, signaling, DNA repair, differentiation, angiogenesis and apoptosis, were particularly well represented
in the pool of identified proteins. The three major networks formed by these cancer markers, i.e., signaling,
maintenance of genome integrity and oxidative stress, are
indicative of the different mechanisms that cancer cells
utilize to maintain viability in the absence of mitogenic
stimulation and to possibly evade the R-restriction point
and sustain an aberrant proliferative status. Due to their
collective and intertwined roles on the proliferative behavior of cancer cells, the identified markers represent a panel
of broad functional relevance to both biomarker and drug
discovery research. The combined biomarker/drug-target
potential is elevated by the fact that the panel emerged
from a list of markers representative of a number of cancerous cell states, compiled rather randomly by on-line
bioinformatics tools. The data suggest that proteins with
redundant or multiple roles in the control of a cell’s fate
represent the most informative cancer markers and the
most valuable leads for the development of multiplexed
biomarker assays and of anti-cancer drugs with increased
therapeutic potential.
Additional files
Additional file 1: Title of data: MCF-7 G1 cell cycle proteins and DAVID
functional clustering. Description of data: The table contains proteins
identified in the MCF7 G1 stage of the cycle and their DAVID
categorization.
Additional file 2: Title of data: List of cancer markers with associated
biological and mass spectrometry information. Description of data: The
table contains proteins identified in the MCF7 G1 stage of the cycle that
Tenga and Lazar BMC Cancer 2014, 14:710
/>
were associated with the presence of cancer, their GO categorization,
disease associations, and Kegg pathways.
Competing interests
The authors declare no competing interests.
Authors’ contributions
MJT performed the culture and analysis of MCF-7 cells, and drafted a
preliminary version of the manuscript. IML conceived the study, coordinated
the work, evaluated the overall results, and prepared the final version of the
manuscript. Both authors read and approved the final manuscript.
Acknowledgments
This work was supported by grants from Virginia Tech and NCI
(R21CA126669-01A1) to I. M. Lazar. The content is solely the responsibility of
the authors and does not necessarily represent the official views of the
National Cancer Institute or the National Institutes of Health. The publication
of this article was supported by Virginia Tech’s Open Access Subvention
Fund.
Received: 17 October 2013 Accepted: 17 September 2014
Published: 24 September 2014
References
1. Howard A, Pelc S: Synthesis of deoxyribonucleic acid in normal and
irradiated cells and its relation to chromosome breakage. Heredity 1953,
6(suppl):261–273.
2. Park M, Lee S: Cell cycle and cancer. J Biochem Mol Biol 2003, 36:60–65.
3. Pardee AB: A restriction point for control of normal animal cell
proliferation. Proc Natl Acad Sci U S A 1974, 71:1286–1290.
4. Hartwell LH, Weinert TA: Checkpoints: controls that ensure the order of
cell cycle events. Science 1989, 246:629–634.
5. Ford HL, Pardee AB: Cancer and the cell cycle. J Cell Biochem 1999, 32–33
(Suppl):166–172.
6. Weinberg RA: The Biology of Cancer. New York: Garland Science, Taylor &
Francis Group, LLC; 2007.
7. Tenga MJ, Lazar IM: A proteomic snapshot of breast cancer cell cycle: The
G1/S Transition Point. Proteomics 2013, 13:48–60.
8. Sarvaiya HA, Yoon JH, Lazar IM: Proteome profile of the MCF-7 cancer cell
line: a mass spectrometric evaluation. Rapid Commun Mass Spectrom
2006, 20:3039–3055.
9. Yang X, Lazar IM: MRM screening/biomarker discovery: a library of human
cancer-specific peptides. BMC Cancer 2009, 9:96.
10. Gasteiger E, Gattiker A, Hoogland C, Ivanyi I, Appel RD, Bairoch A: ExPASy:
The proteomics server for in-depth protein knowledge and analysis.
Nucleic Acids Res 2003, 31:3784–3788.
11. Zeeberg BR, Feng W, Wang G, Wang MD, Fojo AT, Sunshine M, Narasimhan
S, Kane DW, Reinhold WC, Lababidi S, Bussey KJ, Riss J, Barrett JC, Weinstein
JN: GoMiner: a resource for biological interpretation of genomic and
proteomic data. Genome Biol 2003, 4:R28.
12. Huang DW, Sherman BT, Lempicki RA: Systematic and integrative analysis
of large gene lists using DAVID bioinformatics resources. Nat Protoc 2009,
4:44–57.
13. Dennis G Jr, Sherman BT, Hosack DA, Yang J, Gao W, Lane HC, Lempicki RA:
DAVID: Database for Annotation, Visualization, and Integrated Discovery.
Genome Biol 2003, 4:P3.
14. Jensen LJ, Kuhn M, Stark M, Chaffron S, Creevey C, Muller J, Doerks T, Julien
P, Roth A, Simonovic M, Bork P, von Mering C: STRING 8–a global view on
proteins and their functional interactions in 630 organisms. Nucleic Acids
Res 2009, 37:D412–D416.
15. Safran M, Dalah I, Alexander J, Rosen N, Iny Stein T, Shmoish M, Nativ N, Bahir I,
Doniger T, Krug H, Sirota-Madi A, Olender T, Golan Y, Stelzer G, Harel A, Lancet D:
GeneCards Version 3: the human gene integrator. Database 2010, 2010. 1-16.
Article ID baq020, doi:10.1093/database/baq020.
16. Hanahan D, Weinberg RA: The hallmarks of cancer: the next generation.
Cell 2011, 144:646–674.
17. Kanehisa M, Goto S: KEGG: Kyoto Encyclopedia of Genes and Genomes.
Nucleic Acids Res 2000, 28:27–30.
Page 17 of 17
18. Hochegger H, Dejsuphong D, Sonoda E, Saberi A, Rajendra F, Kirk J, Hunt T,
Takeda S: An essential role for Cdk1 in S phase control is revealed via
chemical genetics in vertebrate cells. J Cell Biol 2007, 178:257–268.
19. Polanski M, Anderson NL: A list of candidate cancer biomarkers for
targeted proteomics. Biomark Insights 2006, 1:1–48.
20. Diehl JA, Ponugoti B: Ubiquitin-dependent proteolysis in G1/S phase
control and its relationship with tumor susceptibility. Genes Cancer 2010,
1:717–724.
21. Elmore S: Apoptosis: A review of programmed cell death. Toxicol Pathol
2007, 35:495–516.
22. Ciccia A, Elledge SJ: The DNA damage response: making it safe to play
with knives. Mol Cell 2010, 40:179–204.
23. Grivennikov SI, Greten FR, Karin M: Immunity, inflammation and cancer.
Cell 2010, 140:883–899.
24. McSherry EA, Donatello S, Hopkins AM, McDonnell S: Molecular basis of
invasion in breast cancer. Cell Mol Life Sci 2007, 64:3201–3218.
25. Gumbiner BM: Cell adhesion: the molecular basis of tissue architecture
and morphogenesis. Cell 1996, 84:345–357.
26. Varki A, Kannagi R, Toole BP: Glycosylation changes in cancer, chapter 44.
In Essentials of Glycobiology. 2nd edition. Edited by Varki A, Cummings RD,
Esko JD, Freeze HH, Stanley P, Bertozzi CR, Hart GW, Etzler ME. New York:
Cold Spring Harbor Laboratory Press; 2009.
27. Braga V: The crossroads between cell-cell adhesion and motility. Nat Cell
Biol 2000, 2(10):E182–E184.
28. Futamura M, Nishimori H, Shiratsuchi T, Saji S, Nakamura Y, Tokino T:
Molecular cloning, mapping and characterization of a novel human
gene, MTA1-L1, showing homology to a metastasis-associated gene,
MTA1. J Hum Genet 1999, 44:52–56.
29. Brown G, Hughes PJ, Michell RH: Cell differentiation and proliferationsimultaneous but independent? Exp Cell Res 2003, 291:282–288.
30. Chou J, Provot S, Werb Z: GATA3 in development and cancer
differentiation: cells GATA have it! J Cell Physiol 2010, 222:42–49.
31. Lemarie A, Grimm S: Mitochondrial respiratory chain complexes:
apoptosis sensors mutated in cancer. Oncogene 2011, 30:3985–4003.
32. Brown NS, Bicknell R: Hypoxia and oxidative stress in breast cancer.
Oxidative stress: its effects on the growth, metastatic potential and
response to therapy of breast cancer. Breast Cancer Res 2001, 3:323–327.
33. Liu R, Wang X, Aihara K, Chen L: Early Diagnosis of Complex Diseases by
Molecular Biomarkers, Network Biomarkers, and Dynamical Network
Biomarkers. Med Res Rev 2013, in press.
34. Csermely P, Ágoston V, Pongor S: The efficiency of multi-target drugs: the
network approach might help drug design. Trends Pharmacol Sci 2005,
26:178–182.
doi:10.1186/1471-2407-14-710
Cite this article as: Tenga and Lazar: Proteomic study reveals a
functional network of cancer markers in the G1-Stage of the breast
cancer cell cycle. BMC Cancer 2014 14:710.
Submit your next manuscript to BioMed Central
and take full advantage of:
• Convenient online submission
• Thorough peer review
• No space constraints or color figure charges
• Immediate publication on acceptance
• Inclusion in PubMed, CAS, Scopus and Google Scholar
• Research which is freely available for redistribution
Submit your manuscript at
www.biomedcentral.com/submit