Tài liệu Báo cáo khoa học: A functional polymorphism of apolipoprotein C1 detected by mass spectrometry docx
Bạn đang xem bản rút gọn của tài liệu. Xem và tải ngay bản đầy đủ của tài liệu tại đây (364.18 KB, 9 trang )
A functional polymorphism of apolipoprotein C1 detected
by mass spectrometry
Matthew S. Wroblewski
1
, Joshua T. Wilson-Grady
1
, Michael B. Martinez
1
, Raj S. Kasthuri
2
,
Kenneth R. McMillan
3
, Cristina Flood-Urdangarin
4
and Gary L. Nelsestuen
1
1 Department of Biochemistry, Molecular Biology and Biophysics, University of Minnesota, Minneapolis, MN, USA
2 Department of Medicine, University of Minnesota, Minneapolis, MN, USA
3 American Indian Community Development Corporation, Minneapolis, MN, USA
4 St Mary’s Health Clinics, St Paul, MN, USA
Apolipoprotein C1 (ApoC1) is a component of very-
low-density lipoproteins (VLDLs), intermediate classes,
and high-density lipoproteins (HDLs). It has several
potential functions. It helps to maintain HDL structure
and activates plasma lysolecithin acyltransferase. It is
also able to modulate the interaction of apolipoprotein
E with b-migrating VLDLs and inhibit binding of
b-VLDL to low-density lipoprotein receptor-related
protein [1,2]. It is implicated in regulation of several
lipase enzymes [3–5]. An N-terminal 38-residue form of
ApoC1 is able to inhibit cholesterol ester transferase
[6]. ApoC1 accounts for inhibition of cholesterol ester
transferase by HDL [7]. Thus, ApoC1 has a number of
potential functions that may be important in vivo.
Known variants of the ApoC1 gene are limited to un-
translated regions of the gene, synonymous mutations
of the coding sequence and a number of variants of the
intron regions of the gene (NCBI database for ApoC1).
An important functional variant is found in the promo-
ter region where complex factors [8,9] may link ApoC1
expression levels to familial dysbetalipoprotemia, car-
diovascular disease, and Alzheimer’s disease [10–12].
Overexpression of human ApoC1 in the mouse produ-
ces a hyperlipidemic condition [4,13] with possible
beneficial effects for diabetes [14,15]. Hyperlipidemia
may result from increased inhibition of b-VLDL bind-
ing to the receptor and reduced clearance of VLDLs
from the circulation. Variants of ApoC2 and ApoC3
have been linked to metabolic disease [16–18]. This
study reports the first case of a structural variant of
ApoC1 as well as some protein properties that suggest
the functional significance of this residue change. They
Keywords
apolipoprotein C1; mass spectrometry;
polymorphism; protein–lipid contact surface
Correspondence
G. L. Nelsestuen, 6–155 Jackson Hall,
321 Church St SE, Minneapolis, MN 55455,
USA
Fax: +612 625 2163
Tel: +612 624 3622
E-mail:
(Received 7 July 2006, revised 16 August
2006, accepted 18 August 2006)
doi:10.1111/j.1742-4658.2006.05473.x
A survey of plasma proteins in approximately 1300 individuals by
MALDI-TOF MS resulted in identification of a structural polymorphism
of apolipoprotein C1 (ApoC1) that was found only in persons of American
Indian or Mexican ancestry. MS ⁄ MS analysis revealed that the alteration
consisted of a T45S variation. The methyl group of T45 forms part of the
lipid-interacting surface of ApoC1. In agreement with an impact on lipid
contact, the S45 variant was more susceptible to N-terminal truncation by
dipeptidylpeptidase IV in vitro than was the T45 variant. The S45 protein
also displayed greater N-terminal truncation (loss of Thr-Pro) in vivo than
the T45 variant. The S45 variant also showed preferential distribution to
the very-low-density lipoprotein fraction than the T45 protein. These prop-
erties indicate a functional effect of the S45 variant and support a role for
residue 45 in lipid contact and lipid specificity. Further studies are needed
to determine the effects of the variant and its altered N-terminal truncation
on the metabolic functions of ApoC1.
Abbreviations
ApoC1, apolipoprotein C1; ApoC2, apolipoprotein C2; ApoC3-0, ApoC3 that does not contain a carbohydrate chain; ApoC3-1, ApoC3 with a
GalNAc-Gal-sialic acid carbohydrate chain; ApoC3-2, ApoC3 containing the carbohydrate of ApoC3-1 plus an additional sialic acid residue;
DPPase, dipeptidylpeptidase IV; HDL, high-density lipoprotein; TTr, transthyretin; VLDL, very-low-density lipoprotein.
FEBS Journal 273 (2006) 4707–4715 ª 2006 The Authors Journal compilation ª 2006 FEBS 4707
also suggest approaches that might be used to deter-
mine the role of N-terminal truncation of ApoC1.
Results
Profile analysis
The MALDI-TOF mass spectrometer detects m ⁄ z val-
ues that generally equate to protonated molecules.
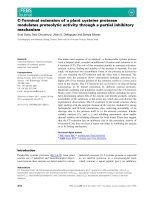
Figure 1A shows an overview of the plasma protein
profile. Briefly, peak identification was accomplished
by comparison of m ⁄ z values with those of known
plasma proteins, Edman degradation of the entire sam-
ple with observed removal of mass appropriate for the
expected N-terminal residue of each component,
and ⁄ or C-terminal degradation by carboxypeptidase
with removal of mass appropriate for the expected res-
idues of each protein. An additional approach used
protein reactivity with disulfide reagents such as dithio-
threitol and iodoacetamide, with quantification of Cys
by detection of mass change of a peptide after reduc-
tion and alkylation. These and other approaches have
been described previously [19], and components that
are important to this study are summarized in the
legend to Fig. 1. Figure 1B shows an expanded view of
the ApoC1 proteins from this individual who showed
a double peak for each of the two forms of ApoC1.
This double peak pattern was highly unusual and was
not observed in over 1000 individuals with ancestry of
Europe, Africa and Asia. Forty-four instances of this
pattern were found among 314 people who identified
themselves as having American Indian and ⁄ or Mexican
ancestry. Fig. 1C shows an expanded view of the
transthyretin (TTr) components from the profile of a
different individual who displayed a double peak pat-
tern that suggested a common polymorphism of TTr.
Many plasma proteins are present in multiple forms.
For example, ApoC1 is present as the full-length pro-
tein (m ⁄ z ¼ 6632) and as a truncated form lacking
N-terminal Thr-Pro [19,20] (m ⁄ z ¼ 6434, Fig. 1). TTr
exists as an unmodified protein (m ⁄ z ¼ 13762) and as
a form that is disulfide-linked to cysteine (m ⁄ z ¼
13881, Fig. 1). Polymorphisms appear as a double
peak for each form of a given protein. The peaks differ
by the mass change produced by the amino-acid sub-
stitution. Figure 1C shows the example of a commonly
observed double peak for TTr with a second compo-
nent that is 30 atomic mass units (amu) higher than
the common form. This double peak for TTr was
observed in 13% of samples and may represent a
common G6S variant [21].
Of greater interest were the unusual components
occurring at 14 amu below full-length and truncated
ApoC1. All examples of the pattern in Fig. 1 showed
the same general characteristics. That is, the peak
occurring 14 amu below full-length ApoC1 was much
less intense than the peak for full-length ApoC1; the
peak at 14 amu below truncated ApoC1 was equally
as intense as or slightly more intense than the peak
from truncated ApoC1. It is possible that all instances
of this novel profile feature pattern arose from the
same modification and were genetically determined.
Structural change
ApoC1 from a person with the double peak profile in
Fig. 1B was isolated as described in Experimental
13762
m/z
6632
6618
6420
6434
6632
13881
13762
13792
13881
13911
ApoC1
TTr
TTr
Intensity
B
A
C
9422
9713
8915
Fig. 1. MALDI-TOF profile of plasma from an individual containing
the unusual profile. (A) The profile from m ⁄ z ¼ 6000–15 000. Sev-
eral peaks are labeled with their m ⁄ z values. (B) Expanded view of
the ApoC1 portion of the profile in (A). Important components of
the profile include: ApoC1 (m ⁄ z ¼ 6632) and its truncated form
(m ⁄ z ¼ 6434), an ApoC1 variant (m ⁄ z ¼ 6618) and its truncated
form (m ⁄ z ¼ 6420). (C) Expanded view of the TTr portion of the
profile from a person who displayed a commonly observed double
peak for TTr. The m ⁄ z values and suggested protein identities are:
13762, the common form of TTr; 13881, the common form of TTr
disulfide-linked to cysteine; 13792, a variant form of TTr that may
consist of G6S change; 13911, the variant protein that is disulfide-
linked to cysteine.
Structural polymorphism of apolipoprotein C1 M. S. Wroblewski et al.
4708 FEBS Journal 273 (2006) 4707–4715 ª 2006 The Authors Journal compilation ª 2006 FEBS
procedures, digested with Glu-C protease, and the pep-
tides subjected to MS. The peptide mass fingerprint
from MALDI-TOF MS showed m ⁄ z values corres-
ponding to all eight theoretical peptides plus the
peptide of the truncated protein (residues 1–13,
TPDVSSALDKLKE, theoretical mass ¼ 1402.7 amu;
residues 3–13 (the truncated protein), 1204.7 amu; resi-
dues 14–19, FGNTLE, 680.3 amu; residues 20–24,
DKARE, 618.3 amu; residues 25–33, LISRIKQSE,
1073.6 amu; residues 34–40, LSAKMRE, 834.4 amu;
residues 41–44, WSFE, 568.2 amu; residues 45–51,
TFQKVKE, 879.5 amu; residues 52–57, KLKIDS,
703.4 amu). Only peptide 45–51 showed a second peak
that was 14 ± 0.1 amu lower (Table 1).
The parent peptide (m ⁄ z ¼ 879.467, residues 45–51
of ApoC1) provided four potential mutations that
would result in loss of 14 amu (T45S, Q47N, K48N,
K50N). Cleavage by Glu-C protease established that
the C-terminal Glu was unaltered. The observed mass
difference (14.003 amu, Table 1) represented a
60 p.p.m. error for peptides of m ⁄ z ¼ 879 and 865 that
differ by a K ⁄ N mutation (theoretical difference ¼
14.056 amu). This was greater than expected for this
instrument when used for internal comparison of two
ions. The theoretical differences for Q47N or T45S
(14.016 amu) were within the expected error (15 p.p.m).
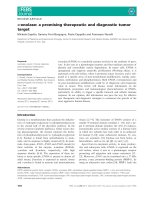
MS ⁄ MS analysis (Fig. 2 and Table 1) confirmed the
T45S difference. Peptide fragmentation at the C–N
peptide bond gives b ions from the N-terminus and y
ions from the C-terminus (Table 1). Cleavage at the
C–C bond provides a ions from the N-terminus. All
ions from the N-terminus were 14 amu lower for the
m ⁄ z ¼ 865.465 peptide, whereas all ions from the
C-terminus as well internal ions were identical for the
two peptides. Detection of the same ions with similar
relative intensities (Fig. 2) established the near identity
Table 1. MS ⁄ MS analysis of relevant ApoC1 peptides identified by BIOANALYST software. To conserve space, ions are rounded to 1 decimal
place. The m ⁄ z values were accurate to three places. ND, not determined.
879.468 peptide (TFQKVKE) 865.465 peptide (SFQKVKE)
(N-terminal ions)
observed ⁄ theoretical
(C-terminal ions)
observed ⁄ theoretical
(N-terminal ions)
observed ⁄ theoretical
(C-terminal ions)
observed ⁄ theoretical
(b
1
-H
2
O)84.0 ⁄ 84.0 – (b
1
-H
2
O)ND –
(b
1
)ND (y
6
)ND (b
1
)ND (y
6
)ND
(b
2
)249.1 ⁄ 249.1 (y
5
)ND (b
2
)235.1 ⁄ 235.1 (y
5
)ND
(b
3
)377.2 ⁄ 377.2 (y
4
)503.3 ⁄ 503.3 (b
3
)363.2 ⁄ 363.2 (y
4
)503.3 ⁄ 503.3
(b
4
)505.3 ⁄ 505.3 (y
3
)ND (b
4
)491.3 ⁄ 491.3 (y
3
)ND
(b
5
)604.4 ⁄ 604.4 (y
2
)276.2 ⁄ 276.2 (b
5
)590.3 ⁄ 590.3 (y
2
)276.1 ⁄ 276.2
(b
6
)732.5 ⁄ 732.4 (y
1
)ND (b
6
)718.4 ⁄ 718.4 (y
1
)ND
(a
2
)221.1 ⁄ 221.1 – (a
2
)207.1 ⁄ 207.1 –
(a
5
)576.4 ⁄ 576.4 – (a
5
)562.3 ⁄ 562.3 –
Internal ions common to both peptides
(Immonium of Q) 101.1 ⁄ 101.1 (Internal QK) 257.2 ⁄ 257.2
(Immonium of F) 120.1 ⁄ 120.1 (Internal QK-H
2
O) 239.2 ⁄ 239.2
(K rearrangement) 129.1 ⁄ 129.1 (Internal QK-NH
3
) 240.1 ⁄ 240.1
(Immonium of K-NH
3
) 84.08 ⁄ 84.08 –
b
5
257
101
239
240
A
300
-
Intensity, counts
0
10
20
30
879
129
a
2
b
6
b
5
-H20
b
4
b
3
b
2
y
2
y
4
100 200 400 500 600 700 800
m/z
0
10
20
30
b
5
b
6
b
4
b
3
b
2
a
2
129
257
b
5
H20
865
y
2
y4
101
239
240
B
70
120
84
861
Fig. 2. MS ⁄ MS spectra of peptides of m ⁄ z ¼ 879.468 (top panel)
and 865.465 (bottom panel). The a, b and y ions are labeled and
presented in Table 1. Internal ions are labeled by m ⁄ z values roun-
ded to the nearest mass unit.
M. S. Wroblewski et al. Structural polymorphism of apolipoprotein C1
FEBS Journal 273 (2006) 4707–4715 ª 2006 The Authors Journal compilation ª 2006 FEBS 4709
of the two peptides, except for the N-terminus. The
T45S mutation requires a single base change (A267T,
accession number X00570).
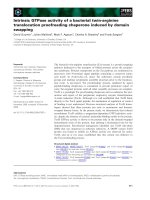
Altered distribution of the S45 variant in VLDLs
compared with HDLs
Ultracentrifugation of plasma partially separates lipo-
protein classes. VLDLs float to the top (fraction 1,
Fig. 3), while HDLs sediment near the middle and bot-
tom of the tube. Earlier studies showed that peak
intensity ratios provide an estimate of the relative pro-
tein ratios in different samples [19]. As expected from
known distributions of the apolipoproteins, the relative
abundance determined by peak intensity ratios of
ApoC2 (m ⁄ z 8915) and ApoC3 (sum of m ⁄ z ¼ 8765,
9422, 9642 and 9713) to ApoC1 was greatest in VLDL
fractions and declined in HDL fractions (Fig. 3F).
With the same approach, the S45 variant of ApoC1
partitioned more to the VLDL fraction than the T45
variant (compare Fig. 3A and 3B with 3C and 3D).
The mean ± SD from triplicate runs for three frac-
tions was determined (Fig. 3E). A single analysis of
every fraction showed that the primary change
occurred between fractions 3 and 8 (not shown), as
expected for the transition from VLDL to HDL and
other classes of lipoproteins. In the experiment shown,
the S45 variant of ApoC1 showed 1.6-fold greater
abundance than the T45 variant in VLDLs (fraction 1)
compared with HDLs (fractions 8 and 16, Fig. 3E).
This enrichment of the low-mass component in VLDLs
was observed in all eight people whose plasma was
analyzed by this method (average difference ¼ 1.5-
fold). Once again, single profiles taken of each fraction
showed that the majority of change occurred between
fractions 3 and 8.
Selective incorporation of other protein isoforms in
VLDLs compared with HDLs was not observed. For
example, the ratios of truncated to full-length ApoC1
were constant across the ultracentrifuge fractions for
both the S45 and T45 variants (open symbols, Fig. 3E)
as were the ratios of four isoforms of ApoC3 (open
symbols, Fig. 3F). This suggests that the T45S change
had altered the lipid-interaction site in a manner that
changed lipid-binding specificity.
m/z
500
1000
2000
Intensity
A B
2000
6600 6640
6400 6440
C D
6420
6434
6618
6632
VLDL
HDL
Fraction No.
Relative Peak ratio
0 5 10 15
F
0
0.4
0.8
1.0
1.4
E
Fig. 3. Differential distribution of apolipoproteins plus isoforms and
variants in VLDLs compared with HDLs. (A, C) Relevant sections of
profiles (2000 laser shots, attenuation 44) showing truncated forms
of ApoC1 (m ⁄ z ¼ 6434 and 6420) in fractions 1 and 9 of the ultra-
centrifuge tube, respectively. Fraction 1 represents VLDLs at the
top of the tube. (B, D) Relevant sections of profiles showing full-
length forms of ApoC1 (m ⁄ z ¼ 6632 and 6618) in fractions 1 and 9
of the ultracentrifuge tube, respectively. (E) Relative peak intensity
ratios for the T45:S45 variants of the full-length (m ⁄ z ¼ 6618 ⁄ 6632,
r) and truncated (m ⁄ z ¼ 6420 ⁄ 6434, n) forms of these proteins.
The peak ratio in fraction 1 was assigned a value of 1.0, and the
ratios in subsequent fractions are expressed relative to that value.
Also shown are peak ratios for the full-length to truncated forms of
the T45 variant (m ⁄ z ¼ 6632 ⁄ 6434, e) and the S45 variant (m ⁄ z ¼
6618 ⁄ 6420, h). (F) Peak ratios of lipoprotein isoforms. The ratio of
peak intensities for ApoC2 (m ⁄ z ¼ 8915, n) to the sum of peaks of
ApoC1 was determined for fraction 1 and assigned a value of 1.0.
The peak ratios in subsequent fractions are expressed relative to
that value. Also shown are the relative ratios of the sum of peaks
from ApoC3 to the sum of peak intensities from ApoC1 (r) and
the ratios of several isoforms of ApoC3 (m ⁄ z ¼ 8765 : 9713, des-
glycoApoC3-0 ⁄ ApoC3-2, n; m ⁄ z ¼ 9422 : 9713, ApoC3-1 ⁄ ApoC3-2,
e; m ⁄ z ¼ 9642 : 9713, C-terminal truncated ApoC3-2 ⁄ ApoC3-2, X;
and m ⁄ z ¼ 9932 : 9713, an unidentified form of ApoC3
(22) ⁄ ApoC3-2, s). Error bars represent the standard deviation of
three measurements. For clarity, only one set of error bars are
shown for the ApoC3 variants. The mean coefficient of variation for
the experimental data points for the ApoC3 ratios was 7%.
Structural polymorphism of apolipoprotein C1 M. S. Wroblewski et al.
4710 FEBS Journal 273 (2006) 4707–4715 ª 2006 The Authors Journal compilation ª 2006 FEBS
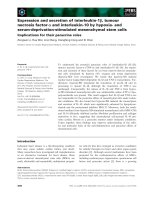
Increased susceptibility to N-terminal truncation
in vivo and in vitro
In the plasma, peak intensity ratios suggested that the
S45 protein was more highly truncated than the T45
protein (Fig. 1). In fact, T45 occurs midway in an am-
phipathic helix that participates in lipid contact [22]
(Fig. 4). The S45 variant would have one fewer methyl
groups at the lipid interface, giving a theoretical differ-
ence in free energy of lipid binding of +0.68 kcalÆmol
)1
[23] and a threefold change in binding constant at
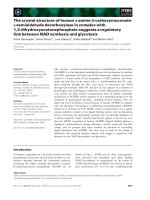
37 °C. In agreement with such a difference, degradation
by dipeptidylpeptidase IV (DPPase) in vitro occurred
approximately 3 times faster for the S45 than the T45
variant (Fig. 5). Lower-affinity lipid contact of the S45
protein may have made this protein more susceptible to
N-terminal truncation in vitro as well as in vivo.
Discussion
This study used MS profile analysis to detect an
altered protein pattern in a subgroup of individuals
with American Indian and Mexican ancestry. We have
not observed this pattern in over 1000 persons of other
ethnic backgrounds. MS fragmentation of a novel pep-
tide from one individual indicated a T45S variant of
ApoC1. To our knowledge, this is the first example of
a structural polymorphism of ApoC1 that has been
found. Circumstantial evidence such as mass difference
from the common protein form and an enhanced level
of N-terminal truncation suggested that all persons
who displayed this pattern had the same structural
modification. Further work is needed to confirm this
prediction.
Several lines of evidence suggest that S45 ApoC1
differed functionally from the T45 protein. First of
all, peak intensities in the profile suggest that the S45
protein was more highly processed by N-terminal
truncation than the T45 protein. Use of peak inten-
sity ratios to estimate relative protein abundance
depends on equal crystallization of the protein in the
matrix and equal ionization of the proteins in the
mass spectrometer. This assumption appears quite
good for nearly identical structures [19] such as the
proteins of a polymorphism pair (see also TTr,
Fig. 1C). Other quantitative evaluations presented in
this study were even less dependent on identical prop-
erties. For example, the method used to estimate the
rates of digestion by DPPase and the different distri-
butions of the S45 variant among lipoprotein classes
used comparison of peak ratios in different samples.
The conclusions from these experiments were not
dependent on identical ionization of the two peptides
but only on identical relative ionization of the two
species in different samples.
Variant proteins with identical function are synthes-
ized and utilized at identical rates and should be pre-
sent at equal concentrations in a sample. If the
variants have nearly identical chemical properties, they
should give peaks of identical intensity in the mass
spectrometer. Indeed, most polymorphisms observed in
our studies have presented double peaks of nearly
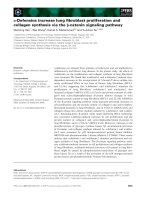
T45-Methyl
Fig. 4. Molecular model of ApoC1. Structure 1 of the 35–53 pep-
tides of ApoC1 in complex with SDS micelles [22] is depicted in
RASMOL. The helix is in a space-filled model with hydrophobic side
chains projecting upward in cpk color and the N-terminus on the
right. Basic residues are in blue, and acidic residues in red. The
methyl group of T45 is identified.
-0.4
-0.8
-1.2
0 100
Time, min
In(Fraction full length Protein)
Fig. 5. First-order decay plots for degradation of ApoC1 by hog kid-
ney DPPase. Results are for the common (m ⁄ z ¼ 6632, r, k ¼
)0.0022) and low-mass (m ⁄ z ¼ 6618, m, k ¼ )0.0069) variants of
ApoC1. MS settings were as described in the legend to Fig. 3.
Means ± SD from three experiments are shown.
M. S. Wroblewski et al. Structural polymorphism of apolipoprotein C1
FEBS Journal 273 (2006) 4707–4715 ª 2006 The Authors Journal compilation ª 2006 FEBS 4711
identical intensity (TTr in Fig. 1, example in ref [19]
and unpublished results). In contrast, functionally dif-
ferent proteins often give peaks of unequal intensity
because of unequal rates of biosynthesis, utilization, or
degradation. Variants of TTr that are associated with
pathophysiology often show unequal peak intensities
[24,25]. The results for ApoC1 suggest that unequal
abundance applied to the full-length, low-mass variant
of ApoC1 (m ⁄ z ¼ 6618, Fig. 1) which showed lower
intensity than the common variant (m ⁄ z ¼ 6632). In
contrast, the truncated, low-mass variant was often
slightly more intense than the truncated, common vari-
ant. These properties suggest that the S45 variant was
more susceptible to truncation in the plasma, a conclu-
sion supported by increased rates of degradation by
DPPase in vitro.
The enzyme thought to be responsible for truncation
of ApoC1 in vivo is DPPase [20], an important regula-
tor of insulin production through its inactivation of
the incretins, hormones that enhance insulin produc-
tion [26]. Reduced activity of DPPase occurs in per-
sons with diabetes [27], and reduced truncation of
ApoC1 was observed in a case of hyperlipidemia [20].
The physical properties of ApoC1 led others to suggest
that the N-terminus is responsible for its regulatory
interactions [28]. ApoC1 in HDLs [7] and an N-ter-
minal 38-residue form of ApoC1 are able to inhibit
cholesterol ester transferase [6]. Potential regulation of
several lipase enzymes [3–5] increases the question of a
role for truncation in protein–protein interactions. If
truncation serves a biological function, it may enhance
the functional differences between the S45 and T45
variants of ApoC1.
A functional importance of a methyl group side
chain at position 45 was also suggested by homology
alignment. ApoC1 from six available species shows
either Ala or Thr at the comparable position (Table 2).
The Ala-Phe or Thr-Phe motif is common at two
locations of ApoC1 (Table 2), and this combination
may provide unique properties for interaction with
lipoproteins.
Future studies are needed to determine whether
the T45S variation is common to all people who dis-
play this profile, the possible effects of the T45S
variant on lipid metabolism, and the role of N-ter-
minal truncation of ApoC1 in vivo. The T45S variant
may offer an excellent tool for future studies with
models such as transgenic animals, as it provides a
form of ApoC1 that is more susceptible to trunca-
tion in vivo. Studies related to these questions are in
progress.
Experimental procedures
Materials
Alpha-cyano-4-hydroxycinnaminic acid, HPLC-grade tri-
fluoroacetic acid, and hog kidney DPPase IV were from the
Sigma Chemical Co. (St Louis, MO, USA). Sinapinic acid
was from Roche (Mannheim, Germany), and sequencing-
grade Glu-C protease was from Roche, Inc. (Indianapolis,
IN, USA). HPLC-grade acetonitrile was from Mallinckrodt
Baker Inc. (Paris, KY, USA).
Protein profile analysis
The procedure to obtain MALDI-TOF protein profiles of
plasma has been described elsewhere [19] along with prop-
erties and identification of the proteins in the profile. The
method applied a very consistent extraction method to
plasma proteins using reverse-phase C4 column material
(the C4 ZipTip from Millipore Inc., Bedford, MA, USA).
This method is applied directly to diluted plasma or serum
without removal of abundant proteins. Abundant proteins
such as albumin and immunoglobulins do not appear in
the profile with this method. Use of alternative matrices or
other changes does allow detection of the abundant pro-
teins. However, the profile method provides a consistent
spectrum of plasma proteins such as ApoC1 ( 40 lgÆ mL
)1
versus nearly 40 mgÆmL
)1
) with high precision. Sinapinic
acid was used as the matrix, and the sample was analyzed
in a Bruker Biflex III MALDI-TOF mass spectrometer
operating in the linear mode. Five hundred laser shots
(attenuation of 39%) were collected. The data was
smoothed using software (Bruker Daltonics xtof version
5.1.1) provided with the Biflex III (Golay-Savitzky formula
using 15 points), and background was subtracted. The pro-
files were analyzed by peak intensity ratios, a very accurate
method for comparison of protein concentrations in differ-
ent samples [19]. When necessary, resolution was increased
by use of greater laser attenuation with accumulation of
1000 or 2000 laser shots.
Table 2. Sequence homology of ApoC1 from different species.
From Swiss-Prot Data Bank ( Hydropho-
bic residues are in bold, and residues homologous to position 45 of
human ApoC1 are in large type. This is residue number 49 in dog,
mouse, rat, and tree shrew.
Sequence Species
ELSAKMREWFSE
SFQKVKEKLKIDS Human S45
ELSAKMREWFSE
TFQKVKEKLKIDS Human
EFPAKTRDWFSE
TFRKVKEKLKINS Baboon
DIPAKTRNWFSE
AFKKVKEHLKTAFS Dog
EILTKTRAWFSE
AFGKVKEKLKTTFS Mouse
EIMIKTRNWFSE
TLNKMKEKLKTTFA Rat
DLPAKTRNWFTE
TFGKVRDTFKATFS Tree shrew
Structural polymorphism of apolipoprotein C1 M. S. Wroblewski et al.
4712 FEBS Journal 273 (2006) 4707–4715 ª 2006 The Authors Journal compilation ª 2006 FEBS
Protein identification
Plasma (1.1 mL) was centrifuged at 160 000 g for 4 h in a
Beckman table-top ultracentrifuge. The solution was aspir-
ated from the top of the tube into 20 equal fractions.
MALDI-TOF profile analysis was conducted on each frac-
tion. For protein identification, the upper three fractions
were pooled, and 20 lL was applied to one channel of an
SDS ⁄ polyacrylamide gel with standard ApoC1 (CalBio-
chem, San Diego, CA, USA) in an adjacent channel. One-
dimensional SDS ⁄ PAGE was performed on a Bio-Rad
(Hercules, CA, USA) Protean II xi system using 12%
Tris ⁄ Tricine gels (16 cm · 16 cm). The gel was stained with
Coomassie blue, the protein band corresponding to ApoC1
was excised, and the gel slices were subjected to in-gel
digestion with sequence-grade Glu-C protease. The diges-
tion and extraction of the peptides from the gel were
accomplished by standard procedures. Peptide fingerprint
maps of the digested proteins were obtained in both the
Bruker Biflex III operating in the reflectron mode and in a
QSTAR o-MALDI mass spectrometer (Applied Biosystems
Inc., Bellarica, CA, USA). MS ⁄ MS analysis was conducted
with the QSTAR o-MALDI mass spectrometer. The TOF
region acceleration voltage was 4 kV, and the injection
pulse repletion was 4.9 kHz with a pulse time of 18 ls. The
pulses were generated by a nitrogen laser at 337 nm with
an energy of 9 lJ and a repetition rate of 19 Hz. Each
spectrum was the sum of 300 laser shots. The tandem mass
spectral data was collected using a collision energy of 37
(unitless). External calibration was performed with human
angiotensin II (monoisotopic [MH+] m ⁄ z 1046.5417;
Sigma) and adrenocorticotropin (ACTH) fragment 18–39
(monoisotopic [MH+] m ⁄ z 2465.1989; Sigma). Spectra
were analyzed with bioanalyst software (Applied Biosys-
tems, Inc.). The software, set at a tolerance of 100 p.p.m.,
identified a, b, y and internal ions.
Enzyme degradation
Plasma (5 lL) that displayed the double peak for ApoC1
was diluted to 140 lL with Tris ⁄ HCl (0.05 m,
pH 8.0) ⁄ 0.1 m NaCl buffer. DPPase (10 lLof1UÆmL
)1
)
was added, and the mixture incubated at 37 °C. Aliquots
(15 lL) were removed at 20-min intervals, acidified with
0.5 lL 10% trifluoroacetic acid, extracted with a C4
ZipTip by standard procedure [19], and analyzed by the
protein profile method. The fraction of full-length ApoC1
was determined from the peak intensity of full-length pro-
tein divided by the sum of intensities for full-length and
truncated ApoC1. The rate constant for disappearance of
ApoC1 was determined from a first-order decay plot, and
standard deviation from triplicate experiments. The analy-
sis was applied to both variants of ApoC1 in the same
sample, thereby eliminating the need for intersample
comparison.
Research subjects
All research subjects and studies were conducted with
approval by the institutional review board of the University
of Minnesota, and informed consent was obtained for pro-
tein analysis of the samples to discover biomarkers. Blood
was obtained by venepuncture, anticoagulated with sodium
citrate, and centrifuged to obtain plasma. Samples were
from individuals studied in conjunction with several pro-
jects designed to detect biomarkers related to obesity, insu-
lin resistance, diabetes, graft versus host disease, heart
disease, sepsis and a number of other conditions. Many
were healthy individuals, representing extensions of pub-
lished studies [19,29,30]. The ethnic background of at least
1000 subjects was typical of the American Midwest with
90% of European ancestry and 5% each of African
and Asian ancestry. An exception was the targeted analysis
of 228 persons with American Indian ancestry and 86 per-
sons of Mexican ancestry. These groups were self-identified
by ethnic background and confirmed by independent phe-
notype evaluation. The latter groups provided 44 examples
of the unusual profile shown in this study, which reports
detailed properties of the proteins from one person with
Mexican ancestry.
Acknowledgements
This work was supported in part by the endowment to
the Samuel Kirkwood professorship (GLN). RSK was
supported by a National Hemophilia Clinical Fellow-
ship Award. KM is a Bush Medical Fellow (Bush
Foundation). The mass spectrometry and parts of the
gel electrophoresis were conducted with the assistance
of Mr Thomas Krick, Drs LeeAnn Higgins, Lorraine
Anderson, Sudha Marimanikkuppam and Bruce
Witthuhn of the Center for Mass Spectrometry and
Proteomics at the University of Minnesota (Director
GLN). We acknowledge the expert technical assistance
of Ms Julia Nguyen and other volunteers who assisted
in sample procurement.
References
1 Weisgraber KH, Mahley RW, Kowal RC, Herz J,
Goldstein JL & Brown MS (1990) Apolipoprotein C–I
modulates the interaction of apolipoprotein E with
beta-migrating very low density lipoproteins (beta-
VLDL) and inhibits binding of beta-VLDL to low den-
sity lipoprotein receptor-related protein. J Biol Chem
265, 22453–22459.
2 Liu M & Subbaiah PV (1993) Activation of plasma
lysolecithin acyltransferase reaction by apoli-
poproteins A-I, C-I and E. Biochim Biophys Acta 1168,
144–152.
M. S. Wroblewski et al. Structural polymorphism of apolipoprotein C1
FEBS Journal 273 (2006) 4707–4715 ª 2006 The Authors Journal compilation ª 2006 FEBS 4713
3 Conde-Knape K, Bensadoun A, Sobel JH, Cohn JS &
Shachter NS (2002) Overexpression of apoC-I in apoE-
null mice: severe hypertriglyceridemia due to inhibition
of hepatic lipase. J Lipid Res 43, 2136–2145.
4 Berbee JF, van der Hoogt CC, Sundararaman D, Hav-
ekes LM & Rensen PC (2005) Severe hypertriglyceride-
mia in human APOC1 transgenic mice is caused by
apoC-I-induced inhibition of LPL. J Lipid Res 46, 297–
306.
5 Poensgen J (1990) Apolipoprotein C-1 inhibits the
hydrolysis by phospholipase A2 of phospholipids in
liposomes and cell membranes. Biochim Biophys Acta
1042, 188–192.
6 Kushwaha RS, Hasan SQ, McGill HC Jr, Getz GS,
Dunham RG & Kanda P (1993) Characterization of
cholesteryl ester transfer protein inhibitor from plasma
of baboons (Papio sp.). J Lipid Res 34, 1285–1297.
7 Gautier T, Masson D, de Barros JP, Athias A, Gambert
P, Aunis D, Metz-Boutigue MH & Lagrost L (2000)
Human apolipoprotein C-I accounts for the ability of
plasma high density lipoproteins to inhibit the choles-
teryl ester transfer protein activity. J Biol Chem 275,
37504–37509.
8 Cohn JS, Tremblay M, Boulet L, Jacques H, Davignon
J, Roy M & Bernier L (2003) Plasma concentration and
lipoprotein distribution of ApoC-I is dependent on
ApoE genotype rather than the Hpa I ApoC-I promoter
polymorphism. Atherosclerosis 169, 63–70.
9 Shachter NS, Rabinowitz D, Stohl S, Conde-Knape K,
Cohn JS, Deckelbaum RJ, Berglund L & Shea S
(2005) The common insertional polymorphism in the
APOC1 promoter is associated with serum apolipopro-
tein C-I levels in Hispanic children. Atherosclerosis
179, 387–393.
10 Gao L, Gabriel C, Lavoie TYe & SQ (2002) An
improved RSP method to detect HpaI polymorphism in
the apolipoprotein C-1 gene promoter. BMC Med Genet
3, 13.
11 Shi J, Zhang S, Ma C, Liu X, Li T, Tang M, Han H,
Guo Y, Zhao J, Zheng K, et al. (2004) Association
between apolipoprotein CI HpaI polymorphism and
sporadic Alzheimer’s disease in Chinese. Acta Neurol
Scand 109, 140–145.
12 Retz W, Thome J, Durany N, Harsanyi A, Retz-Jungin-
ger P, Kornhuber J, Riederer P & Rosler M (2001)
Potential genetic markers of sporadic Alzheimer’s
dementia. Psychiatr Genet 11, 115–122.
13 Muurling M, van den Hoek AM, Mensink RP, Pijl H,
Romijn JA, Havekes LM & Voshol PJ (2004) Overex-
pression of APOC1 in obob mice leads to hepatic stea-
tosis and severe hepatic insulin resistance. J Lipid Res
45, 9–16.
14 Jong MC, Voshol PJ, Muurling M, Dahlmans VE,
Romijn JA, Pijl H & Havekes LM (2001) Protection
from obesity and insulin resistance in mice
overexpressing human apolipoprotein C1. Diabetes 50,
2779–2785.
15 Koopmans SJ, Jong MC, Que I, Dahlmans VE, Pijl H,
Radder JK, Frolich M & Havekes LM (2001) Hyperli-
pidaemia is associated with increased insulin-mediated
glucose metabolism, reduced fatty acid metabolism and
normal blood pressure in transgenic mice overexpressing
human apolipoprotein C1. Diabetologia 44, 437–443.
16 Pullinger CR, Zysow BR, Hennessy LK, Frost PH,
Malloy MJ & Kane JP (1993) Molecular cloning and
characteristics of a new apolipoprotein C-II mutant
identified in three unrelated individuals with hypercho-
lesterolemia and hypertriglyceridemia. Hum Mol Genet
2, 69–74.
17 Inadera H, Hibino A, Kobayashi J, Kanzaki T, Shirai
K, Yukawa S, Saito Y & Yoshida S (1993) A missense
mutation (Trp 26 fi Arg) in exon 3 of the apolipopro-
tein CII gene in a patient with apolipoprotein CII defici-
ency (apo CII-Wakayama). Biochem Biophys Res
Commun 193, 1174–1183.
18 Eckardstein, Av Holz H, Sandkamp M, Weng W,
Funke H & Assmann G (1991) Apolipoprotein C-III
(Lys-58 fi Glu). Identification of an apolipoprotein
C-III variant in a family with hyperalphalipoproteine-
mia. J Clin Invest
87, 1724–1731.
19 Nelsestuen GL, Zhang Y, Martinez MB, Key NS, Jilma
B, Verneris M, Sinaiko A & Kasthuri RS (2005) Plasma
protein profiling: unique and stable features of the
plasma proteome. Proteomics 5, 4012–4024.
20 Bondarenko PV, Cockrill SL, Watkins LK, Cruzado ID
& Macfarlane RD (1999) Mass spectral study of poly-
morphism of the apolipoproteins of very low density
lipoprotein. J Lipid Res 40, 543–555.
21 Jacobson DR, Alves IL, Saraiva MJ, Thibodeau SN &
Buxbaum JN (1995) Transthyretin series 6 gene fre-
quency in individuals without amyloidosis. Hum Genet
95, 308–312.
22 Rozek A, Buchko GW & Cushley RJ (1995) Conforma-
tion of two peptides corresponding to human apolipo-
protein C-I residues 7–24 and 35–53 in the presence of
sodium dodecyl sulfate by CD and NMR spectroscopy.
Biochemistry 34, 7401–7408.
23 Fersht, A. (1984) Enzyme Structure and Mechanism, 2nd
edn, p 300. W. H. Freeman and Company, New York.
24 Bergen HR, 3rd, Zeldenrust, SR & Naylor, S (2003) An
on-line assay for clinical detection of amyloidogenic
transthyretin variants directly from serum. Amyloid 10,
190–197.
25 Bergen HR, 3rd, Zeldenrust SR, Butz ML, Snow DS,
Dyck PJ, Klein CJ, O’Brien JF, Thibodeau SN & Mud-
diman DC (2004) Identification of transthyretin variants
by sequential proteomic and genomic analysis. Clin
Chem 50, 1544–1552.
26 Lameir AM, Durinx C, Scharpe S & Meester ID (2003)
Dipeptidyl-peptidase IV from bench to bedside: An
Structural polymorphism of apolipoprotein C1 M. S. Wroblewski et al.
4714 FEBS Journal 273 (2006) 4707–4715 ª 2006 The Authors Journal compilation ª 2006 FEBS
update on structural properties, functions, and clinical
aspects of the enzyme DPP IV. Crit Rev Clin Labora-
tory Sci 40, 209–294.
27 Meneilly GS, Demuth HU, McIntosh CH & Pederson
RA (2000) Effect of ageing and diabetes on glucose-
dependent insulinotropic polypeptide and dipeptidyl
peptidase IV responses to oral glucose. Diabet Med 17,
346–350.
28 Rozek A, Sparrow JT, Weisgraber KH & Cushley RJ
(1998) Sequence-specific 1H NMR resonance assign-
ments and secondary structure of human apolipoprotein
C-I in the presence of sodium dodecyl sulfate. Biochem
Cell Biol 76, 267.
29 Nelsestuen GL, Martinez MB, Hertz MI, Savik K &
Wendt CH (2005) Proteomic identification of human
neutrophil alpha-defensins in chronic lung transplant
allograft rejection. Proteomics 5, 1705–1713.
30 Zhang Y, Wroblewski M, Hertz M, Wendt C,
Cervenka T & Nelsestuen GL (2005) Analysis of
chronic lung transplant rejection by MALDI-TOF
profiles of bronchoalveolar lavage fluid. Proteomics 6,
1001–1012.
M. S. Wroblewski et al. Structural polymorphism of apolipoprotein C1
FEBS Journal 273 (2006) 4707–4715 ª 2006 The Authors Journal compilation ª 2006 FEBS 4715