Evaluation of the impact of transient interruption of antiangiogenic treatment using ultrasound-based techniques in a murine model of hepatocellular carcinoma
Bạn đang xem bản rút gọn của tài liệu. Xem và tải ngay bản đầy đủ của tài liệu tại đây (3.44 MB, 9 trang )
Marinelli et al. BMC Cancer 2014, 14:403
/>
RESEARCH ARTICLE
Open Access
Evaluation of the impact of transient interruption
of antiangiogenic treatment using
ultrasound-based techniques in a murine model
of hepatocellular carcinoma
Sara Marinelli1†, Veronica Salvatore1†, Marco Baron Toaldo2, Maddalena Milazzo3, Luca Croci1, Laura Venerandi1,
Anna Pecorelli1, Chiara Palamà1, Alessia Diana2, Luigi Bolondi1 and Fabio Piscaglia1*
Abstract
Background: Development of escape pathways from antiangiogenic treatments was reported to be associated
with enhanced tumor aggressiveness and rebound effect was suggested after treatment stop. Aim of the study was
to evaluate tumor response simulating different conditions of administration of antiangiogenic treatment (transient
or definitive treatment stop) in a mouse model of hepatocellular carcinoma.
Methods: Subcutaneous tumors were created by inoculating 5×10⁶ Huh7 cells into the right flank of 14 nude mice.
When tumor size reached 5–10 mm, mice were divided in 3 groups: group 1 was treated with placebo, group 2
was treated with sorafenib (62 mg/kg via gavage) but temporarily suspended from day +5 to +9, whereas in group
3 sorafenib was definitively stopped at day +5. At day +13 all mice were sacrificed, collecting masses for Western-Blot
analyses. Volume was calculated with B-mode ultrasonography at day 0, +5, +9, +11 and +13. VEGFR2-targeted
contrast-enhanced ultrasound using BR55 (Bracco Imaging) was performed at day +5 and +13 and elastonosography
(Esaote) at day +9 and +11 to assess tumor stiffness.
Results: Median growth percentage delta at day +13 versus day 0 was 197% (115–329) in group 1, 81% (48–144) in
group 2 and 111% (27–167) in group 3. Median growth delta at day +13 with respect to day +5 was 79% (48–127),
37% (−14128) and 81% (15–87) in groups 1, 2 and 3, respectively. Quantification of targeted-CEUS at day +13 showed
higher values in group 3 (509 Arbitrary Units AI, range 293–652) than group 1 (275 AI, range 191–494) and group
2 (181 AI, range 63–318) (p = 0.033). Western-Blot analysis demonstrated higher VEGFR2 expression in group 3 with
respect to group 1 and 2.
Conclusions: A transient interruption of antiangiogenic treatment does not impede restoration of tumor
response, while a definitive interruption tends to stimulate a rebound of angiogenesis to higher level than
without treatment.
Keywords: Hepatocellular carcinoma, Antiangiogenic treatment, Molecular contrast-enhanced ultrasonography,
Elastosonography
* Correspondence:
†
Equal contributors
1
Department of Medical and Surgical Sciences, University of Bologna and S.
Orsola-Malpighi Hospital, Bologna, Italy
Full list of author information is available at the end of the article
© 2014 Marinelli et al.; licensee BioMed Central Ltd. This is an Open Access article distributed under the terms of the Creative
Commons Attribution License ( which permits unrestricted use, distribution, and
reproduction in any medium, provided the original work is properly credited. The Creative Commons Public Domain
Dedication waiver ( applies to the data made available in this article,
unless otherwise stated.
Marinelli et al. BMC Cancer 2014, 14:403
/>
Background
Antiangiogenic treatments have become the mainstay of
oncologic treatments in a variety of cancers [1-3]. Such
treatment does not produce complete tumor necrosis,
but delay tumor progression and is therefore to be utilized
continuatively as a chronic therapy.
However, even in presence of tumor response, unfortunately adverse events may develop requiring transient
or permanent drug interruption. At treatment stopping,
neoangiogenesis becomes intensively stimulated through
the usual pathways previously blocked by the drug and
through alternative pathways induced by the drug treatment, through the activation of pre-existing invasion
program or cancer cell phenotypic change and selection
of clones resistant to hypoxia [4-6].
A 10-fold higher incidence of invasive carcinomas at 1,
2 and 3 weeks after withhold of therapy stop have been
reported as well as a rapid volume increase [4,7]. Thus,
the maintenance of antiangiogenic treatments even during progression may be justified in order to prevent such
rebound effect of tumor neoangiogenesis [8].
Sorafenib is the only drug currently approved for advanced Hepatocellular Carcinoma (HCC) and acts by
blocking Vascular Endotelial Growth Factor Receptor 2
(VEGFR2), Platelet Derived Growth Factor Receptor
(PDGFR), Raf-1, B-Raf and c-kit among others [9]. Like
other antiangiogenic treatments, it aims at blocking
neoangiogenesis and/or tumor cell proliferation rather
than acting through a direct cytotoxic necrotizing effect, making dimensional criteria poorly performant to
evaluate tumor response.
Molecular contrast-enhanced ultrasound (CEUS) involves the use of molecularly-targeted microbubbles (MBs)
with potentialities in oncology ranging from cancer detection or characterization to assessment of response to treatment. In order to avoid streptavidin and biotin as linking
agents, which are potentially immunogenic, a new conjugation method has been recently reported, where VEGFR2
targeted lipopeptide are directly incorporated into the
MB shell [10]. In this way, they can be used in humans
and an early study in 12 patients has already been performed [11]. These targeted MBs allow to identify sites
of active neoangiogenesis, like those occurring in tumoral tissue, whilst healthy parenchyma present only
minimal and non specific MBs binding [12]. Their binding specificity to VEGFR2, attachment to blood vessels
and utility in monitoring antiangiogenetic treatment have
already been reported [13,14]. Moreover, a direct correlation between quantification of VEGFR2-targeted CEUS
and immunohistochemical analysis has been demonstrated
also in very small tumors [15].
Elastosonography is an ultrasound based technique
able to evaluate the elastic proprieties of a tissue by analyzing the strain in response to a manual compression in
Page 2 of 9
a totally non invasive way [16-18]. We have recently
demonstrated its utility in the identification of tumor
responding to antiangiogenetic treatment, based on the
observation that a softening occurs in good responders
at 2 days from the beginning of treatment [19].
The present study aims to evaluate the efficacy of sorafenib, an antiangiogenic drug, in a murine model of HCC
submitted to different treatment interruption schedules,
correlating treatment outcomes with molecular mechanism explored with novel ultrasound based techniques.
Methods
Experimental model
The human cell line Huh7 (ATCC cell bank, VA, USA)
was maintained and expanded using standard cell culture
technique in high glucose Dulbecco’s Modified Eagle
Medium supplemented with L-glutamine, 1% ampicillin/
amphotericin B and 10% fetal bovine serum (Gibco, Italy).
Heterotopic tumors were created by subcutaneous injection into the right flank of 6–8 weeks old female nude
CD1 mice (Charles River, Italy) of 5×10⁶ cells suspended
in sterile phosphate-buffered saline (Gibco, Italy) for a
total volume of 0.2 mL per injection. Mice were maintained with unrestricted regular mouse chow and water
in a temperature- and humidity controlled room kept
on a 12-hour light/dark circle and specific pathogenfree environment. Twenty animals have been inoculated
and masses grew in 16 of them. Mice were randomized
in three groups: group 1 was treated with placebo, group
2 was treated with sorafenib (BAY 43–9006; Bayer,
Germany) at a dosage of 62 mg/Kg by oral gavage daily
until day +5, then with placebo until day +9, when sorafenib was started again (at the same dosage) until day +13,
and group 3 was treated with sorafenib (at the same dosage) until day +5 and then with placebo. Sorafenib was
formulated as previously described [9]. Growth of established xenograft tumors was monitored at least twice
weekly by ultrasound. The experimental protocol was approved by the veterinary university animal welfare committee (Comitato Etico Scientifico per la Sperimentazione
Animale, University of Bologna).
Ultrasound, elastosonography and molecular imaging
experiments
Ultrasound examinations were performed using a MyLab90
Twice (Esaote, Italy) equipped with a broadband 4–
13 MHz probe. Mice were anesthetized with an intraperitoneal solution constituted by one part of ketamine
10% (Ketavet, Intervent Production s.r.l., Italy), one part
of xylazine 20 mg/mL (Rompun, Bayer AG, Germany)
and eight parts of sterile water, for a total of 0.2 mL.
Then animals were placed on a temperature controlled
heated support to keep constant the body temperature for
the whole duration of measurements. A layer of warmed
Marinelli et al. BMC Cancer 2014, 14:403
/>
ultrasound gel was placed over the skin of tumors for
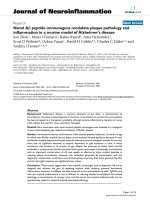
B-mode, elastosonography and molecular-CEUS examinations (Figure 1). Tumor volume was calculated using
the formula: height × width × thickness/2 measured by
ultrasound, considering the respective longest diameter
(Figure 1). When tumors reached 5–10 mm in diameter,
mice were included in the 13-days protocol and then
volume was monitored at day 0, +5, +9, +11 and +13.
Elastosonography was performed by a single operator.
As explained elsewhere [19], the deformability of tumor
tissue in response to a manual strain applied perpendicularly to the skin by the operator is depicted as colourcoded images. The same condition of brightness, contrast,
intensity and gain were used in all the examinations as
well as attention was paid to scan the tumor across its
longest transversal section. A pad of known constant
and homogeneous consistency (Zerdine, CIRS, Norfolk
Virginia, USA) was interposed between the probe and the
tumor because strain imaging modalities do not provide
absolute measurements of tissue stiffness. In this way, the
elasticity of the tumor was correlated with the same reference standard in all experiments and changes over time in
stiffness were assessed by the changes in such ratio. Details
of the modality have been described in a previous study of
our group [19] and were maintained identical. Three measurements were performed in each tumor during anaesthesia and the mean value was used for following analyses.
Higher ratio indicates greater tumor elasticity (i.e. softer
tissues) (Figure 1). The entire elastographic procedure
lasted approximately 2 minutes per mice and was performed at day +9 and +11 in order to evaluate non invasively
the different behaviour of tumours when the treatment
with sorafenib was started again in group 2.
For contrast enhanced ultrasonography with VEGFR2targeted MBs, the probe was placed on a fixed mechanical
Page 3 of 9
support in order to maintain the same scanned section of
the tumor for the whole duration of the US exam. A contrast specific software (Contrast Tuned Imaging, CnTI)
was activated in a dual display modality (B-mode window
and contrast window) in order to be sure to scan the correct area. The following US setting were used and maintained for all experiments: dynamic range, 7 dB; acoustic
power, 30 kPa; mechanical index, 0.03; depth, 22–37 mm;
midscale time-gain compensation, linear.
VEGFR-2 targeted MBs contrast agent (BR55, Bracco
Imaging, Switzerland) was reconstituted by injecting
2 ml of a sterile 5% glucose solution through the septum
of the vial. A volume of 1.7 μl/g of MB suspension
(2.4×10⁷ MBs) was injected into the mouse venous circulation through the retro-orbital sinus. Immediately after
the injection a 30 seconds continuous video clip was acquired at low MI. A second 30 seconds long video clip
was acquired starting from 5 minutes and 55 seconds
after injection. At 6 minutes the MBs present in the field
of view containing the tumor were destroyed by temporarily (1 second) increasing the acoustic power (MI 1.9).
The subsequent 18 seconds were utilized to assess still
circulating MBs. This process is called destructionreplenishment analysis [20]. The same procedure protocol
was repeated at day +5 (when group 2 and group 3 were
on treatment) and at day +13 (when only group 2 was on
treatment).
Post processing analysis of the destruction-replenishment
video clips, recorded as DICOM files, was performed using
a prototype software (Bracco Suisse SA, Switzerland). This
software is designed to quantify contrast echo-power within
a region of interest (ROI) enclosing the entire tumor area.
Before proceeding to quantification, the analysis first applies linearization of signal intensity at the pixel levels to
reverse the effects of “log” compression in the ultrasound
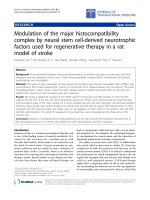
Figure 1 B-mode, elastonosonography and contrast enhanced ultrasonography with VEGFR2 targeted microbubbles images. B-mode
ultrasonography (panel A) was used to calculate tumor dimensions whereas elastosonography (panel B) allowed to evaluate the elasticity of the
tumor with respect to a pad with costant elasticity. Elasticity ratio is reported (ELX2/1) as well as histogram of elasticity distribution. In panel C,
contrast enhanced ultrasonography with VEGFR2 targeted microbubbles images immediately before the high mechanical index flash (5 minutes
and 59 seconds) is shown (upper part of the panel). Time intensity curve (lower part of panel C) was created using a dedicated software to calculate differential targeted enhancement (dTE).
Marinelli et al. BMC Cancer 2014, 14:403
/>
system. Contrast enhancement in the ROI was expressed
as relative echo-power values, which are proportional to
the number of MBs in the selected ROI. The software
automatically recognizes the high MI frames, and it considers for quantification only the 2 seconds before the high
MI period and the 10 seconds following the 15th second
after the flash. The signal intensity after destruction (TEad)
was subtracted from signal intensity determined before
destruction (TEbd) in order to obtain the differential targeted enhancement (dTE = TEbd-TEad). Since the TEbd expresses both the circulating and the bound MBs, whereas
TEad only the circulating MBs, the difference between
them (dTE) represents a numeric value proportional to
the amount of MBs bound to the target receptor VEGFR2
(Figure 1).
The 30 first seconds clip taken in the arterial phase
were evaluated blindly and independently by two operators in order to quantify visually the percentage of non enhanced (hence non perfused) areas. Rate of non-enhanced
areas were quantified using a 10% step scale through
visualization of tumor perfusion at peak enhancement.
In case of mismatch, the final decision was achieved by
consensus.
Necropsy
At day +13 after the last measurement and still under
anaesthesia, all animals were euthanized by 0.1 mL of a
solution of embutramide, mebezonium iodide and tetracaine hydrochloride (Tanax, Intervet Italia s.r.l., Italy)
and tumors were cut in two halves: one immersed in liquid nitrogen and then stored at −80°C for Western-Blot
analyses and one stored in 4% paraformaldehyde and used
for histopathology.
Western-blot analysis
Two polyclonal antibodies against VEGFR2 (Cell Signaling
Technology, Inc. Danversa, MA, USA) (diluted at 1:1000)
and HIF-1α (Santa Cruz Biotechnology, Inc. Santa Cruz,
CA, USA) (diluted at 1:200) were incubated separately for
16 hours at 4°C. A horseradish conjugated secondary antibody (labeled polymer-HRP antirabbit, Envision system
DAKO Cytomation, Carpinteria, CA, USA) was incubated
for 45 minutes at room temperature and the corresponding
band was revealed using the enhanced chemoluminescence
method (Amersham, UK). Digital images of autoradiographies were acquired and quantified with ChemiDoc™
XRS + (Image Lab™ Software, Bio-Rad).
Images were calibrated against a reference autoradiography and given in relative density units (d.u.). After autoradiography acquisition, the membranes were stripped and
reprobed for two hours at room temperature with antiβ-actin antibody (Santa Cruz Biotechnology, Inc. Santa
Cruz, CA, USA) to normalize protein loading. A ratio
between VEGFR2 or HIF-1α and β-actin corresponding
Page 4 of 9
bands was used to quantify the levels of each protein
(normalized value).
Three randomly selected samples of each group were
used for Western-Blot analyses.
Histopathology
Tumors samples, taken at autopsy and fixed in 10%
phosphate-buffered formalin for 12 to 24 hours, were
embedded in paraffin for histological processing. Four-micron
sections were then stained with standard hematoxylin-eosin
for histological examination that was performed by two
examiners blinded to treatment protocols, assessing the
presence of necrosis and of vascular structures. In case of
discrepancy, a consensus was reached after discussion.
Statistical evaluation
Data are presented as median (range). Differences between
groups were assessed using the Mann–Whitney test or
Kruskal-Wallis test as appropriate. Differences among different time points in the same group were analyzed using
the Wilcoxon signed Rank test. Spearman test was used
for correlation analysis. Modifications among different
time points of various variables (volume, elasticity and
dTE), expressed as percentage delta, were calculated using
the formula [(final value − starting value)/starting value] %.
P < 0.05 was considered significant. Statistical analysis was
performed using SPSS 16.0 (Chicago Il, USA).
Results
Tumor size increase
The study group comprised 14 mice, 4 included in group
1, 6 in group 2 and 4 in group 3; in fact 2 animals with
fast growing and large masses (1 in group 1 and 1 in
group 3) out of the 16 harbouring tumors were found
dead in the cage before reassessment and hence excluded
from the analysis. Tumor volume at day 0 was 143 mm3
(105–408) in group 1, 174 mm3 (128–190) in group 2 and
121 mm3 (75–648) in group 3 (p = n.s.). At day +13,
tumor volume was 706 mm3 (308–1748) in group 1,
277 mm3 (85–465) in group 2 and 443 mm3 (187–1118)
in group 3, with an increase of 197% (115–329), 81% (48–
144) and 111% (27–167), respectively (p = n.s.).
When tumor volume at day +13 (end of study) were
compared to day +5, when treatment was stopped in group
2 (temporarily) and in group 3 (definitively), the growth increase was 79% (48–127) in group 1, 37% (−14 − +127) in
group 2 and 81% (15–87) in group 3 (p = n.s.), with a relative increase of 1.8, 1.4 and 1.8 folds (Figure 2).
Contrast enhanced ultrasonography with VEGFR2targeted MBs
Contrast-enhanced ultrasonography with VEGFR2-targeted
MBs was performed at day +5 (when sorafenib treatment
was stopped temporarily in group 2 and definitively in
Marinelli et al. BMC Cancer 2014, 14:403
/>
Page 5 of 9
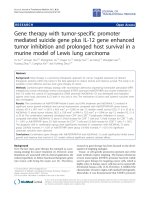
Figure 2 Growth percentage delta with respect to day +5. Growth percentage delta with respect to day 5, when treatment was temporarily
stopped in group 2 and definitively in group 3. Resuming treatment administration in group 2 at day +9 prevented further increase in tumor
dimensions from day +9 to day +13 (+37% day +13 versus day +9, range −14, +127) whereas the definitive treatment stop in group 3 induced a
tumor growth comparable to that of group 1 (placebo group) (respectively 81%, range 15–87, and 79%, range 48–127). Median values and range
are reported.
group 3) and at day +13. dTE values at day +5 were
293 a.u. (121–1340) in group 1, 190 a.u. (62–255) in group
2 and 132 a.u. (79–786) in group 3 (p = n.s.). dTE values at
day +13 were 275 a.u. (191–494) in group 1, 181 (65–318)
in group 2 and 509 a.u. (193–652) in group 3 (p = 0.033
among three groups and p = 0.019 comparing only group
2 and group 3 between them).
dTE percentage delta were +5% (−51 − +91) in group
1, −17% (−46 − +81) in group 2 and +266% (+119 − +730)
in group 3 (p = 0.018 among three groups, p = 0.010 between group 2 and group 3 and p = 0.029 between group
1 and 3).
dTE values remained quite constant in group 1 and 2
(median change of 1 and 0.8 fold, respectively) while
markedly increased in group 3 (median increase of 3.7
fold), suggesting over expression of VEGFR2 in response
to the definitive stop of the treatment, considering both
absolute values and relative changes in dTE between G5
and G13 (in group 3 p = 0.068).
We further evaluated the percentage of enhancement
in the arterial phase, in order to identify the rate of non
perfused (and theoretically hypoxic) areas. Percentage
of non enhanced (necrotic) areas is reported in Table 1.
In particular, at day +13 it was higher in group 1 (30%,
20–50) than in group 2 (15%, 0–30) but especially than
in group 3 (5%, 0–10;), suggesting the effective over
stimulated neoangiogenesis able to perfuse quite all
tumor areas (Figure 3). The difference among the three
groups at day +13 tended to reach the statistical significance (p = 0.059) due to the decrease in necrotic areas
in group 3 (p = n.s. between group 1 and group 2 and
between group 2 and group 3; p = 0.019 between group
1 and group 3).
Western-blot analysis
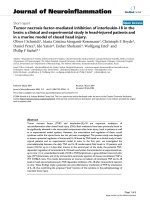
VEGR2 levels at day +13 were higher in group 3 with respect to the other groups (Figure 4), consistent with
contrast-enhanced ultrasonography with VEGFR2-targeted
MBs. In particular, VEGFR2 levels were 0.33 d.u. in group
Table 1 Percentage of non enhanced areas
Day +5
Group 1 (Placebo)
%
20
20
0
20
30
50
10
40
Median values
Group 2 (Sor-Placebo-Sor)
15%
0
30
30
0
10
30
20
20
40
0
Median values
30%
0
Median values
Group 3 (Sor-Placebo)
Day +11
%
0
10%
15%
30
10
10
0
30
10
0
0
20%
5%
p = n.s.
p = 0.059
Rate of non enhanced areas at day +13 was lower in group 3, suggesting that
an over stimulated neoangiogenesis is able to perfuse all tumor. Data are
expressed as individual values of each mass.
Marinelli et al. BMC Cancer 2014, 14:403
/>
Page 6 of 9
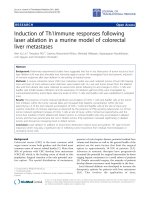
Figure 3 Tumor perfusion at peak enhancement. Representative images of contrast enhanced ultrasonography at peak enhancement in
group 1 (panels A and B), group 2 (panels C and D) and group 3 (panels E and F) at day + 5 (panels A, C and E) and at day +13 (panels B, D and F).
Corresponding B-mode images are shown. At day +13, necrotic areas are present in group 1 (placebo group) and group 2 (sorafenib-placebo-sorafenib
treatment) tumors whereas all tumor areas in group 3 tumors (sorafenib treatment stopped at day +5) are perfused, which might be speculated
to derive from overstimulation of neoangiogenesis.
Figure 4 Western Blot analysis. Representative images of
Western-Blot analysis of VEGFR2 protein expression in tumor
samples. VEGFR2 levels were higher in group 3 with respect to
the other groups.
1, 0.05 d.u. in group 2 and 2.01 d.u. in group 3 (p = 0.061
among the three groups; p = 0.05 between group 1 and
group 3 and between group 2 and group 3; p = n.s. between group 1 and group 2).
Confirmation of the analysis of the arterial enhancement
showing necrotic percentage observed with molecular
CEUS emerged from HIF-1α analysis. Indeed, slightly
higher levels of this protein were present in group 1 (0.52
d.u.) with respect to group 2 (0.47 d.u.) but especially to
group 3 (0.30 d.u.) (p = n.s.), supporting the idea that the
over-stimulated neoangiogenesis in group 3 is able to perfuse quite all tumor areas, reducing hypoxic regions.
In order to exclude any influence of tumor dimension on
HIF-1α expression, a correlation between these two
Marinelli et al. BMC Cancer 2014, 14:403
/>
parameters was performed without reaching any statistical
significance (p = n.s.).
Histopathology
Histopathological analysis of the 14 tumor samples
showed a heterogeneous pattern, with well represented
stromal tissue supporting the xenograft growth and large
neovascular structures in their context. Tumors specimens of group 1 and group 3 appeared richer in vessels
as compared to group 2. In particular, many neoformed
vessels as well as lakes of extravasated erythrocytes were
seen in groups 1 and 3 (Figure 5, panels A and C), and
were almost absent in group 2 (Figure 5, panel B). Necrotic areas, characterized by solid or colliquative changes
with dissolution of cell membranes and faint or absent
nuclei, were seen in all specimens from the three groups.
However they were more prominent in tumors samples
from group 2, in which it was often possible to additionally observe picnotic and fragmented nuclei, suggesting
apoptotic changes. Remarkably, nuclei were morphologically different in the three groups. Namely in group 1 and
group 3 tumor nuclei appeared vesicular, a typical appearance of cells often associated with secretion processes.
Changes in elasticity using elastosonography
Elastosonography measurements were performed at day +9
and +11 in order to evaluate the response of tumors to
the re-introduction of sorafenib treatment in group 2, with
respect to the other groups treated with placebo.
Elasticity ratio at day +9 was 1.34 (0.87–1.49) in group
1, 1.10 (1.04-1.45) in group 2 and 1.14 (1.09-1.19) in
group 3 (p = n.s.). At day +11 elasticity was 1.15 (0.93-1.42)
in group 1, 1.33 (1.07-1.65) in group 2 and 1.08 (0.88-1.28)
in group 3 (p = n.s.). Elasticity increased (corresponding to
tissue softening) only in group 2, confirming our previous
results that an increase in elasticity is an early indicator of
Page 7 of 9
tumor response [19]. In particular, elasticity percentage
delta were −4.56% (−26.65 − +7.28) in group 1, +10.79%
(−3.45 − +55%) in group 2 and −7.50% (−19.02 − +11.27)
in group 3 (Figure 6) (p = n.s.).
Discussion
This study evaluated the effect of transient sorafenib
halting in HCC using VEGFR2-targeted MBs and elastosonography. We demonstrated that an early and
short interruption of antioangiogenic treatment do not
avoid restoration of tumor response while a definitive
interruption stimulates angiogenesis to higher levels than
even in absence of any treatment.
In animal studies a vascular regrowth after angioangiogenic therapy interruption has been reported to be
already present at 2 days after withdrawal [7,21] as well
an enhanced distant metastatization [22]. The proposed
mechanisms that can play a role in these settings are an
upregulation of proangiogenic cytokines and growth
factors, the mobilization of bone-marrow derived cells,
but also host micro-environmental response to multitarget drugs [22]. The rebound progression is primarily
evident at a vascular level [23] and tumors are completely vascularized 7 days after treatment withdrawal
[21]. Beside animal models, this phenomenon has been
suggested also in few human patients with brain or renal
cancers, where the discontinuation of treatment led to
higher risk of progression and metastatization [23,24].
In the present study we demonstrated the rebound progression using imaging methods, namely molecular CEUS
and elastosonography. Indeed, the higher expression of
VEGFR2 demonstrated by molecular CEUS represents the
stimulated neoangiogenesis that occurs after sorafenib withdrawal. On the contrary, the further response of tumor submitted to a second round of treatment is mirrored by the
downregulation in VEGFR2, seen as well with VEGFR2-
Figure 5 Histopathology. Representative pictures of hematoxylin-eosin stained samples from group 1 (placebo, panel A), group 2 (Sor-Placebo-Sor,
panel B) and from group 3 (Sor-Placebo, panel C). Necrotic areas were present in all tumor samples from the three groups. However extensive necrotic
areas, either solid or colliquative, were mostly evident in group 2.
Marinelli et al. BMC Cancer 2014, 14:403
/>
Figure 6 Elasticity percentage delta. Elasticity values increased
(which corresponds to a tissue softening) only in group 2 when
treatment was restarted (+10.8%, range −3.5, +55). Conversely,
treatment elasticity tended to decrease under placebo (−4.6%,
range −26.7 − +7.3 in group 1 and −7.5%, range −19.02, +11.3 in
group 3). Median values and range are reported.
targeted MBs. The confirmation of this further response,
beside dimensional decrease, derives from elastosonography results, where a softening of treated tumors occurred.
HIF-1α represents a key factor in tumor angiogenesis,
being able to activate the transcription of VEGF. During
hypoxia, the activity of hydroxylase is inhibited by the
low oxygen concentration, stabilizing HIF-1α, which is
thus able to translocate into the nucleus where dimerizes
with HIF-1β to activate transcriptional target genes. Our
results are in keeping with others showing that sorafenib
inhibits the synthesis of HIF-1α, leading to a decreased
expression of VEGF [25]. On the other hand, a rapid
growth itself is able to induce hypoxia, and thus the higher
expression of HIF-1α in group 1 is justified. Indeed, the
release of other proangiogenic factors beyond VEGF like
placenta growth factor (PIGF), fibroblast growth factor
and others can be stimulated to supply the hypoxic growing tumor [26]. Finally and more interestingly, the rebound neoangiogenesis that occurs in case of sorafenib
definitive withdrawal allows a quite complete tumor perfusion (as demonstrated also by the arterial enhancement
quantification) leaving only minimal hypoxic areas and
thus leading to a lower expression of HIF-1α (as demonstrated in our study).
The consequence of these observations for the clinical
practice is the awareness of rebound neoangiogenesis in
case of definite drug withdrawal. It could be speculated
therefore a benefit of treatment maintenance where other
therapeutical options are not available and the patient
would be attended only with best supportive care. Moreover, in case of occurrence of adverse events, if not severe,
a dosage reduction may be recommended instead of temporary interruption. Worth to remind that, the protocol of
the sorafenib registration trial [1] which showed a survival
benefit did not include to stop treatment at the moment
Page 8 of 9
of documentation of radiologic progression but only
when additionally also symptomatic progression had
taken place, so that patients were kept under antiangiogenic therapy for a longer time, possibly preventing the
negative effects of a rebound action.
The following limitations of the study need to be
mentioned. Whilst a complete revascularization has
been reported to be present already at 1 week after drug
interruption, the steady state of drug concentration is
reached within 7 days and the half-life of sorafenib is
25–48 hours, thus the timing of interruption, reintroduction and final evaluation may be suboptimal
[21]. Nevertheless, we suppose that a long-lasting treatment would lead to more pronounced neoangiogenic rebound, but this hypothesis has to be tested in the future.
Moreover, it would be of interest to test tumor response
following different length of treatment interruption, as different interruptions take place in the clinical practice in
case of recurring adverse events. Limitations related to the
model are intrinsic in any preclinical experiment and our
results would require validation in the human clinical setting, which however cannot be tested in a trial.
Conclusions
In conclusion, the present study supports the concept of
a neoangiogenetic rebound after sorafenib treatment
withdrawal in a murine model of HCC. Moreover, the
identification of over-expression of VEGFR2 through
molecular-CEUS, a well-established new technique for
imaging neoangiogenis in small animals, suggests it as
a potential tool for human assessment in the future.
Abbreviations
HCC: Hepatocellular carcinoma; VEGFR2: Vascular endotelial growth factor
receptor 2; PDGFR: Platelet derived growth factor receptor; CEUS: Contrast-enhanced
ultrasonography; MB: Microbubble; ROI: Region of interest; MI: Mechanical
index; TE: Targeted enhancement; dTE: Differential targeted enhancement;
HIF: Hypoxia inducible factor.
Competing interests
Prof Luigi Bolondi: Bayer AG (speaker fee, advisory board), Bristol-Myers
Squibb (research grant, advisory board), Bracco (research grant), Roche
(speaker fee). Dr. Fabio Piscaglia: Bayer AG (speaker fee, advisory board),
Bracco (speaker fee), Siemens Healthcare (speaker fee), Roche (speaker fee).
The other authors declare that they have no competing interests.
Authors’ contributions
SM performed the animal experiments, including model creation and gave
important contribution to manuscript preparation; VS acquired funding,
conceived and designed the protocol, participated to the experiments,
interpreted data, performed statistical analysis and wrote the manuscript;
MBT have made substantial contribution to study design, performed the
experiments and critically revised the manuscript for important intellectual
content; MM performed cell culture, western blot analysis, animal care and
has taken part to imaging procedures; LC, LV, AP and CP performed imaging
procedures, analysed and interpreted data; AD gave substantial contribution
to conception and study design and in data interpretation; LB acquired
funding and gave substantial contribution to conception and study design
and in data interpretation; FP conceived the protocol, interpreted data and
has been substantially involved in manuscript preparation. All authors read
and approved the final manuscript.
Marinelli et al. BMC Cancer 2014, 14:403
/>
Acknowledgements
The study was supported by the Italian Ministry of Health (038/GR-20091606660) with the additional contribution of funds from the Research
Program “Regione-Università 2012” in absence of any role of the funding
agencies in design, in the collection, analysis, and interpretation of data, in
the writing of the manuscript or in the decision to submit the manuscript
for publication.
The authors wish express their gratitude to Bracco Imaging, Switzerland, for
providing contrast microbubbles and for helpful advices and to Dr. Laura
Gramantieri and Dr. Pasquale Chieco for their precious advices and support.
Author details
1
Department of Medical and Surgical Sciences, University of Bologna and S.
Orsola-Malpighi Hospital, Bologna, Italy. 2Department of Veterinary Medical
Science, University of Bologna, Bologna, Italy. 3Centro di Ricerca Biomedica
Applicata, University of Bologna and S. Orsola-Malpighi Hospital, Bologna,
Italy.
Received: 7 January 2014 Accepted: 29 May 2014
Published: 4 June 2014
References
1. Llovet JM, Ricci S, Mazzaferro V, Hilgard P, Gane E, Blanc JF, de Oliveira AC,
Santoro A, Raoul JL, Forner A, Schwartz M, Porta C, Zeuzem S, Bolondi L,
Greten TF, Galle PR, Seitz JF, Borbath I, Haussinger D, Giannaris T, Shan M,
Moscovici M, Voliotis D, Bruix J, SHARP Investigators Study Group: Sorafenib
in advanced hepatocellular carcinoma. N Engl J Med 2008, 359(4):378–390.
2. Oh WK, McDermott D, Porta C, Levy A, Elaidi R, Scotte F, Hawkins R,
Castellano D, Bellmunt J, Rha SY, Sun JM, Nathan P, Feinberg BA, Scott J,
McDermott R, Ahn JH, Wagstaff J, Chang YH, Ou YC, Donnellan P, Huang
CY, McCaffrey J, Chiang PH, Chuang CK, Korves C, Neary MP, Diaz JR,
Mehmud F, Duh MS: Angiogenesis inhibitor therapies for advanced renal
cell carcinoma: toxicity and treatment patterns in clinical practice from a
global medical chart review. Int J Oncol 2014, 44(1):5–16.
3. Lai EC, Lau SH, Lau WY: Current management of gastrointestinal stromal
tumors–a comprehensive review. Int J Surg 2012, 10(7):334–340.
4. Paez-Ribes M, Allen E, Hudock J, Takeda T, Okuyama H, Vinals F, Inoue M,
Bergers G, Hanahan D, Casanovas O: Antiangiogenic therapy elicits
malignant progression of tumors to increased local invasion and distant
metastasis. Cancer Cell 2009, 15(3):220–231.
5. Ferrara N: Pathways mediating VEGF-independent tumor angiogenesis.
Cytokine Growth Factor Rev 2010, 21(1):21–26.
6. Shojaei F: Anti-angiogenesis therapy in cancer: current challenges and
future perspectives. Cancer Lett 2012, 320(2):130–137.
7. Fox WD, Higgins B, Maiese KM, Drobnjak M, Cordon-Cardo C, Scher HI, Agus DB:
Antibody to vascular endothelial growth factor slows growth of an
androgen-independent xenograft model of prostate cancer. Clin Cancer
Res 2002, 8(10):3226–3231.
8. Pazo-Cid RA, Lanzuela M, Esquerdo G, Perez-Gracia JL, Anton A, Amigo G,
Trufero JM, Garcia-Otin AL, Martin-Duque P: Novel antiangiogenic therapies
against advanced hepatocellular carcinoma (HCC). Clin Transl Oncol 2012,
14(8):564–574.
9. Wilhelm S, Carter C, Lynch M, Lowinger T, Dumas J, Smith RA, Schwartz B,
Simantov R, Kelley S: Discovery and development of sorafenib: a
multikinase inhibitor for treating cancer. Nat Rev Drug Discov 2006,
5(10):835–844.
10. Kaneko OF, Willmann JK: Ultrasound for molecular imaging and therapy
in cancer. Quant Imaging Med Surg 2012, 2(2):87–97.
11. Moestue SA, Gribbestad IS, Hansen R: Intravascular targets for molecular
contrast-enhanced ultrasound imaging. Int J Mol Sci 2012,
13(6):6679–6697.
12. Tardy I, Pochon S, Theraulaz M, Emmel P, Passantino L, Tranquart F,
Schneider M: Ultrasound molecular imaging of VEGFR2 in a rat prostate
tumor model using BR55. Invest Radiol 2010, 45(10):573–578.
13. Pochon S, Tardy I, Bussat P, Bettinger T, Brochot J, von Wronski M,
Passantino L, Schneider M: BR55: a lipopeptide-based VEGFR2-targeted
ultrasound contrast agent for molecular imaging of angiogenesis. Invest
Radiol 2010, 45(2):89–95.
14. Pysz MA, Foygel K, Rosenberg J, Gambhir SS, Schneider M, Willmann JK:
Antiangiogenic cancer therapy: monitoring with molecular US and a
clinically translatable contrast agent (BR55). Radiology 2010, 256(2):519–527.
Page 9 of 9
15. Bzyl J, Palmowski M, Rix A, Arns S, Hyvelin JM, Pochon S, Ehling J, Schrading S,
Kiessling F, Lederle W: The high angiogenic activity in very early breast
cancer enables reliable imaging with VEGFR2-targeted microbubbles
(BR55). Eur Radiol 2013, 23(2):468–475.
16. Bamber J, Cosgrove D, Dietrich CF, Fromageau J, Bojunga J, Calliada F,
Cantisani V, Correas JM, D’Onofrio M, Drakonaki EE, Fink M, Friedrich-Rust M,
Gilja OH, Havre RF, Jenssen C, Klauser AS, Ohlinger R, Saftoiu A, Schaefer F,
Sporea I, Piscaglia F: EFUSMB guidelinesand recommendations on the
clinical use of ultrasound elastography. Part 1: basic principles and
technology. Ultraschall Med 2013, 34(2):169–184.
17. Cosgrove D, Piscaglia F, Bamber J, Bojunga J, Correas JM, Gilja OH, Klauser AS,
Sporea I, Calliada F, Cantisani V, D’Onofrio M, Drakonaki EE, Fink M,
Friedrich-Rust M, Fromageau J, Havre RF, Jenssen C, Ohlinger R, Săftoiu A,
Schaefer F, Dietrich CF: EFSUMB guidelines and recommendations on the
clinical use of ultrasound elastography. Part 2: clinical applications.
Ultraschall Med 2013, 34(3):238–253.
18. Piscaglia F, Marinelli S, Bota S, Serra C, Venerandi L, Leoni S, Salvatore V: The
role of ultrasound elastographic techniques in chronic liver disease:
current status and future perspectives. Eur J Radiol 2014, 83(3):450–455.
19. Salvatore V, Baron Toaldo M, Marinelli S, Milazzo M, Palama C, Venerandi L,
Cipone M, Bolondi L, Piscaglia F: Early prediction of treatment response to
sorafenib with elastosonography in a mice xenograft model of
hepatocellular carcinoma: a proof-of-concept study. Ultraschall Med 2013,
34(6):541–549.
20. Dietrich CF, Averkiou MA, Correas JM, Lassau N, Leen E, Piscaglia F: An
EFSUMB introduction into dynamic contrast-enhanced ultrasound
(DCE-US) for quantification of tumour perfusion. Ultraschall Med 2012,
33(4):344–351.
21. Mancuso MR, Davis R, Norberg SM, O’Brien S, Sennino B, Nakahara T, Yao VJ,
Inai T, Brooks P, Freimark B, Shalinsky DR, Hu-Lowe DD, McDonald DM:
Rapid vascular regrowth in tumors after reversal of VEGF inhibition. J Clin
Invest 2006, 116(10):2610–2621.
22. Ebos JM, Lee CR, Cruz-Munoz W, Bjarnason GA, Christensen JG, Kerbel RS:
Accelerated metastasis after short-term treatment with a potent
inhibitor of tumor angiogenesis. Cancer Cell 2009, 15(3):232–239.
23. Zuniga RM, Torcuator R, Jain R, Anderson J, Doyle T, Schultz L, Mikkelsen T:
Rebound tumour progression after the cessation of bevacizumab
therapy in patients with recurrent high-grade glioma. J Neurooncol 2010,
99(2):237–242.
24. Johannsen M, Florcken A, Bex A, Roigas J, Cosentino M, Ficarra V, Kloeters C,
Rief M, Rogalla P, Miller K, Grunwald V: Can tyrosine kinase inhibitors be
discontinued in patients with metastatic renal cell carcinoma and a
complete response to treatment? A multicentre, retrospective analysis.
Eur Urol 2009, 55(6):1430–1438.
25. Liu LP, Ho RL, Chen GG, Lai PB: Sorafenib inhibits hypoxia-inducible
factor-1alpha synthesis: implications for antiangiogenic activity in
hepatocellular carcinoma. Clin Cancer Res 2012, 18(20):5662–5671.
26. Cuenod CA, Fournier L, Balvay D, Guinebretiere JM: Tumor angiogenesis:
pathophysiology and implications for contrast-enhanced MRI and CT
assessment. Abdom Imaging 2006, 31(2):188–193.
doi:10.1186/1471-2407-14-403
Cite this article as: Marinelli et al.: Evaluation of the impact of transient
interruption of antiangiogenic treatment using ultrasound-based
techniques in a murine model of hepatocellular carcinoma. BMC Cancer
2014 14:403.