Effect of different level of N P K and gypsum on soil properties and yield of groundnut (Arachis hypogaea L.) var. Jyoti
Bạn đang xem bản rút gọn của tài liệu. Xem và tải ngay bản đầy đủ của tài liệu tại đây (235.05 KB, 8 trang )
Int.J.Curr.Microbiol.App.Sci (2017) 6(6): 984-991
International Journal of Current Microbiology and Applied Sciences
ISSN: 2319-7706 Volume 6 Number 6 (2017) pp. 984-991
Journal homepage:
Original Research Article
/>
Effect of Different Level of N P K and Gypsum on Soil Properties and Yield of
Groundnut (Arachis hypogaea L.) var. Jyoti
Murli Dhar Bairagi*, Arun Alfred David, Tarence Thomas and Prakash Chand Gurjar
Department of Soil Science and Agricultural Chemistry, Naini Agricultural Institute
Sam Higginbottom University of Agriculture, Technology and Science Allahabad,
211007 (U.P.), India
*Corresponding author
ABSTRACT
Keywords
Soil Physical and
Chemical
properties,
Soil amendment,
N P K and Gypsum,
Groundnut and
yield.
Article Info
Accepted:
17 May 2017
Available Online:
10 June 2017
A field experiment was conducted during kharif season (2016) to study the “Effect of
different level of N P K and Gypsum on Soil properties and yield of Groundnut var. Jyoti
(Arachis hypogaea L.)” at the research farm of department of Soil Science and
Agricultural Chemistry Sam Higginbottom University of Agriculture, Technology and
Sciences, Allahabad, Experiment laid out in randomized block design with three levels of
N P K [0% N P K = No application of N P K, 50% N P K = (10:30:20kg ha-1), 100% N P
K = (20:60:40kg ha-1)] and three levels of Gypsum [0% Gypsum = No application of
Gypsum, 50% Gypsum = (250kg ha-1), 100% Gypsum = (500kg ha-1)].The result shows
that application of different levels combination of N P K fertilizers increased growth and
yield of groundnut. It was recorded from the application of chemical fertilizers in
treatment T7 [(@ 100% N P &K + 50%. Gypsum)] increased pH 7.37, EC 0.714 dS m -1,
Organic carbon 0.79%.Whereas available Nitrogen, Phosphorus, Potassium, Sulphur and
Calcium were found more in T8 [(@ 100% N P K + 100% Gypsum)], followed by T7 [(@
100% N P K + 50%. Gypsum) EC decreased. The physical parameters of soil such as bulk
density g/cc, particle density g/cc and pore spaces % increased. It was also concluded from
trail that the application of fertilizers in treatment T8 [(@ 100% N P K + 100% Gypsum)]
was found in increasing Plant height, No. of leaves per plant, No. of branch, length of pod
(cm), number of grain per pod, seed index (g.plot-1) and grain yield and as well as yield.
Introduction
also used for manufacturing artificial fibre. It
is an important protein supplement in cattle
and poultry rations. The haulms (plant stalks)
are fed (green, dried or silage) to livestock.
Groundnut shell is used as fuel for
manufacturing coarse boards, cork substitutes
etc. (Varghese, 2011). The optimization of the
mineral nutrition is the key to optimize the
production of groundnut, as it has very high
nutrient requirement and the recently released
high yielding groundnut varieties remove still
more nutrients from the soil. On contrary
Groundnut or peanut (Arachis hypogaea L.)
which is also known as a „King‟ of oilseed
(Sathya et al., 2013) is a rainfed crop and
grown in Kharif season Groundnut oil is
edible oil and finds extensive use as a cooking
medium both as refined oil and vegetable
Ghee. Groundnut also has value as a rotation
crop. Being a legume with root nodules, it can
synthesize atmospheric nitrogen and therefore
improve soil fertility. The residual oilcake
contains 7-8% N, 1.5 % P2O5 and 1.2% K2O
and is used as an organic fertilizer and it is
984
Int.J.Curr.Microbiol.App.Sci (2017) 6(6): 984-991
groundnut farmers, most part of the semi-arid
region use very less nutrient fertilizer and
sometime only one or two nutrients resulting
in severe mineral nutrient deficiencies due to
inadequate and imbalance use of nutrients is
one of the major factors responsible for low
yield in groundnut. India is the world‟s largest
producer of groundnut where nutritional
disorders cause yield reduction from 30 to
70% depending upon the soil types. Thus it is
high time to look into the mineral nutrition
aspects of groundnut for achieving high yield
and advocate the suitable package of practices
for optimization of yield (Singh, 2004).
Significant increase in pod yield of groundnut
was observed at a fertilizer level of 30: 60:30
kg N P K ha-1 and increase in yield was 30%
higher than lower level of fertilizer doses
(Kumar et al., 2000). In India, about 75% of
the groundnut area lies in a low to moderate
rainfall zone with a short period of
distribution. It has been grown over an area of
5.31 million hectare and producing 6.93
million tones, of groundnut (DOAC, 2012)
with productivity of 1305 kg ha-1 in Indian
context. Its cultivation is mostly confined to
the states of Gujarat, Andhra Pradesh,
Maharashtra, Tamil Nadu and Karnataka. The
average area under groundnut cultivation in
Junagad district during 2011 was 4.42 lakh
hectares with production of 9.57 lakh tones
and productivity of 2162 kg ha-1 (DOAC,
2012).
Gypsum or any other basal fertilizer to
groundnut (Chikowo, 1998). The use of lime
instead of Gypsum can provide not only Ca
for the ground crop but also improves the
availability of other plant nutrients. Proper
incorporation of lime into the soil ensures the
availability of Ca in the podding zone (Cox et
al., 1982).
Gypsum is widely used as a source of Ca for
groundnut worldwide. Groundnut response to
Gypsum as with any other fertilizer depends
on the fertility status of the soil. The
dissolution of Gypsum is fairly rapid and
therefore readily adds Ca to the podding zone.
However the major disadvantage of Gypsum
is its vulnerability to leaching especially on
light textured soils. Positive responses have
been observed on sandy soils with pH less
than 5.0 (0.01 M CaCl2). Survey data from the
small holder farming sector has shown that
the majority of the farmers do not apply
Experimental sites
Materials and Methods
Soil sampling
The soil of experimental area falls in order of
Inceptisol and in experimental plots is alluvial
soil in nature. The soil samples randomly
collect from five different sites in the
experiment plot prior to tillage operation from
a depth of 0-15 cm. The size of the soil
sample reduce by conning and quartering the
composites soil sample is air dry and pass
through a 2 mm sieve by way of preparing the
sample for physical and chemical analysis.
The experimental details are given below
under different heading.
Design and treatment
The experiment was carried out in 3×3
factorial randomized block design with three
levels of N P K, three levels of Gypsum. The
treatments were replicated three times and
were allocated at random in each replication.
The experiment was conducted on the
research farm of department of Soil Science
and
agricultural
chemistry,
Sam
Higginbottom University of Agriculture,
Technology and Sciences, Allahabad which
situated six km away from Allahabad city on
the right bank of yamuna river, the
experimental site is located in the sub –
tropical region with 250 N latitude 81.500 E
longitude and 95 MS Laltitude.
985
Int.J.Curr.Microbiol.App.Sci (2017) 6(6): 984-991
the minimum 47.05 pore space was recorded
with control (N0G0) treatment. The statistical
analysis of pore space data indicates that there
was significant difference in pore space
interaction between N P K and Gypsum. The
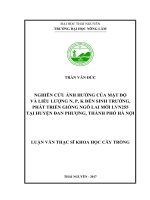
maximum pH 7.37 was recorded with (N1G2)
treatment combination followed by 7.33 with
(N2G0) treatment whereas the minimum 7.07
pH was recorded with control (N0G0)
treatment. The statistical analysis of pH data
indicates that there was non-significant
difference in pH interaction between N P &K
and gypsum. The trend of EC the maximum
EC dS m-1 7.14 was recorded with (N2G1)
treatment combination followed by 7.33 with
(N2G0) treatment whereas the minimum 6.94
EC was recorded with control (N0G0) non
difference in EC interaction between N P K
and gypsum. The result of the data depicted
that the maximum organic carbon 0.82 was
recorded with (N2G1) treatment combination
followed by 0.74 with (N2G0) treatment
whereas the minimum 0.61 organic carbon
was recorded with control (N0G0) treatment.
The statistical analysis of organic carbon data
indicates that there was non-significant
difference in organic carbon interaction
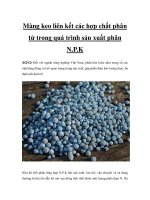
between N P K and Gypsum. In case of
available nitrogen the maximum available
nitrogen 286.87 was recorded with (N2G2)
treatment combination followed by 25.20
with (N2G0) treatment combination whereas
the minimum 236.57 available nitrogen was
recorded with control (N0G0) treatment. The
statistical analysis of available nitrogen data
indicates that there was significant difference
in available nitrogen interaction between N P
K and Gypsum. The maximum available
phosphorus 27.00 was recorded with (N2G2)
treatment combination followed by 25.20
with (N2G0) treatment combination whereas
the minimum 19.51 available phosphorus was
recorded with control (N0G0) treatment. The
statistical analysis of available phosphorus
data indicates that there was significant
difference in available phosphorus interaction
Fertilizer application
The fertilizers were applied in each plot
according to treatment combinations. The
nitrogen requirement meets with urea 46%.
The nitrogen was applied with the three
different levels i.e.levels of N P K [0% N P K
= No application of N P and K, 50% N P K =
(10:30:20 kg ha-1), 100% N P K =
(20:60:40kg ha-1)] and three levels of Gypsum
[0% Gypsum = No application of Gypsum,
50% Gypsum = (250kg ha-1), 100% Gypsum
= (500kg ha-1)] was given in equal quantity to
each plot which was calculated on the basis of
general recommendation for maize as 0 kg, 80
kg, 100kg ha-1 was supplied. On the basis of
treatment combination the fertilizer used are
described in table 1.
Results and Discussion
Result of mechanical and chemical analysis
of post-harvest composite soil samples
Perusal of table reveals the maximum bulk
density 1.18 was recorded with (N1G2)
treatment combination followed by 1.13 with
(N0G2) treatment whereas the minimum 1.02
bulk density was recorded with (N0G1)
treatment. The statistical analysis of bulk
density data indicates that there was
significant difference in bulk density
interaction between N P K and Gypsum.
Similarly, the maximum Particle density 2.73
was recorded with (N1G2) treatment
combination followed by 2.62 with (N0G2)
treatment whereas the minimum 2.25 Particle
density was recorded with control (N0G0)
treatment. The statistical analysis of Particle
density data indicates that there was
significant difference in Particle density
interaction between N P K and Gypsum. In
the case of pore space the maximum pore
space 50.98 was recorded with (N1G2)
treatment combination followed by 50.00
with (N0G2) treatment combination whereas
986
Int.J.Curr.Microbiol.App.Sci (2017) 6(6): 984-991
between N P &K and Gypsum. The maximum
potassium 220.80 was recorded with (N2G2)
treatment
combination
followed
by
213.31with (N2G1) treatment combination
whereas the minimum 127.24 potassium was
recorded with control (N0G0) treatment
(Table 2-5; Figs 1-3).
Table.1 Fertilizer and soil amendment treatment combination
S. NO.
01
02
03
04
05
06
07
08
09
Symbol
(T0=N0+G0)
(T1=N0+G1)
(T2=N0+G2)
(T3=N1+G0)
(T4=N1+G1)
(T5=N1+G2)
(T6=N2+G0)
(T7=N2+G1)
(T8=N2+G2)
Treatment Combination
(@ 0% N: P: K + 0%.GYPSUM)
(@ 0%N: P: K + 50%.GYPSUM)
(@ 0% N: P: K + 100%GYPSUM)
(@50%N: P: K+0%GYPSUM)
(@50%N: P: K+ 50%GYPSUM)
(@50%N: P: K+100%GYPSUM)
(@100%N: P: K+0%GYPSUM)
(@100%N: P: K+50%GYPSUM)
(@100%N: P: K+100%GYPSUM)
Table.2 Soil physical parameters before sowing of groundnut
S. No.
1.
2.
3.
4.
5.
6.
Particular
Results
Methods
Bulk density (Mg m-3)
1.07
(Black 1965)
Particle density (Mg m-3)
2.24
(Black 1965)
Soil texture (%) Sand- 55%, Silt- 30 %,Clay- 15 %, Sandy Loam (Bouyoucos 1927)
Soil colour2.5 Y, 6/4 Light
MunshellColour Chart
Pore space (%)
47.05
(Black 1965)
Water holding capacity (%)
76.67
(Black 1965)
Table.3 Soil Chemical parameters before sowing of groundnut
S. No. Particular
Methods
Results
1. Soil pH (1:2)
(Jackson,1973)
(Wilcox, 1950)
7.32
0.610
Walkley and Black‟s method (1947)
(Subbaih and Asija, 1956)
0.61
236.58
(Olsen et al., 1950)
19.51
(Toth and Prince, 1949)
Chesnin and Yien (1950)
EDTA method
156.60
19.89
1.41
-1
2. Soil EC (dS m )
3. Organic Carbon (%)
-1
4. Available Nitrogen (Kg ha )
-1
5. Available Phosphorus (Kg ha )
-1
6. Available Potassium (Kg ha )
7. Available Sulphur (kg ha-1)
7. Available calcium (meq./100gm of soil)
987
Int.J.Curr.Microbiol.App.Sci (2017) 6(6): 984-991
Table.4 Interaction effect of different levels of N P K and Gypsum on
Physico-chemical properties of Soil
Treatments
T0= (N0+G0)
Bulk
density
(g cc-1)
1.07
Particle
density
(g cc-1)
2.24
T1=(N0+G1)
1.02
2.25
48.90
7.13
0.629
0.61
T2= (N0+G2)
1.13
2.62
50.00
7.23
0.619
0.64
T3= (N1+G0)
1.09
2.51
49.02
7.07
0.614
0.68
T4= (N1+G1)
1.05
2.52
50.00
7.17
0.694
0.69
T5= (N1+G2)
1.18
2.73
50.98
7.37
0.612
0.82
T6 = (N2+G0)
1.07
2.41
48.03
7.33
0.610
0.74
T7 = (N2+G1)
1.04
2.47
49.98
7.3
0.714
0.72
T 8= (N2+G2)
1.03
2.34
49.17
7.27
0.614
0.79
S
S
S
NS
NS
NS
S. Em. (±)
0.020
0.019
0.557
0.213
0.054
0.027
C.D. at 5%
0.042
0.041
1.180
0.452
0.115
0.057
F-test
Pore
space
(%)
47.05
pH 1:2
(W/V)
7.13
-
EC (dS m
1
)
0.634
Organic
carbon
(%)
0.61
Table.5 Interaction effect of different levels of N P K and Gypsum on
Physico-chemical properties of Soil
Nitrogen
(kg ha-1)
236.57
244.95
254.38
255.43
261.72
268.01
278.72
275.34
286.87
S
Phosphorus
(kg ha-1)
19.51
19.81
20.41
21.01
22.58
23.4
23.7
25.2
27
S
S. Em. (±)
0.923
C.D. at 5%
1.957
Treatments
(T0=N0+G0)
(T1=N0+G1)
(T2=N0+G2)
(T3=N1+G0)
(T4=N1+G1)
(T5=N1+G2)
(T6=N2+G0)
(T7=N2+G1)
(T8=N2+G2)
F-test
Potassium
(kgha-1)
127.24
142.01
153.43
157.18
172.14
183.44
202.63
213.31
220.8
NS
Sulphur
(kgha-1)
19.89
19.89
20.88
21.55
22.46
23.49
27.28
29.78
32.44
S
Calcium
1.06
2.67
2.73
2.75
2.83
2.85
2.92
3.13
3.31
S
0.054
5.598
0.722
0.047
0.115
11.868
1.530
0.099
988
Int.J.Curr.Microbiol.App.Sci (2017) 6(6): 984-991
Fig.1 Effect of different levels of N P K and gypsum on their interaction on
N P K and of groundnut
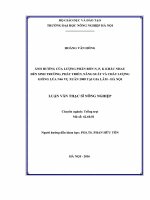
Fig.2 Effect of different levels of N P K and gypsum on their interaction on
sulphur and calcium of groundnut
989
Int.J.Curr.Microbiol.App.Sci (2017) 6(6): 984-991
Fig.3 Effect of different levels of N P K and gypsum on their interaction on
pH and EC of groundnut
The statistical analysis of potassium data
indicates that there was significant difference
in potassium interaction between N P K and
Gypsum. In case of sulphur the maximum
sulphur 32.44 was recorded with (N2G2)
treatment combination followed by 29.78
with (N2G1) treatment combination whereas
the minimum 19.89 sulphur was recorded
with control (N0G0) treatment. The statistical
analysis of sulphur data indicates that there
was significant difference in sulphur
interaction between N P K and Gypsum. The
maximum calcium 3.31 was recorded with
(N2G2) treatment combination followed by
3.13 with (N2G2) treatment combination
whereas the minimum 1.06 calcium was
recorded with control (N0G0) treatment. The
statistical analysis of calcium data indicates
that there was a significant difference in
calcium interaction between N P K and
Gypsum.
combination. It was recorded from the
application of chemical fertilizers in treatment
T8 [(@ 100% N P K + 100% Gypsum)] was
found to be the best treatment gave highest
benefit of 52125 with highest cost benefit
ratio 1:2.66 for Groundnut, it could be
recommended for profitable production of
Groundnut (Arachish hypogeae L.) var. Jyoti
and treatment is good for soil physical and
chemical properties. Effect of different levels
of N P K and Gypsum is better for soil health
and Groundnut production.
References
Bouyoucous, G.J. 1927. The hydrometer as a
new method for the mechanical analysis
of soils. Soil Sci., 23: 393-395.
Black, C.A. 1965. Methods of soil analysis
vol.2, Am. Soc, Agron., madison,
Wisconsin, U.S.A.
Chikowo, R. 1998. Soil fertility management
option
for
improved
groundnut
production in the small holder section.
M. Phil thesis, University of Zimbabwe.
In conclusion, it showed the best result on
growth and yield of groundnut (Arachis
hypogeae L.) in comparison to other treatment
990
Int.J.Curr.Microbiol.App.Sci (2017) 6(6): 984-991
Chesnin, L. and C.H. Yien. 1950.
Turbidimetric
determination
of
available sulphate, Soil. Sci. Amer.
Proc., 15: 149-151.
Cox, F.R., Adams, F. and Tucker, B.B. 1982.
Liming, fertilization and mineral
nutrition. In. Peanut Science and
Technology (Eds. Pattec, H. and Young,
C.). American Peanut Res. Edu. Soc.,
pp. 138-59.
DOAC. 2012. Directorate of Economics and
Statistics, Directorate of Agriculture
and Cooperation, Government of India,
New Delhi.
Jackson, M.L. 1958. Soil chemical analysis,
Second edition Indian Reprint, prentice
hall of India, New Delhi, PP 498.
Olsen, S.R., Cole, C.V., Watnahe, F.S. and
Dean, L.A. 1954. Estimation of
available phosphorus in soils by
extraction with sodium bicarbonate U.S.
Deptt. Agr.Circ., pp 939.
Singh, A.L. 2004. Mineral nutrient
requirement, their disorders and
remedies in groundnut. Groundnut
Research in India, National Research
Centre for Groundnut, Junagadh, India.
pp. 137-159.
Subbaih, B.V., and Asija, C.L. 1956. A rapid
proceducre for the estimation of
available nitrogen in soils. Curr. Sci.,
25: pp 256-260.
Sathya Priya, R., Chinnusamy, C.,
Manicaksundaram, P., Babu, C. 2013. A
review on weed management in
groundnut (Arachishypogaea L.). Int. J.
Agri. Sci. Res., 3: 163-172.
Varghese, N. 2011. Changing directions of
groundnut trade in India: The WTO
effect. Int. Conference on Appl.
Economics, Pp. 731.
Walkley, A. and Black, I.A. 1947. Critical
examination of rapid method for
determining organic carbon in soils,
effect of variance in digestion
conditions and of inorganic soil
constituents. Soil Sci., pp. 632:251.
Wilcox, L.V. 1950. Electrical conductivity,
Amer Water Works Assoc. J., 42: pp
775-776.
How to cite this article:
Murli Dhar Bairagi, Arun Alfred David, Tarence Thomas, and Prakash Chand Gurjar. 2017.
Effect of Different Level of N P K and Gypsum on Soil Properties and Yield of Groundnut
(Arachis hypogaea L.) var. Jyoti. Int.J.Curr.Microbiol.App.Sci. 6(6): 984-991.
doi: />
991