cisco migration_Using the Service Control Engine and Deep
Bạn đang xem bản rút gọn của tài liệu. Xem và tải ngay bản đầy đủ của tài liệu tại đây (2.06 MB, 30 trang )
Using the Service Control Engine and Deep
Packet Inspection in the Data Center
This document is a basic primer for use and deployment of the Service Control Engine products in the
data center. This document also provides a basis for further discussion of deep packet inspection (DPI)
techniques and products.
Contents
Introduction
2
Service Control Solution Overview
2
Service Control Engine Insertion Strategies 6
Port Mirror 6
Inline Multi-Gigabit Service Control Point 6
Basics of Dispatch Operation 7
MGSCP Options 7
MGSCP Layer 2 Dispatch Mode 7
MGSCP Layer 2/Layer 3 Dispatch Mode 11
MGSCP Layer 3 Dispatch Mode 11
N+1 Redundancy 12
SCE Management and Policy Creation
Deploying a New SCE 14
Changing a Policy 17
Updating Signatures 19
Reports
12
20
Appendix A—SCE and PISA
27
Americas Headquarters:
Cisco Systems, Inc., 170 West Tasman Drive, San Jose, CA 95134-1706 USA
© 2007 Cisco Systems, Inc. All rights reserved.
Introduction
Introduction
Deep packet inspection (DPI) provides the ability to look into the packet past the basic header
information. DPI intelligently determines the contents of a particular packet, and then either records that
information for statistical purposes or performs an action on the packet.
Applications enabled by DPI include the following:
•
Traffic Management, or the ability to control end-user applications such as peer-to-peer applications
•
Security, resource, and admission control
•
Policy enforcement and service enhancements such as personalization of content or content filtering
Benefits include increased visibility into the network traffic, which enables network operators to
understand usage patterns and to correlate network performance information along with providing usage
base billing or even acceptable usage monitoring.
DPI can also reduce the overall costs on the network by reducing operation expenses (OpEx) and capital
expenses (CapEx) by providing a more thorough understanding of what is happening with the network,
and by providing the ability to direct traffic or to prioritize traffic more intelligently.
Cisco currently has two hardware-based solutions for achieving this DPI functionality: the Cisco Service
Control Engine (SCE) product line, and the newly-introduced PISA hardware for the Cisco 6500/7600
Supervisor 32. This document provides basic configuration and performance information with regard to
the SCE product family as well as providing comparisons between the SCE and PISA products.
Service Control Solution Overview
The Service Control solution requires the following components for implementation.
•
Management network
The Service Control solution requires that a management network be created so that the SCEs,
Collection Manager, Service Control Application Suite, and the Service Control Application Suite
Reporter can communicate with each other. This network can be separate, or it can be part of a
larger, more-involved out-of-band management network that many customers deploy to isolate
management of network elements from user data.
•
Service Control Engine
The SCE is purpose-built hardware platform that performs deep packet inspection, identifies the
users, and generates the report data records. The SCE 2000 provides four Gigabit Ethernet (SX or
LX) user and network ports, and two FastEthernet management ports. This device requires that a
FastEthernet connection be made to the management network, and the unit must see
mirrored/duplicated/couples traffic bi-directionally. This document focuses on the SCE 2000
product. (See Figure 1 and Table 1.)
Using the Service Control Engine and Deep Packet Inspection in the Data Center
2
OL-13955-01
Service Control Solution Overview
Figure 1
Table 1
SCE 2020
SCE Specifications
SCE1010
2-GBE (fiber SX/LX)
Interfaces
SCE2020
4-GBE (fiber SX/LX)
4-FE
Management
interface
2 x 10/100/1000 FE
2 x 10/100/1000 FE
Processor memory
1.5 GB
1.5 GB
Maximum flows
2M (1M bi-directional)
2M (1M bi-directional)
Maximum subscriber
contexts
40,000
80,000
Network
configuration
Receive-only
•
Receive-only
•
Inline
•
Inline
•
•
•
Cascade
Collection Manager
The SCE generates usage data and statistics from the SCE platform and forwards them as raw data
records (RDRs), using a simple TCP-based protocol (RDR Protocol). The Service Control solution
provides the Collection Manager software as an implementation of a collection system, listening in
on RDRs from one or more SCE platforms, and processing them on the local machine. The data is
then stored for analysis and reporting functions, as well as simple collection and presentation of data
to other operation support and systems (OSS) such as billing. The Collection Manager runs on Sun
Solaris or Red Hat Linux platforms. The Collection Manager needs to be connected to the same
management network to which the SCE FastEthernet port(s) are connected.
Table 2 lists the Collection Manager software and hardware requirements.
Table 2
Collection Manager Software and Hardware Requirements
Solaris
Red Hat Linux
Hardware
Hardware
Using the Service Control Engine and Deep Packet Inspection in the Data Center
OL-13955-01
3
Service Control Solution Overview
Table 2
Collection Manager Software and Hardware Requirements (continued)
•
Minimum 500 MHz CPU
•
Minimum 800 MHz CPU
•
Minimum 1 GB RAM per CPU
•
Minimum 1 GB RAM per CPU
•
Hard disk:
•
Hard disk:
– One hard disk, at least 18 GB (recommended
– One hard disk, at least 18 GB
for bundled installations)
(recommended for bundled
installations).
– A second hard disk (at least 18 GB), to store
Sybase data
•
– A second hard disk (at least 18 GB), to
store Sybase data
100BASE-T network interface
•
Software and Environment
•
Solaris 5.8 64-bit build 04/01 or later (currently
only Solaris 5.8 and 5.9 is supported).
•
100BASE-T network interface
Software and Environment
•
Red Hat Linux 3.0 or 4.0.
Solaris core installation
•
Red Hat Enterprise “Base” Installation (for
installations with bundled Sybase)
The following additional system packages should be The following additional package should be
installed:
installed:
•
SUNWbash—GNU Bourne-Again shell (bash)
•
SUNWgzip—GNU Zip (gzip) compression
utility
•
compat-libstdc++ (available on the Red
Hat installation CD.)
Latest recommended patches from Red Hat
should be applied.
•
SUNWzip—Info-Zip (zip) compression utility
•
SUNWlibC—Sun Workshop Compilers Bundled
libC
•
SUNWlibCx—Sun Workshop Bundled 64-bit
libC
•
Service Control Application Suite Broadband (BB) Console
The SCAS BB console is the SCE GUI used to create, modify, and apply the service configuration.
The SCAS BB Console lets you define services, packages, protocols, bandwidth control, and other
items in the configuration. The SCAS BB Console creates a policy configuration file (.pqb), which
can then be saved and/or applied to the SCE device(s). The SCAS BB Console runs on any Windows
PC (Windows 95 or greater), and it requires a connection to the management network.
•
Service Control Application Suite Reporter
The SCAS Reporter allows you to query the Collection Manager RDR database and to present the
results in a chart or table. This tool provides a valuable resource for understanding the usage patterns
and resources used by applications and users that use network resources. This tool can also help your
staff to understand the operational impact of various rules and what their impact might be if they are
implemented onto the network. This tool runs on any Windows PC (Windows 95 or greater), and it
requires a connection to the management network.
•
Subscriber Manager
This optional but recommended component is required to function as middleware software that is
used to bridge between the OSS and the SCE platform(s). Subscriber information is stored in the
Subscriber Manager database and can then be distributed between multiple devices according to
Using the Service Control Engine and Deep Packet Inspection in the Data Center
4
OL-13955-01
Service Control Solution Overview
actual subscriber placement. The Subscriber Manager runs on Sun Solaris or Red Hat Linux
platforms. This element requires a Fast Ethernet connection to the management network. Software
requirements are the same as for the Collection Manager.
The Subscriber Manager provides subscriber awareness, mapping network IDs to subscriber IDs. It
obtains subscriber information using dedicated integration modules, which integrate with AAA
devices such as RADIUS or DHCP servers.
Subscriber information may be obtained in one of two ways:
– Push mode—The Subscriber Manager pushes subscriber information to the SCE platform
automatically upon logon of a subscriber.
– Pull mode—On-demand, in response to a query from the SCE Platform to the Subscriber
Manager.
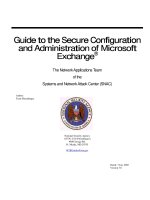
Figure 2 shows a high level connectivity diagram of each of the components of the Service Control
solution.
Figure 2
Service Control Solution Components
Campus
Core
GSR12K
Gigabit
Ethernet
Data Center
Core Layer
Gigabit
Ethernet
Gigabit
Ethernet
Gigabit
Ethernet
Trunk
GigEth
Catalyst
6500
Si
Si
SCE 2000
Catalyst
6500
SCE 2000
SCE 2000
Trunk
GigEth
Data Center
Aggregation Layer
Catalyst
6506-E
Si
Si
Catalyst
6506-E
RED DE
GESTION
Data
Subscriber RADIUS
Collector Manager
DC Access Layer
DC Access Layer
221675
Engage Console
and
Reporter
Using the Service Control Engine and Deep Packet Inspection in the Data Center
OL-13955-01
5
Service Control Engine Insertion Strategies
Service Control Engine Insertion Strategies
There are various ways of positioning the SCE products for use in the network. As part of a data center
deployment, only a subset of these were used. This is based on the requirements for maintaining Layer 3
functionality between the aggregation and the core layers of the data center network as well as the
requirements of moving to 10 Gig throughput rates. The two methods used allow for a customer to first
become operationally experienced with the SCE as well as to begin to baseline traffic patterns on their
network to begin the policy creation phase. Policy creation should not be attempted without an
understanding of the applications on the network and the traffic flow that these applications place on the
network.
Note
In the planning of your SCE deployment, the SCE needs to see both sides of a traffic flow, and
asymmetric traffic flows need to be minimized if proper reporting and policy implementations are to be
undertaken. Asymmetric flows may not be reported correctly and can adversely affect performance of
created user policies.
Port Mirror
In this deployment scenario, the SCE is deployed in a monitor-only method, and the actual port mirroring
can be done at either the core or aggregation layers. This allows the data center operations staff to create
the SCE management network and to test functionality, as well as begin to gather baseline traffic analysis
on their network.
Inline Multi-Gigabit Service Control Point
In a inline multi-gigabit service control point (MGSCP) configuration, the SCE is inserted between the
core data center routers. (See Figure 3.)
10G Subs
10G
Inline MGSCP Deployment
Si
Si
Catalyst
6509
Catalyst
6509
SCE 2020
10G Subs
10G Net
Tester
221676
Figure 3
The Service Control solution can also be deployed between the core and aggregation nodes. However,
with the requirement of all flows traversing the same SCE, it is more practical to deploy the SCE devices
at a layer in the data center and not between. Optional external optical bypass modules and redundant
Using the Service Control Engine and Deep Packet Inspection in the Data Center
6
OL-13955-01
Service Control Engine Insertion Strategies
cascade operation provides high availability. The inline deployment permits dynamic control of the
traffic including throttling, blocking, and redirection. The benefits of this solution are that any single
SCE failure does not result in an outage, and the solution can be architected to provide for an N+1
redundancy model. In addition, from a sizing perspective, this solution allows the data center operators
to add additional SCE units as bandwidth needs dictate.
Basics of Dispatch Operation
When configured in dispatch mode, the Catalyst 6500/7600 requires high speed links facing the host
device and the network. The Catalyst 6500 dispatches traffic flows to a unique port on the EtherChannel
served by an SCE, which performs the configured analysis of the traffic and returns the packets to the
original data path. The reason for the unique port is that traffic in the flow must be dispatched to the same
SCE to maintain state information.
The Catalyst 6500 gives the network operations staff the flexibility to use Layer 2 or Layer 3 dispatching,
depending on their data center deployment. When using Layer 2, packets are dispatched into the
EtherChannel using a combination of Layer 2 switching and flow hashing. When Layer 3 routing is used,
you need to use policy-based routing (PBR) in combination with flow hashing in the EtherChannel. It is
also possible to use both Layer 2 and Layer 3 methods of dispatch to the same SCE cluster group.
For optimum flow dispersion, the number of links in the EtherChannel bundle should be 2^N.
MGSCP Options
Figure 4 shows the Cisco Catalyst 6500/7600 in dispatch mode.
Figure 4
Catalyst 6500/7600 in Dispatch Mode
Cisco 7600/6500
Network
Return
Flows
221677
Flows
SCE Cluster
MGSCP Layer 2 Dispatch Mode
When both the host and the network ports are configured as Layer 2 VLAN ports, the MGSCP solution
can be deployed in Layer 2 operational mode. (See Figure 5.)
Using the Service Control Engine and Deep Packet Inspection in the Data Center
OL-13955-01
7
Service Control Engine Insertion Strategies
Figure 5
Layer 2 Dispatch Mode
VLAN 100
Flow
VLAN 201
Etherchannel
Bundle "X"
Etherchannel
Bundle “Y”
Network
Return
Flows
SCE 2000
221678
N+1
EtherChannel bundles need to be created to process both the host-side VLAN traffic and the
network-side VLAN traffic. The SCE performs its packet inspection and configured policy enforcement,
and returns the packet to the original data path. Any single flow must be dispatched to the same SCE to
maintain state information. By default, the Layer 2 switching and EtherChannel hash algorithm balances
the flows based on the IP header information, and the resulting path selection is the same for all packets
in a particular flow. Because most customers deploy redundant cores and aggregation layers, it is worth
mentioning how asymmetric flows are handled by the SCE. Because the EtherChannel hash is
predictable given a consistent set of inputs, cabling the SCE devices in a uniform fashion to redundant
6500/7600 chassis results in the flows being directed to the same SCE unit, regardless of which chassis
the packet traverses.
VLAN translation is then used to avoid misdirecting Layer 2 switched packets back on an EtherChannel.
The EtherChannel interface is configured as a trunk port, the trunk port carries the VLAN ID in the .1Q
header payload and the .1Q VLAN ID is automatically rewritten at the network EtherChannel connection
or by the SCE device from the User VLAN ID to the network EtherChannel VLAN ID. Without the use
of VLAN translation, the packet is automatically dropped by the 6500/7600 line card port ASICs.
Configuration Example
In the configuration of the MGSCP solution, remember to enable load balancing on both the ingress and
egress ports for the traffic going through the EtherChannel. Before 12.2(18) SXF, you can use the
per-source/destination IP load balancing from the global command line. The load balancing hash should
be performed on the Supervisor CPU using the following command:
With releases after 12.2(18) SXF, if you are using line cards with DCEF capabilities, you can now do
per-line card load balancing using the following command:
The following examples show the actual switch configuration for MGSCP for a Layer 2 MGSCP
configuration.
Global Configuration
!
interface Port-channel10
switchport
switchport trunk encapsulation dot1q
switchport trunk allowed vlan 201
switchport mode trunk
no ip address
Using the Service Control Engine and Deep Packet Inspection in the Data Center
8
OL-13955-01
Service Control Engine Insertion Strategies
lacp max-bundle 2
!
interface Port-channel20
switchport
switchport trunk encapsulation dot1q
switchport trunk allowed vlan 100
switchport mode trunk
no ip address
lacp max-bundle 2
!
!
port-channel per-module load-balance
port-channel load-balance dst-ip
port-channel load-balance src-ip module 1
!
vlan 100
name Host-side
!
vlan 201
name Network-side
Host Side Configuration
•
Port configuration—Host side:
!
interface GigabitEthernet1/1
switchport
switchport access vlan 100
switchport mode access
no ip address
load-interval 30
!
•
Port configuration—Host side:
!
interface GigabitEthernet2/13
description <<< Connected to Backup host side >>>
switchport
switchport trunk encapsulation dot1q
switchport trunk allowed vlan 100
switchport mode trunk
switchport vlan mapping enable
switchport vlan mapping 201 100
no ip address
no cdp enable
channel-protocol lacp
channel-group 20 mode active
lacp port-priority 65535
!
interface GigabitEthernet2/14
description <<< Connected to SCE-2 host side >>>
switchport
switchport trunk encapsulation dot1q
switchport trunk allowed vlan 100
switchport mode trunk
switchport vlan mapping enable
switchport vlan mapping 201 100
no ip address
channel-protocol lacp
channel-group 20 mode active
!
interface GigabitEthernet2/15
Using the Service Control Engine and Deep Packet Inspection in the Data Center
OL-13955-01
9
Service Control Engine Insertion Strategies
description <<< Connected to SCE-1 host side >>>
switchport
switchport trunk encapsulation dot1q
switchport trunk allowed vlan 100
switchport mode trunk
switchport vlan mapping enable
switchport vlan mapping 201 100
no ip address
channel-protocol lacp
channel-group 20 mode active
!
Network Side Configuration
•
Port configuration—Net side:
!
interface GigabitEthernet5/1
switchport
switchport access vlan 201
switchport mode access
no ip address
load-interval 30
!
•
Port configuration—Net side:
!
interface GigabitEthernet1/13
description <<< Connected to Backup Net >>>
switchport
switchport trunk encapsulation dot1q
switchport trunk allowed vlan 201
switchport mode trunk
switchport vlan mapping enable
switchport vlan mapping 100 201
no ip address
no cdp enable
channel-protocol lacp
channel-group 10 mode active
lacp port-priority 65535
!
interface GigabitEthernet1/14
description <<< Connected to SCE-2 Net >>>
switchport
switchport trunk encapsulation dot1q
switchport trunk allowed vlan 201
switchport mode trunk
switchport vlan mapping enable
switchport vlan mapping 100 201
no ip address
channel-protocol lacp
channel-group 10 mode active
!
interface GigabitEthernet1/15
description <<< Connected to SCE-1 Net >>>
switchport
switchport trunk encapsulation dot1q
switchport trunk allowed vlan 201
switchport mode trunk
switchport vlan mapping enable
switchport vlan mapping 100 201
no ip address
channel-protocol lacp
channel-group 10 mode active
Using the Service Control Engine and Deep Packet Inspection in the Data Center
10
OL-13955-01
Service Control Engine Insertion Strategies
!
MGSCP Layer 2/Layer 3 Dispatch Mode
When deploying the MGSCP solution in a mixed Layer 2/Layer 3 environment; for example, at the
aggregation layer where the host-facing ports are Layer 2 and the core-facing ports are Layer 3, the only
change needed is for a switched virtual interface (SVI) to allow packets to be routed in and out of the
network EtherChannel. (See Figure 6.)
Figure 6
Layer 2/Layer 3 Deployment
SVI 201
IP Address 10.10.1.x
L2 Port - VLAN
L3 Port Network
Return
Flows
Etherchannel
Bundle “Y”
VLAN 201
Trunk
221679
Etherchannel
Bundle “X”
VLAN 101
Trunk
SCE 2000
MGSCP Layer 3 Dispatch Mode
In the event that MGSCP needs to be deployed in an all-Layer 3 environment; for example, at the core
layer of the data center or at the aggregation layer when running a completely routed data center design,
you need to use an ACL on the 6500/7600 to define an action for a range of IP addresses. The
EtherChannel is now configured as Layer 3 with an assigned IP address, but the hashing algorithm still
occurs based on the flow IP address. (See Figure 7.)
Figure 7
Complete Layer 3 Deployment
10.2.1.x
10.1.1.x
Network
PB
Return
Flows
Etherchannel
Bundle “X”
10.20.1.x
Etherchannel
Bundle “Y”
10.10.1.y
SCE 2000
221680
Single IP User
Generated Flow
Using the Service Control Engine and Deep Packet Inspection in the Data Center
OL-13955-01
11
SCE Management and Policy Creation
N+1 Redundancy
The MGSCP solution takes advantage of the network infrastructure to provide for an N+1 level of
failover support. EtherChannel links can be monitored using Link Aggregation Control Protocol
(LACP). LACP allows for some links in the bundle to be active while others are waiting in standby mode.
When an active link fails, one of the standby links is moved into the active list. Because the SCE devices
are “bump in the wire”, if a link on one side of the SCE fails, the opposite link must be brought down as
well. The SCE devices can be configured with a “link reflection” for sub-second recognition. LACP also
has a fast timeout configuration to detect a failed link in a bundle. This detection can occur within 1–2
seconds. (See Figure 8.)
Figure 8
Link Failure
Keepalive
LACP
Active
Link
Failure
Port
Shutdown
221681
Link
Reflection
SCE Management and Policy Creation
The SCE solution relies heavily on the management stations for configuration and day-to-day operation.
The Engage Console becomes the primary operational window that operators use to control network
policy and to generate reports, as well as to configure SCE units operations. (See Figure 9.)
Using the Service Control Engine and Deep Packet Inspection in the Data Center
12
OL-13955-01
SCE Management and Policy Creation
Figure 9
SCAS BB Console Window
For example, the Network Navigator tab allows the operator to see the SCE units in operation and to
group them in a logical collection. (See Figure 10.)
This is also where policies can be deployed to the SCE units; either to a single SCE device, or to a
collection of SCE units. It may be useful for an operator to configure a policy and deploy it to one SCE
device. Then, upon checking for issues such as performance impact and desired behavior, they can
deploy the policy to the rest of the SCEs in the network.
Using the Service Control Engine and Deep Packet Inspection in the Data Center
OL-13955-01
13
SCE Management and Policy Creation
Figure 10
Network Navigator Tab
Deploying a New SCE
This section outlines the steps necessary to install a new SCE into the network and bring it into
production.
Note
Step 1
A console connection is required.
Run the setup script, and enter basic configuration information such as IP address, netmask, SNMP
strings, NTP, and DNS. (See Figure 11.)
Using the Service Control Engine and Deep Packet Inspection in the Data Center
14
OL-13955-01
SCE Management and Policy Creation
Figure 11
Step 2
Basic Configuration of SCE
Connect the cabling of the device to the network. (See Figure 12.)
Ensure that you have provisioned the network completely, as previously outlined.
Figure 12
Step 3
Cable the SCE to the Network
Using the SCAS BB console, add the SCE into the Network Navigator tab. (See Figure 13.)
You need to provide the IP address and the name of the device.
Using the Service Control Engine and Deep Packet Inspection in the Data Center
OL-13955-01
15
SCE Management and Policy Creation
Figure 13
Step 4
To ensure that the device is ready for policy deployment, it is important to ensure that the latest firmware
has been installed on the device. (See Figure 14.)
Figure 14
Step 5
Adding the SCE to the Network Navigator
Downloading Latest Firmware to the New SCE
The final step is to deploy any custom policies that have been created to the unit. (See Figure 15.)
When this step is complete, the unit is now in sync with any other SCE engines deployed in the cluster.
Using the Service Control Engine and Deep Packet Inspection in the Data Center
16
OL-13955-01
SCE Management and Policy Creation
Figure 15
Deploy Site Policy Configuration (PQB)
Changing a Policy
As a routine course of operation, the policies in place may need to be adjusted for things such as new
applications, higher or lower bandwidth demands, and so on. The steps to edit a policy are as follows.
Step 1
In this example, the global service policy is changed to limit P2P traffic from 30 percent to 25 percent.
This is accomplished by first opening the Policy Editor in the SCAS BB console. (See Figure 16.)
You can adjust the bandwidth in a uni-directional fashion so care should be taken to ensure you
understand which traffic flow you want to impact.
Using the Service Control Engine and Deep Packet Inspection in the Data Center
OL-13955-01
17
SCE Management and Policy Creation
Figure 16
Step 2
Policy Editor Window
After the policy is updated, select the SCE devices to which this policy is to be downloaded; either an
individual SCE or a group. (See Figure 17.)
Using the Service Control Engine and Deep Packet Inspection in the Data Center
18
OL-13955-01
SCE Management and Policy Creation
Figure 17
Applying Policy to the SCE
Updating Signatures
This section deals with the routine updating of the signature files. Cisco publishes protocol packs that
customers can download. Cisco recommends that customers use the latest release of the protocol pack
because these updates provide greater application awareness.
After downloading the protocol pack, the network operator uses the SCAS BB Console to select the
SCE(s) to which to deploy the protocol pack. The updates can then be installed. (See Figure 18.)
It is useful to keep all the SCE(s) in one location or cluster on the same protocol pack.
Using the Service Control Engine and Deep Packet Inspection in the Data Center
OL-13955-01
19
Reports
Figure 18
Updating the Signature Pack
Reports
The ability to collect, analyze, and report are a key feature of the SCE product. Following is a list of
many of the reports that are part of the Service Control solution. Users can customize existing reports or
create new report types. Through the use of the protocol packs that Cisco distributes routinely, the SCE
solution stays current with new signature files and port-based applications. Users can again define their
own signatures, but the product has built-in support for 100+ protocols.
The following are examples of the reports generated by the Service Control solution.
•
General reports
– Both direction bandwidth per service
– Relative consumption of top 20 subscribers
– Browsing counters service popularity
– Services for a given subscriber
– Top protocols by total volume
– Global aggregated usage per service
Using the Service Control Engine and Deep Packet Inspection in the Data Center
20
OL-13955-01
Reports
– Global concurrent session per service
– Hourly top 20 subscribers
– Global hourly usage volume downstream per service
•
Voice reports
– Bi-directional bandwidth per VoIP service
– Global concurrent session per VoIP service
– Global hourly call minutes per VoIP service
– Hourly SIP top talkers
– Top SIP domains by volume
•
Streaming reports
– Top streaming hosts by volume
– Top RSTP hosts ordered by volume
•
P2P reports
– Subscribers using P2P
– Top P2P protocols by total volume
– Top P2P downloaders
•
E-mail and news reports
– Top newsgroups by volume
– Top newsgroups by hit count
– Top e-mail recipients by volume
– Top e-mail senders by volume
•
Security reports
– Global DoS rate
– Global scan attack rate
– Infected subscribers
– Top scanning/attacking host
– Top DoS attacked host
– Top DoS attacked subscribers
Example reports are shown in the following figures.
Using the Service Control Engine and Deep Packet Inspection in the Data Center
OL-13955-01
21
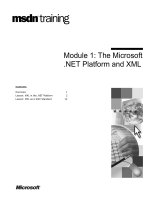
Reports
Figure 19
Global Bandwidth per Service
Using the Service Control Engine and Deep Packet Inspection in the Data Center
22
OL-13955-01
Reports
Figure 20
Global Bandwidth per Service—Downstream Direction
Using the Service Control Engine and Deep Packet Inspection in the Data Center
OL-13955-01
23
Reports
Figure 21
Daily Usage Volume
Using the Service Control Engine and Deep Packet Inspection in the Data Center
24
OL-13955-01
Reports
Figure 22
Top Subscribers in Selected Service
Using the Service Control Engine and Deep Packet Inspection in the Data Center
OL-13955-01
25