Availability of macronutrients and their relationship with some soil properties in molisols of Udham Singh Nagar district of Uttarakhand, India
Bạn đang xem bản rút gọn của tài liệu. Xem và tải ngay bản đầy đủ của tài liệu tại đây (196.46 KB, 6 trang )
Int.J.Curr.Microbiol.App.Sci (2017) 6(6): 234-240
International Journal of Current Microbiology and Applied Sciences
ISSN: 2319-7706 Volume 6 Number 6 (2017) pp. 234-240
Journal homepage:
Original Research Article
/>
Availability of Macronutrients and their Relationship with some Soil
Properties in Molisols of Udham Singh Nagar District of Uttarakhand, India
Vineet Kumar, Ajaya Srivastava, Shiv Singh Meena* and Sarvesh Kumar
Department of Soil Science, College of Agriculture,
GBPUA & T, Pantnagar, U.S. Nagar, Uttarakhand 263145, India
*Corresponding author
ABSTRACT
Keywords
Macronutrients,
Physico-chemical
properties,
Fertilizer
recommendations
and Udham Singh
Nagar
Article Info
Accepted:
04 May 2017
Available Online:
10 June 2017
An investigation was carried out to study the distribution of available
macronutrients (N, P, K and S) and their relationship with some physico-chemical
properties of soil of different blocks of district Udham Singh Nagar
(Uttarakhand).The soils of the district were found sufficient in Phosphorus,
Potassium and Sulphur but low in available Nitrogen content. In general the
macronutrients were correlated significantly and negatively with pH and positively
with organic carbon of the soil. The values of the organic carbon, Alkaline
KMnO4 extractable N, Olsen’s P and neutral normal Ammonium Acetate
extractable K in the Udham Singh Nagar district ranged between 0.13-1.64 per
cent, 125.44-338.68 kg N ha-1, 7.34-76.70 kg P2O5 ha-1 and 66.08-271.04 kg K2O
ha-1, respectively. From the above findings it may be concluded that the soils of
Udham Singh Nagar district are low in nitrogen, sufficient in phosphorus & in
potassium, Except Sitarganj, Jaspur and Bazpur samples were low in potassium,
sufficient in sulphur except Rudrapur. These findings from present study can
successfully be utilized for the larger parts of Tarai region of Uttarakhand as
effective guide for efficient and balanced fertilizer recommendations.
Introduction
Soil plays a major role in determining the
sustainable productivity of an agroecosystem. The sustainable productivity of a
soil mainly depends upon its ability to supply
essential nutrients to the growing plants. The
deficiency of micronutrients has become
major constraint to productivity, stability and
sustainability of soils. The availability of
some plant nutrients is greatly affected by soil
pH. The ideal soil pH is close to neutral, and
neutral soils are considered to fall within a
range from a slightly acidic pH of 6.5 to
slightly alkaline pH of 7.5. It has been
determined that most plant nutrients are
optimally available to plants within 6.5–7.5
pH range, also this range of pH is generally
very compatible to plant root growth.
Nitrogen (N), Potassium (K), and Sulphur (S)
are major plant nutrients that appear to be less
affected directly owing to variation in soil pH
than many others, but still are to some extent.
Nitrogen is primarily responsible for
vegetative growth. Nitrogen assimilation into
amino acids is the building block for protein
in the plant. It is a component of chlorophyll
235
Int.J.Curr.Microbiol.App.Sci (2017) 6(6): 234-240
and is required for several enzyme reactions.
Phosphorus is a major component in plant
DNA and RNA. Phosphorus is also critical in
root development, crop maturity and seed
production. The role of potassium in the plant
is indirect, meaning that it does not make up
any plant part. Potassium is required for the
activation of over 80 enzymes throughout the
plant. It's important for a plant's ability to
withstand extreme cold and hot temperatures,
drought and pests. Potassium increases water
use efficiency and transforms sugars to starch
in the grain-filling process. S is essential in
forming plant proteins because it is a
constituent of certain amino acids. It is
actively involved in metabolism of the B
vitamins biotin and thiamine and co-enzyme
A. S aids in seed production, chlorophyll
formation, nodule formation in legumes, and
stabilizing protein structure.
roller, passed through a 2 mm sieve and
stored in a labeled polythene bags.Soil texture
of soil was determined with the help of
bouyoucous hydrometer method (Moodie et
al., 1959). The pH of the soil was determined
in 1:2 (soil:water) ratio after half an hour of
equilibrium using glass electrode on a digital
pH meter (Jackson, 1967). Electrical
conductivity of the soil sample was measured
in 1:2 (soil: water suspension) at 25ºC using
conductivity meter (Bower and Wilcox,
1965). Organic carbon content in the soil was
determined by modified Walkley and Black
method (1934) as described by Jackson
(1967). Available nitrogen was estimated by
alkaline KMnO4 method (Subbiah and Asija,
1956). Available phosphorus was extracted by
Olsen’s method (Olsen et al., 1954) using
0.5M NaHCO3 (pH 8.5) and developing the
blue colour with ascorbic acid method of
Murphy and Riley (1962). The intensity of
blue
colour
was
recorded
on
spectrophotometer at 882 nm. Potassium was
determined by using neutral ammonium
acetate as extractant (Hanway and Hiedal,
1952). Potassium concentrations in the
extracts were read by using flame photometer.
Final values in soil were reported in kg ha-1.
The 0.15% calcium chloride extractable
sulphur was determined by the method
suggested by Williams and Steinbergs (1959).
Most of the blocks were high in pH value; this
might be due to presence of calcium
carbonate and soluble salts and exchangeable
sodium on exchange complex which gave
soils higher pH. The observed value of soil
pH was quite comparable to that observed
earlier by Kumar (1988) for soils of Siwaya
(Meerut).
In Uttarakhand the farmers are not aware how
pH, EC and soil texture affects the availability
of major nutrients in soil, which surely affects
the crop growth and production of the crops.
So keeping this fact in mind the present study
“Availability of Macronutrients and their
Relationship with some Soil Properties in
Molisols of Udham Singh Nagar District of
Uttarakhand” is done.
Materials and Methods
The present study was conducted on the soils
of different villages of district Udham Singh
Nagar which is situated in Uttarakhand state.
The soil and plant sample (Wheat) were taken
from each block of district, 6 soil samples
were collected from a single block. RudrapurTanda Range, Gadarpur- Madnapur, JaspurTeerghari, Bazpur- Keshowala, SitarganjBaikunthapur, Kashipur- Dhakia Kalan and
Khatima- Jhankat. Analysis of pH through pH
meter, Electrical conductivity by EC meter,
Organic carbon by Walkley and Black
method. The samples were air dried, crushed
on hard wooden slab with the help of wooden
The high EC values possibly due to higher
clay content might have encouraged greater
retention of salt. On the basis of limits
suggested by Muhr et al., (1965) for judging
salt problem of soils, all the samples were
found normal (EC < 1.0 dSm-1).
236
Int.J.Curr.Microbiol.App.Sci (2017) 6(6): 234-240
of 50.83 kg P2O5 ha-1 in Jaspur block, 31.8262.42 kg P2O5 ha-1 with a mean of 40.25 kg
P2O5 ha-1 in Kashipur block and 11.01-65.69
kg P2O5 ha-1 with a mean of 29.51 kg P2O5 ha1
in Bazpur block.
Organic carbon content in soils of Rudrapur
block because the soils collected from the
Tnada range which is a under forest area.
Soils in low organic carbon (Khatima, 0.45
%) are possibly because of high temperature
and good aeration in the soil which increased
the rate of oxidation of organic matter.
The higher value of P2O5 in some blocks of
Udham Singh Nagar district might be due to
good organic carbon, about neutral soil pH
and less fixation of P. Similar reason was also
suggested by Shah (1999) in some soils of
western U.P.
Results and Discussion
Nitrogen
Available nitrogen extracted by alkalineKMnO4 method of the experimental district
Udham Singh Nagar showed in table 1, varied
from 125.44-338.68 kg N ha-1 with mean
value of 187.26 kg N ha-1. Block wise values
ranged from 175.61 to 301.05 kg N ha-1 with
a mean of 202.79 kg N ha-1 in Rudrapur
block, 150.52-338.68 kg N ha-1 with a mean
of 209.06 kg N ha-1 in Gadarpur block,
125.44-288.51 kg N ha-1 with a mean of
181.88 kg N ha-1 in Sitarganj block, 137.98–
250.88kg N ha-1 with a mean of 198.61)kg N
ha-1 in Khatima block, 125.44-238.33 kg N
ha-1 with a mean of (165.16) kg N ha-1 in
Jaspur block, 137.98–288.51kg N ha-1 with a
mean of 188.16 kg N ha-1 in Kashipur block
and 150.52–200.70kg N ha-1 with a mean of
165.16 kg N ha-1 in Bazpur block.
Potassium
Available potassium extracted by neutral
normal NH4OAC method showed in table 1
ranged from 66.08 to 271.04 kg K ha-1 with
mean value of 130 kg K ha-1. Block wise
values ranged from 133.28-230.72 kg K ha-1
with a mean of (181.81) kg K ha-1 in
Rudrapur block, 138.88-190.4 kg K ha-1with a
mean of 162.21 kg K ha-1 in Gadarpur block,
70.56-120.96 kg K ha-1 with a mean of 103.6
kg K ha-1 in Sitarganj block, 107.52-127.68kg
K ha-1 with a mean of 119.84 kg K ha-1 in
Khatima block, 66.08-92.96kg K ha-1 with a
mean of 75.41 kg K ha-1 in Jaspur block,
98.56-271.04kg K ha-1 with a mean of 171.53
kg K ha-1 in Kashipur block and 71.68117.6kg K ha-1 with a mean of 95.38 kg N ha1
in Bazpur block.
Phosphorus
Available phosphorus extracted by Olsen’s-P
method of the experimental district Udham
Singh Nagar showed in table 1 varied from
7.34 to 76.70 kg P2O5 ha-1 with mean value of
34.93 kg P2O5 ha-1. Block wise values ranged
from 21.21 to 76.29 kg P2O5 ha-1 with a mean
of 47.77 kg P2O5 ha-1 in Rudrapur block,
7.34-59.57 kg P2O5 ha-1 with a mean of 22.44
kg P2O5 ha-1 in Gadarpur block, 16.32–40.80
kg P2O5 ha-1 with a mean of 27.77 kg P2O5 ha-1
in Sitarganj block, 7.54-58.55 kg P2O5 ha-1
with a mean of 25.97 kg P2O5 ha-1 in Khatima
block, 35.49-76.70 kg P2O5 ha-1 with a mean
Jaspur block have highest K content in whole
district might be due to the higher content of
organic carbon. Shah (1999) also suggested
the same reason for the soils of western U.P.
Sulphur
The soil samples of Rudrapur block were
have low in (Table 1) sulphur content ranged
from 2.41-12.07 ppm with a mean value of
6.72 ppm. The soil samples of Gadarpur block
were high in sulphur content ranged from
4.45 to 42.5 ppm with a mean value of 21.5
237
Int.J.Curr.Microbiol.App.Sci (2017) 6(6): 234-240
ppm. The soil samples of Sitarganj block
were medium in sulphur content ranged from
9.32 to 31.40 ppm with a mean value of 20.47
ppm. The soil samples of Khatima block were
high in sulphur content ranged from 14.23 to
41.2 ppm with a mean value of 24.04 ppm.
The soil samples of Jaspur block were
medium in sulphur content ranged from 4.46
to 22.31 ppm with a mean value of 15.10
ppm. The soil samples of Kashipur block
were medium in sulphur content ranged from
4.469 to 40.17 ppm with a mean value of
14.34 ppm. The soil samples of Bazpur block
were medium in sulphur content ranged from
8.92 to 25.14 ppm with a mean value of 16.67
ppm.
The higher content of available S in Gadarpur
and Khatima block might be due to higher pH
and finer fractions of soil. The observed value
of available S was quite comparable to that
observed earlier by Dixit (1992) for the soils
of Ram ganga – Kosi interbasin.
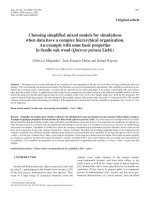
Table.1 Availability of macronutrients in different blocks
Blocks
Rudrapur
Gadarpur
Sitarganj
Khatima
Jaspur
Kashipur
Bazpur
Udham Singh
Nagar
Alkaline
KMnO4-N
(kg ha-1)
175.61-301.05
(202.79)
150.52-338.68
(209.06)
125.44-288.51
(181.88)
137.98-250.88
(198.61)
125.44-238.33
(165.16)
137.98-288.51
(188.16)
150.52-200.70
(165.16)
125.44-338.68
(187.26)
Olsen’s-P
(kg ha-1)
NH4OAc-K
(kg ha -1)
S
(ppm)
25.69-76.29
(47.77)
7.34-59.57
(22.44)
16.32-40.80
(27.77)
7.54-58.55
(25.97)
35.49-76.70
(50.83)
31.82-62.42
(40.25)
11.01-65.69
(29.51)
7.34-76.70
(34.93)
133.28-230.72
(181.81)
138.88-190.4
(162.21)
70.56-120.96
(103.6)
107.52-127.68
(119.84)
66.08-92.96
(75.41)
98.56-271.04
(171.73)
71.68-117.6
(95.38)
66.08-271.04
(130)
2.41-12.07
(6.72)
4.45-42.5
(21.5)
9.32-31.40
(20.47)
14.23-41.2
(24.04)
4.46-22.31
(15.10)
4.46-40.17
(14.34)
8.92-25.14
(16.67)
2.41-42.5
(17.42)
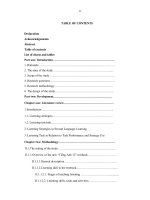
Table.2 Correlation of soil properties with nutrient status in the soils of Udham Singh Nagar
Soil properties
pH
EC
O. C.
Clay
Silt
Sand
N
0.026
-0.043
0.124
-0.028
0.072
-0.066
P
-0.456*
-0.397
0.335*
-0.378*
-0.056
0.262
238
K
-0.158
0.166
0.071
0.218
0.047
-0.167
S
-0.051
0.180
-0.119
-0.142
0.104
-0.040
Int.J.Curr.Microbiol.App.Sci (2017) 6(6): 234-240
Sitarganj, jaspur and bazpur samples were
low in potassium, sufficient in sulphur except
Rudrapur. The soil pH found slightly alkaline
in Rudrapur, Gadarpur, Sitarganj and Bazpur,
medium acidic in Khatima, slightly acidic in
Kashipur and in neutral range in Jaspur
district. Salinity effects mostly negligible,
organic carbon is high in whole district except
low in khatima and medium in Jaspur and
Kashipur. A more detailed fertility survey is
required to verify the deficiency of macro and
micro nutrients in the region. Further, pot
culture and field experiment are required to be
undertaken in future to verify the validity of
critical limits of these nutrients likely to be
deficient in the study area.
Nutrient status
As shown in table 2, in soils of Udham Singh
Nagar District of Uttarakhand, the soil pH
showed significant and negative correlation
with available P (r = -0.456) at 5 percent level
of significance, positive non-significant
correlation with N (r = 0.026) and negative
non-significant correlation with K (r = -0.158)
and S (r = -0.051). The electrical conductivity
also showed non-significant and negative
correlation with available P (r = -0.397),
positive non-significant correlation with K (r
= 0.166) and S (r = 0.180) and negative nonsignificant correlation with N (r = -0.0430).
The organic carbon showed positive and nonsignificant correlation with available N (r =
0.124), K (r = 0.071), negative and nonsignificant correlation with S (r = -0.119) and
significant positive correlation with P (r =
-0.335) at 5 percent level of significance.
References
Bower, C. A. and Wilcox, L. A. (1965).
Soluble salts. In: black C.A. et al, (Ed.).
Method of soil analysis, part 2, ASA,
Inc. Madison, Wis, USA. Pp. 433-451.
Dixit A. K. (1992). Chemo-edaphological
characterization of Bhabar-tarai plain
transect
soils
of
RamgangaKosiinterbasin. Thesis. Ph. D. (Soil
Science) G. B. Pant Univ. of Agric.
Tech., Pantnagar.
Hanway, J. J. and Hiedal, H. (1952). Soil
analysis method used in lowa State Soil
Testing Laboratory. Iowa Agric. (c.f.
methods of soil analysis, part 2 Ed. C.A.
Black, Medison Wisconsin). American
Soc. Agron., 57: 1025-1027.
Kumar, S. (1988). Studies on the status of
micronutrients in the soils of Bareilly
division of Uttar Pradesh. M. Sc.
Thesis, submitted to Govind Ballabh
Pant Univ. of Agric. and Tech,
Pantnagar.
Moodie, G. E.; Smith W. H. and McGreery,
R. A. (1959). Laboratory Manual for
Soil Fertility. Dept. Agron., Washington
State College, USA. pp: 31-39.
The clay showed negative and significant
correlation with available P (r = -0.378),
negative non-significant correlation with N
(r = -0.028), S (r = -0.142) and non-significant
positive correlation with K (r = 0.218). The
silt showed positive but non-significant
correlation with available N (r = 0.072), K
(r = 0.047) and S (r = 0.104) while it showed
negative and non-significant correlation with
available P (r = -0.056). The sand showed
positive and non-significant correlation with
available P (r = 0.262), negative correlation
with N (r = -0.066), K (r = -0.167) and S (r = 0.040) but the values of correlation
coefficients were statistically non-significant.
In conclusion, the present study was made to
estimate available macronutrients (N, P, K
and S some physico – chemical properties in
soils of Udham Singh Nagar District of
Uttarakhand. From the above findings it may
be concluded that the soils of Udham Singh
Nagar district are low in nitrogen, sufficient
in phosphorus and in potassium, Except
239
Int.J.Curr.Microbiol.App.Sci (2017) 6(6): 234-240
Murphy, J. and Riley, J. P. (1962).A modified
single solution method for the
determination of phosphate in natural
waters.Anal.Chim.Acta. 27: 31-36.
Jackson, M. L. (1967). Soil chemical analysis.
Prentice Hall of India (P) Ltd., New
Delhi. pp. 183-192.
Olsen, S. R.; Cole, C. V.; Watanabe, F. S. and
Dean, L. A. (1954). Estimation of
available phosphrous in soils by
extraction with sodium bicarbonate.
USDA. Circ. 939 pp.
Muhr, G. R.; Datta, N. P.; Subraney, N. S.;
Dever, F.; Lecy, V. K. and Donahue, R.
R. (1963). Soiltesting of India.USAID
Mission to India. 3(3): 87-92.
Shah, S. K. (1999). Distributin of nutrients in
some soils of western Uttar Pradesh and
their relationship with some soil
properties. Thesis, M.Sc. G. B. Pant
Univ. of Agric. and Tech., Pantnagar.
Walkley, A. and Black, C. A. (1934). An
examination of different method for
determining soil organic carbon and a
proved modification of chromic acid
titration method. Soil Sci., 37: 29-38.
Williams, C. H. and Steinbergs, A. (1959).
Soil sulphur fractions as chemical
indices of available sulphur in some
Australian soils.Aust. J. Agric. Res. 10:
342-352.
Yuan, J. P., Peng, J., Yin, K. and Wang, J. H.
2011. Potential health-promoting effects
of astaxanthin: A high-value carotenoid
mostly from microalgae. Mol Nutr Food
Res. 55: 150–165.
How to cite this article:
Vineet Kumar, Ajaya Srivastava, Shiv Singh Meena and Sarvesh Kumar. 2017. Availability of
Macronutrients and their Relationship with some Soil Properties in Molisols of Udham Singh
Nagar District of Uttarakhand, India. Int.J.Curr.Microbiol.App.Sci. 6(6): 234-240.
doi: />
240