Functional proteomic analysis reveals the involvement of KIAA1199 in breast cancer growth, motility and invasiveness
Bạn đang xem bản rút gọn của tài liệu. Xem và tải ngay bản đầy đủ của tài liệu tại đây (3.86 MB, 16 trang )
Jami et al. BMC Cancer 2014, 14:194
/>
RESEARCH ARTICLE
Open Access
Functional proteomic analysis reveals the
involvement of KIAA1199 in breast cancer
growth, motility and invasiveness
Mohammad-Saeid Jami1†, Jinxuan Hou1,2†, Miao Liu1, Michelle L Varney1, Hesham Hassan1, Jixin Dong3,
Liying Geng3, Jing Wang3, Fang Yu4, Xin Huang1, Hong Peng1, Kai Fu1, Yan Li2, Rakesh K Singh1*
and Shi-Jian Ding1,5*
Abstract
Background: KIAA1199 is a recently identified novel gene that is up-regulated in human cancer with poor survival.
Our proteomic study on signaling polarity in chemotactic cells revealed KIAA1199 as a novel protein target that
may be involved in cellular chemotaxis and motility. In the present study, we examined the functional significance
of KIAA1199 expression in breast cancer growth, motility and invasiveness.
Methods: We validated the previous microarray observation by tissue microarray immunohistochemistry using a
TMA slide containing 12 breast tumor tissue cores and 12 corresponding normal tissues. We performed the
shRNA-mediated knockdown of KIAA1199 in MDA-MB-231 and HS578T cells to study the role of this protein in cell
proliferation, migration and apoptosis in vitro. We studied the effects of KIAA1199 knockdown in vivo in two groups
of mice (n = 5). We carried out the SILAC LC-MS/MS based proteomic studies on the involvement of KIAA1199 in
breast cancer.
Results: KIAA1199 mRNA and protein was significantly overexpressed in breast tumor specimens and cell lines as
compared with non-neoplastic breast tissues from large-scale microarray and studies of breast cancer cell lines and
tumors. To gain deeper insights into the novel role of KIAA1199 in breast cancer, we modulated KIAA1199
expression using shRNA-mediated knockdown in two breast cancer cell lines (MDA-MB-231 and HS578T), expressing
higher levels of KIAA1199. The KIAA1199 knockdown cells showed reduced motility and cell proliferation in vitro.
Moreover, when the knockdown cells were injected into the mammary fat pads of female athymic nude mice, there
was a significant decrease in tumor incidence and growth. In addition, quantitative proteomic analysis revealed that
knockdown of KIAA1199 in breast cancer (MDA-MB-231) cells affected a broad range of cellular functions including
apoptosis, metabolism and cell motility.
Conclusions: Our findings indicate that KIAA1199 may play an important role in breast tumor growth and
invasiveness, and that it may represent a novel target for biomarker development and a novel therapeutic target for
breast cancer.
Keywords: Breast cancer, KIAA1199, Quantitative proteomic analysis
* Correspondence: ;
†
Equal contributors
1
Department of Pathology and Microbiology, University of Nebraska Medical
Center, Omaha, NE 68198, USA
5
Biomarker Discovery and Development Laboratory, Sanford-Burnham
Medical Research Institute at Lake Nona, Orlando, FL 32827, USA
Full list of author information is available at the end of the article
© 2014 Jami et al.; licensee BioMed Central Ltd. This is an Open Access article distributed under the terms of the Creative
Commons Attribution License ( which permits unrestricted use, distribution, and
reproduction in any medium, provided the original work is properly credited.
Jami et al. BMC Cancer 2014, 14:194
/>
Background
Breast cancer as the most commonly diagnosed and the
second leading cause of cancer-related death in women,
is responsible for approximately 40,000 deaths in the
United States each year [1]. At the time of diagnosis, a
majority of patients have metastases to regional and
distant sites, which is a major cause of cancer-related
mortality [2]. Chemotaxis, cellular migration driven by
chemokine gradients, is a critical process involved in
tumor invasion and metastasis in various types of cancers
including breast cancer [2]. Cell migration is a highly polarized process characterized by protrusion of a leading
pseudopodium at the front and establishment of a trailing
rear compartment or tail region at the back. Our earlier,
comprehensive proteomic analysis of the pseudopodium
and cell body in chemotactic cells provided a rich source
of information for investigating key signaling pathways
and proteins involved in chemotaxis and cancer metastasis
[3]. When we compared our pseudopodium proteome
dataset with the breast cancer gene expression dataset
[4], a protein without a defined function in breast cancer, KIAA1199, caught our attention, as only identified
in pseudopodium and highly up-regulated in aggressive
breast cancer tissues and cells.
The KIAA1199 gene which was first discovered to be
involved in non-syndromic hearing loss is expressed in a
wide range of normal human tissues, with the highest
expression level in brain [5]. The KIAA1199 gene is located on 15q25, where a brain tumor suppressor gene has
been mapped [6]. It is highly expressed in three basal type
B breast cancer cell lines (HS578T, MDA-MB-231, and
BT549) and the expression of this gene is significantly correlated with the invasive ductal carcinoma type of breast
cancer [7]. Also, the high expression of KIAA1199 in gastric tumors is associated with a poor prognosis and with
lymph node metastasis [8]. These findings are consistent
with a recent report which showed that repression of
KIAA1199 attenuates Wnt-signaling and decreases the
proliferation of colon cancer cells [9]. Other studies
have shown that up-regulation of the KIAA1199 gene is
associated with cellular mortality [10] and that the
KIAA1199 expression level is significantly elevated upon
p53 activation [11]. Based on these observations, we
hypothesized that KIAA1199 is a novel regulator of breast
cancer growth and aggressiveness.
In this report, we demonstrated the overexpression of
KIAA1199 mRNA and protein in breast tumors and invasive cell lines as compared to non-neoplastic tissue
and non-invasive cells. Knockdown of KIAA1199 inhibited
cell proliferation and motility in vitro and tumor incidence
and growth in vivo. Our comprehensive functional proteomic study to analyze the consequences of KIAA1199
knockdown in the breast cancer cell line MDA-MB-231
demonstrate that KIAA1199 may play an important role
Page 2 of 16
in the pathogenesis of breast cancer and that it may represent a novel therapeutic target for breast cancer.
Methods
Reagents and cell culture
Fetal bovine serum (FBS), phosphate buffered saline
(PBS), Dulbecco’s minimum essential medium (DMEM),
penicillin, G418, streptomycin and the rabbit monoclonal
anti-cleaved caspase 3 (clone 9H19L2) were purchased
from Invitrogen (Gaithersburg, MD). Lysine and Arginine
depleted DMEM, McCoy’s 5A medium, Hank’s balanced
salt solution (HBSS), depleted FBS, L-[12C6]arginine,
L-[12C6]lysine, L-[13C6]arginine, and L-[13C6]lysine were
obtained from Thermo Scientific (Rockford, IL). PGPH1/
GFP/NEO shRNA expression vector was obtained from
Genepharma (Shanghai, China). Acrylamide, bis, tris base,
glycine, ammonium persulphate, PVDF membrane, TEMED,
DTT, SDS, urea, thiourea, glycerol, 3-(4,5-dimethylthiazol2-yl)-2,5-diphenyltetrazolium bromide (MTT), ammonium bicarbonate, DMSO, ECL, bromoplenol blue were
purchased from Fisher Scientific (Pittsburgh, PA). AnnexinV-FLUOS Staining Kit was purchased from Roche Applied
Science (Mannheim, Germany). The cell culture dish and
transwell® with 8.0 μm pore polycarbonate membrane filters
were obtained from Corning Corp (Corning, NY). The
rabbit polyclonal anti-KIAA1199 antibody, trypsin and trypan blue were obtained from Sigma-Aldrich (St. Louis,
MO). Another rabbit polyclonal anti-KIAA1199 antibody
was obtained from Protein Tech Group (Chicago, IL). The
mouse monoclonal anti-proliferating cell nuclear antigen
(PCNA) and rabbit polyclonal anti-alpha-tubulin were respectively purchased from Santa Cruz (CA) and Abcam
(MA).
MDA-MB-231 and Hs578T cells (obtained from ATCC
(Manassas, VA)) were cultured in DMEM containing 10%
FBS, 100 U/ml penicillin and 100 μg/ml streptomycin at
37˚C in an atmosphere containing 5% CO2. The SILAC
labeling was performed according to the manufacture’s
protocol. The lysine and arginine depleted DMEM
medium supplemented with L-[12C6]arginine and L-[12C6]
lysine was used for light condition and the depleted
DMEM medium supplemented with L-[13C6]arginine and
L-[13C6]lysine was used for heavy condition.
Knockdown of KIAA1199 by shRNA-mediated RNA
interference
Four different sets of annealed oligonucleotides specific
for the KIAA1199 gene sequence were cloned into the
pGPH1/GFP/NEO shRNA expression vector obtained
from Genepharma (Shanghai, China). These vector constructs (in addition to an empty vector) were transfected
into MDA-MB-231 and Hs578T cells to generate the
KIAA1199 knockdown cells (ShA and ShB) and control
(ShNC) cells respectively. Since the shRNA plasmids
Jami et al. BMC Cancer 2014, 14:194
/>
contain the neomycin resistance gene and green fluorescence protein (GFP) expression cassette the transfected
cells were selected using 400 μg/ml of G418 (Invitrogen,
Carlsbad, MD) and monitored by fluorescent microscopy
(Leica, Bannockburn, IL) and flow cytometry.
Western blot analysis
Western blot analyses were performed on cell lysates
prepared from MDA-MB-231 and Hs578T cell lines as described previously [12]. Briefly, triplicate cell cultures were
first washed with phosphate buffered saline (PBS, Invitrogen) and then lysed by mixing 1:1 with 2× sodium dodecyl
sulphate sample buffer (100 mM Tris–HCl, pH = 6.8,
200 mM DTT, 4% SDS, 20% glycerol and 0.002% bromoplenol blue). Cell lysates were separated by 10% SDSPAGE. Proteins were transferred to PVDF membranes
(Immobilon 0.45 μm, Millipore, USA) and immersed in a
blocking solution containing 5% non-fat milk and 0.1%
Tween-20 for 1 h. The membranes were washed and incubated with primary antibodies (rabbit polyclonal antialpha-tubulin (abcam) at 1:1000 dilution, rabbit polyclonal
anti-KIAA1199 (Sigma-Aldrich) at 1:100 dilution, rabbit
ployclonal anti-KIAA1199 antibody (Protein Tech Group,
Chicago, IL) at 1:800 dilution or rabbit anti-Caspase-3
(8G10) monoclonal antibody (Cell Signaling) at 1:1000
dilution) for 2 h and then with secondary antibodies for
1 h at room temperature. After washing the resulting
bands were visualized using the standard ECL procedure,
quantified by densitometry and normalized to the corresponding α-tubulin bands.
mRNA analysis
Total-RNA was extracted from 1×10⁷ cells (cultured in
triplicate) using Trizol reagent (Invitrogen,Carlsbad,
CA) according to the manufacturer’s instructions. RNA
(2-5 μg) was treated with DNAse I (Promega), then reverse transcribed, using 200 U Superscript II (Invitrogen)
and 250 ng random primers (Invitrogen), according to the
manufacturer’s instructions. The resulting cDNA diluted
1:5 in nuclease-free water and stored in aliquots at −80°C
until used. The RT-PCR amplification of KIAA1199 was
performed with a denaturation step at 95°C for 10 min,
followed by 32 cycles of denaturation at 95°C for 1 min,
primer annealing at 56°C for 30 s, and primer extension at
72°C for 30 s. The PCR conditions varied for S100A11
(35 cycles, annealing at 60°C for 30 s, and primer extension at 72°C for 45 s), WASL (28 cycles, annealing at 60°C
for 45 s, and primer extension at 72°C for 90 s), PPP1R9B
(30 cycles, annealing at 60°C for 30 s, and primer extension at 72°C for 60 s) and GAPDH (30 cycles, annealing at
53°C for 30 s, and primer extension at 72°C for 30 s).
Upon completion of the cycling steps, a final extension at
72°C for 5 min was done for all of the reactions and then
the reactions were stored at 4°C. The bands obtained after
Page 3 of 16
electrophoresis were quantified by densitometry and
their intensities were normalized to that provided by the
GAPDH (Glyceraldehyde 3-phosphate dehydrogenase)
band (relative integral optical density (IOD)) as described
before [13]. The average intensity value of the transcripts
obtained from the negative control cells were set to 100%.
A list of primers is provided in Additional file 1: Table S1.
Cell motility and migration assay
Wound healing assay was performed to determine cellular
motility as described before [14]. Briefly, cells were separately seeded at a density of 5 × 10⁵ cell/well in a 6-well
plate (triplicate for knockdown and control cells) and
grown to confluence in serum containing DMEM media.
The monolayer was scratched using a pipette tip and
washed with PBS to remove floating cells and refed with
serum containing DMEM media. The wounds were
photographed immediately after scratching and again 24 h
refeeding. The inhibition in wound closure was qualitatively evaluated.
In order to quantitatively examine the effect of
KIAA1199 knockdown in breast cancer cells, we performed trans-well motility assays utilizing 6.5 mm
Transwell® with 8.0 μm pore polycarbonate membrane
filters (Corning Corp, Corning, NY). Single cell suspensions were seeded onto the upper surface of the filters
in supplemental serum free McCoy’s 5A medium. The
bottom chamber contained 1.0 ml serum containing
media. MTT (3-(4,5-dimethylthiazol-2-yl)-2,5-diphenyltetrazolium bromide) was added and cells were incubated
for an additional 3 h. Cells from the top of the transwell
chambers were removed using a cotton swab (residual
cells). The transwell chambers (migrated cells) and cotton
swab containing residual cells were plated in separate well
of a 24-well plate containing 400 μl of DMSO. Following
1 h of gentle shaking, 100 μl samples were removed and
absorbancy was determined at 570 nm using a microtiter
plate reader. The percent migratory activity was calculated
as: percent migration = [(A / B) – 1 × 100], where A is the
number of migrated cells and B is the number of residual
cells. Percent migratory activity was compared between
different groups. The assay was performed in triplicate.
Cell proliferation and apoptosis assay
MDA-MB-231 and Hs578T stable cell lines were plated
at 2 × 10³ cells/well in 96-well plates (triplicate for
knockdown and control cells). Following overnight adherence, cells were incubated with serum containing media for
various durations. Cell proliferation was determined by
MTT (3-(4,5-Dimethylthiazol-2-yl)-2,5-diphenyltetrazolium
bromide, a yellow tetrazole) assay. The differences in
absorbance were compared in vector control transfected
cells and KIAA1199 knockdown cells. To determine the
role of KIAA1199 in apoptosis, isogenic variants of
Jami et al. BMC Cancer 2014, 14:194
/>
MDA-MB-231 and Hs578T stable cell lines were grown
in DMEM with 10% FBS. A total of 1×10⁶ cells were
washed with PBS (phosphate buffered saline), collected
and double-stained for Propidium Iiodide (PI) and
Annexin V using the Annexin-V-FLUOS Staining Kit
(Roche Applied Science, Mannheim, Germany) according to the manufacturer’s instructions. The frequency of
apoptotic cells was analyzed using the FACSCalibur
flow cytometer (BD Biosciences, San Jose, CA) with
CellQuest Pro software (BD Biosciences).
Tumor growth assay
Mice were housed and handled according to protocols
approved by the University of Nebraska Medical Center
Institutional Animal Care and Use Committee. Two
groups (n = 5) of female BALB/C nude mice (Charles
River, Wilmington, MA), 6–8 weeks of age, housed under
pathogen free conditions were used. MDA-MB-231-ShNC
and MDA-MB-231-ShB cell monolayers were trypsinized
and washed with Hank’s balanced salt solution (HBSS) 3
times and counted using trypan blue (Sigma) exclusion
dye. Single cell suspensions of 1x10⁶ cells (>95% viability)
in 100 μL were injected into the mammary fat pad. Twice
a week tumor size was measured using digital calipers
(Fisher Scientific, Pittsburgh, PA). Tumor volume was
calculated according to the formula Volume = W2 × L/2,
where W = short diameter, and L = long diameter. Mice
were euthanized and primary tumors were removed and
processed by formalin fixation with subsequent embedding in paraffin for immunohistochemistry.
Immunohistochemical analysis
IHC analysis was performed as described previously
[15] using the rabbit polyclonal anti-KIAA1199 (SigmaAldrich; 1:10 dilution), the rabbit monoclonal anticleaved caspase 3 (CASP3; Invitrogen; 1:500 dilution)
and the mouse monoclonal anti-proliferating cell nuclear antigen (PCNA; Santa Cruz, CA; 1:40 dilution) as
primary antibodies. Tumor sections were deparaffinized
by incubation in EZ-Dewax (BioGenex Laboratories Inc,
San Ramon, CA) and rinsed in distilled water to remove
residual EZ-Dewax. Following nonspecific blocking for
30 min, sections were incubated with primary antibodies overnight at 4°C. Sections were then washed and
subsequently incubated at room temperature with the
respective biotinylated secondary antibodies (1:500 in
PBS) for 45 min. Immunoreactivity was visualized by
incubating the avidin-biotin complex with diaminobenzidine tetrahydrochloride substrate (Vector Laboratories,
Burlingame, CA). The sections were observed microscopically (Nikon, Melville, NY) using 5 × 5 reticle grid
(Klarmann Rulings, Litchfield, NH) and stained cells
and vessels were identified. The slides were lightly
Page 4 of 16
counterstained with Harris hematoxylin and viewed
under a light microscope.
The breast cancer TMA slide (catalog number A712(12)
and A712(13)) was purchased from AccuMax (Seoul,
Korea). A human kidney tissue was used as positive
control. The slide was processed for IHC detection of
KIAA1199 expression with a polyclonal anti-KIAA1199
primary antibody (1:10 dilution; SigmaAldrich). An iSan
Coreo slide scanner (Ventana Medical Systems, AR)
was used to scan the slide at 40× and the resulting images were analyzed by Metamorph Imaging Software
(Molecular Devices, CA) to determine the intensity of
immunostaining. Immunostaining index (arbitrary unit)
was calculated by considering the level of immunostaining
intensity and the area with KIAA1199 positivity.
Quantitative proteomic analysis
MDA-MB-231-ShNC (cultured in light medium) and
MDA-MB-231-ShB Cells (cultured in heavy medium)
were grown in doublet SILAC conditions and the proteomic samples were prepared as previously described [16].
Briefly, MDA-MB-231-ShNC and MDA-MB-231-ShB
cells were seeded at 20–30% confluence and harvested
when cell density reached 90%. After 10 passages, heavy
(Arg6, Lys6) labeled MDA-MB-231-ShB and MDA-MB231-ShNC cells (Light) were harvested separately in 7 M
urea, 2 M thiourea and 50 mM ammonium bicarbonate.
Equal amounts of protein were combined from each condition. Following tryptic digestion and chromatography
separation via strong cation exchange (SCX), a total of 21
fractions of peptide mixtures were subjected to C18
reverse-phase liquid chromatography (Eksigent, Dublin,
CA) coupled online to an LTQ-Orbitrap mass spectrometer (Thermo Scientific, Bremen, Germany). Two
biological replicates were performed. The MS data were
analyzed using the UNiquant software pipeline [16].
Briefly, DeconMSn ( was
used to determine and refine the monoisotopic mass
and charge state of parent ions from the LTQ-Orbitrap
raw data, and to create a peak list of these ions in .mgf
format. The peak list contained the fragment information
such as the MS/MS spectra, refined precursor ion and
charge state. DtaRefinery ( />was used to improve mass measurement errors for parent
ions of tandem MS/MS data by modeling systematic
errors based on putative peptide identifications using
the algorithm as described [16]. A script written in
Python (programming language) was used to automate
the process of generating .mgf files from raw data using
DeconMSn and DtaRefinery. The resulting .mgf file
was submitted to Mascot (version 2.2, Matrix Science,
London, U.K.) database searching against (i) a concatenated
database containing 73,928 proteins from international
protein index (IPI) database (version 3.52), (ii) the
Jami et al. BMC Cancer 2014, 14:194
/>
Page 5 of 16
commonly observed 262 contaminants (forward database), and (iii) the reversed sequences of all proteins
(reverse database). Carbamidomethylation was set as
the fixed modification and oxidation of methionine was
set as the variable modification. The initial mass deviation tolerance of precursor ion was set to 10 ppm and
fragment ion tolerance was set to 0.5 Da. A maximum
of 2 missed cleavages were allowed in peptide identification. Identified peptides were sorted by a descending
order of Quality of Peptide Identification (QPI) which is
defined by the Mascot peptide identification score (a
minimum of 10) divided by the square root of the precursor ion mass error. A cutoff of QPI was applied to
ensure a total false discovery rate (FDR) for peptide
identification < 0.01 evaluated by reverse database approach [16].
Statistical analysis
In vivo data analysis was performed using the Mann–
Whitney U-test for significance. For the quantitative
analysis of differentially expressed proteins identified by
LC-MS/MS, a mixed-effects model with random effects
from the two experimental runs was fit to the log2 of
the protein fold changes to test whether the log2 of protein fold change was significantly different from zero.
Note that a differentially expressed protein is expected
to have a non-zero log2 fold change. The p-value was
calculated and further corrected by the BenjaminiHochberg (BH) procedure [17] to control the false discovery rate to be no more than 0.05. A protein with a
BH corrected p-value equal-to-or-less-than 0.05 was
considered to be statistically significant. For the TMA
analysis immunostaining index was tested using the
paired t-test to determine the significance of difference
between the carcinoma and non-neoplastic cores. The
TMA results were reviewed by three independent
pathologists.
Ethics statement
All procedures performed in vivo tumor growth and metastasis studies were in accordance with institutional
guidelines and approved by the University of Nebraska
Medical Center Institutional Animal Care and Use
Committee.
Results
Expression of KIAA1199 in breast cancer specimens
In order to assess the clinical relevance of KIAA1199 in
breast cancer we performed a bioinformatics study of a
large database of microarray data from cancer experiments
available at the Oncomine website (www.oncomine.org).
We observed the overexpression of KIAA1199 mRNA in
breast tumor tissues (see Discussion) as compared to nonneoplastic tissue (Table 1). We performed a tissue microarray (TMA) analysis to examine the KIAA1199 protein
expression level in breast carcinoma and normal tissues
(Table 2). As shown in the Additional file 2: Figure S1 a
human kidney tissue was used as positive (cells in tubules)
and negative (cells in glomeruli) control for immunohistochemical staining (according to the human protein atlas at
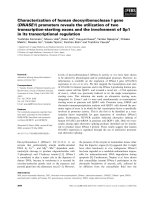
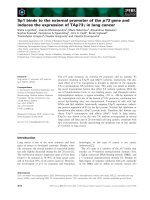
KIAA1199 has the highest expression level in renal tubules). Figure 1 illustrates the
cytosolic localization of KIAA1199 and results of immunohistochemical staining of a TMA slide containing 12
breast tumor tissue cores (rows a, c and e) and 12 corresponding normal tissues (rows b, d and f). We quantified
and evaluated the KIAA1199 protein expression by analyzing the intensity of immunostatining and positive
areas percentage in each core image using the Metamorph software (Zeiss). We observed a 14.66 fold overexpression of KIAA1199 protein in breast tumor tissues
(t-test, p = 0.025) compared to non-neoplastic breast
tissues (Figure 1).
Knockdown of KIAA1199 in breast cancer cell lines
The construction of the silencing vector pGPH1/GFP/
NEO is shown in Additional file 3: Figure S2. Two different sets of annealed oligonucleotides (ShA and ShB) were
used to knockdown the KIAA1199 gene in both MDAMB-231 and Hs578T cells. We evaluated the efficiency of
knockdown through both RT-PCR and Western blotting
approaches in triplicate. As shown in the Additional file 3:
Figure S2, we observed an average of 86% and 92%
decrease in the level of KIAA1199 transcription in
Table 1 Microarray studies in different breast cancer types
Reporter
Cancer type
Breast samples
Tumor samples
t-Test
p-Value
Fold change
TCGAa
Invasive Breast Carcinoma
61
76
14.019
3.39E-28
9.094
TCGA
Invasive Ductal Breast Carcinoma
61
392
19.021
1.71E-36
8.233
TCGA
Invasive Lobular Breast Carcinoma
61
36
8.501
7.32-12
5.527
Gluck et al.b
Invasive Breast Carcinoma
4
154
9.603
2.48E-7
2.926
Richardson et al.c
Ductal Breast Carcinoma
7
40
6.564
1.06E-6
4.125
a
)The Cancer Genome Atlas data was obtained from the Oncomine website.
b
)See Reference [19].
c
)See Reference [20].
Several studies show the overexpression of KIAA1199 in breast carcinoma comparing to normal breast tissues.
Jami et al. BMC Cancer 2014, 14:194
/>
Page 6 of 16
Table 2 Details about each core on the TMA slide
Core
Breast cancer type
Sex
Age
Tissue area
Threshold (%)
Log2*
a1
Phyllodes Tumor
F
45
271599
0.15
−2.72
b1
Non-neoplastic
F
45
254568
0.12
−3.04
a2
Infiltrating Ductal Carcinoma
F
58
332807
1
0
b2
Non-neoplastic
F
58
191591
0
−9.32
a3
Invasive Lobular Carcinoma
F
51
326860
3.12
1.64
b3
Non-neoplastic
F
51
247173
0.64
−0.65
a4
Infiltrating Ductal Carcinoma
F
66
332029
18.21
4.19
b4
Non-neoplastic
F
66
143861
0.01
−6.68
a5
Infiltrating Ductal Carcinoma
F
54
373279
0.54
−0.88
b5
Non-neoplastic
F
54
277105
0.16
−2.65
c1
Infiltrating Ductal Carcinoma
F
55
340233
8.12
3.02
d1
Non-neoplastic
F
55
83421
0
−8.7
c2
Infiltrating Ductal Carcinoma
F
63
273915
1.44
0.53
d2
Non-neoplastic
F
63
270038
2.87
1.52
c3
Atypical Medullary Carcinoma
M
72
306756
0.02
−5.88
d3
Non-neoplastic
M
72
195427
0.07
−3.84
c4
Infiltrating Ductal Carcinoma
F
64
358767
23.08
4.53
d4
Non-neoplastic
F
64
215357
0
−11.07
c5
Atypical Medullary Carcinoma
F
49
253762
0.02
−5.45
d5
Non-neoplastic
F
49
304971
0.18
−2.51
e1
Infiltrating Ductal Carcinoma
F
38
355620
7.01
2.81
f1
Non-neoplastic
F
38
260062
0.1
−3.38
e2
Infiltrating Ductal Carcinoma
F
41
381085
0.87
−0.2
f2
Non-neoplastic
F
41
30471
0.19
−2.37
*p-value = 0.025, T-test = 2.581.
The IHC staining of 12 tumor and 12 non-neoplastic tissues cores on the TMA slide (Figure 1) was evaluated based on log2 of%Threshold. The T-test showed the
significant difference of KIAA1199 expression between non-neoplastic breast tissues and breast tumor tissues (overall 14.66 fold overexpression of KIAA1199 in
tumor tissues).
MDA-MB-231-ShA and MDA-MB-231-ShB cells, respectively. The attenuation rate in Hs578T cell line
was 63% and 90% for Hs578T-ShA and Hs578T-ShB
cells. Reduction of KIAA1199 protein expression was
86% for MDA-MB-231-ShA cells and 97% for MDAMB-231-ShB cells; similarly we observed 22% and
85% decrease in Hs578T-ShA and Hs578T-ShB cells.
These data suggest that ShB construct was more effective
in KIAA1199 knockdown in both breast cancer cell lines.
KIAA1199 knockdown inhibits in vitro cell proliferation
and migration and enhances apoptosis
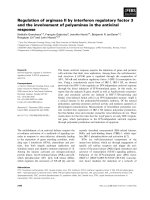
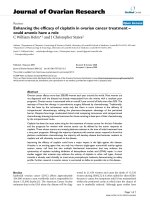
A wound-healing assay qualitatively showed that cell
motility was impaired in MDA-MB-231-ShA and MDAMB-231-ShB cells as compared to the negative control
(MDA-MB-231-ShNC) cells (Figure 2A). Similarly, the
transwell migration assay (Figure 2B) showed an average
of 44% inhibition of cell migration for MDA-MB-231ShA cells and 31% inhibition for MDA-MB-231-ShB
cells as compared to control MDA-MB-231-NC cells
(the experiment was performed in three biological replicates). These data suggest that knockdown of KIAA1199
significantly inhibits the cell motility in MDA-MB-231
cells. However, no significant change in cell motility was
observed after KIAA1199 knockdown in Hs578T cells
(data not shown).
Next, we examined whether KIAA1199 knockdown
modulated breast cancer cell proliferation. KIAA1199
knockdown in both MDA-MB-231 and Hs578T cells (the
experiment was performed in three biological replicates)
significantly inhibited the cell proliferation (Figure 2C)
as compared to the vector control transfected cells (t-test,
P < 0.05).
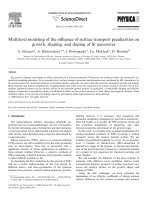
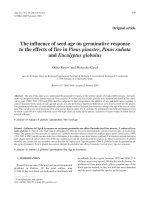
In order to study the effect of KIAA1199 knockdown on
apoptosis, we performed flow cytometric analysis using
AnnexinV+ (early apoptosis marker) and AnnexinV+/PI+
(late apoptosis) cells. We observed higher frequency of
cells programmed for both early and late phases of apoptosis in KIAA1199 knockdown cells as compared to vector
controls (Figure 3A). We observed an average of 1.72 and
Jami et al. BMC Cancer 2014, 14:194
/>
Page 7 of 16
A
1
2
4
3
5
a
b
c
e
f
B
Immunostaining Index (A.U.)
d
1e+8
1e+7
*
p<0.001
1e+6
1e+5
1e+4
1e+3
Normal Breast Carcinoma
C
Figure 1 KIAA1199 expression in breast cancer tissues. A) The TMA slide (×4) contained 12 tumor tissue cores (rows a, c and e) and 12
corresponding normal tissues (rows b, d and f) were immunostained with anti-KIAA1199 antibody. B) Evaluation of KIAA1199 expression by
calculation of immunostaining index using the Metamorph software; the box plot shows a significant difference in KIAA1199 expression between
breast carcinoma tissues and the corresponding non-neoplastic normal tissues. C) Representative magnification (×400) of KIAA1199 immunostaining
in two cores (c4 vs. d4) shows the cytosolic localization of this protein.
1.94 fold increase in early apoptosis rate in MDA-MB231-ShA and MDA-MB-231-ShB cells comparing to negative controls cells. The increase of late apoptosis rate for
these cells was 1.82 and 2.36 fold respectively. In addition,
similar results were observed in Hs578T cell line; Hs578TShA and Hs578T-ShB cells showed 2.19 and 2.26 fold
increase in the rate of early apoptosis. KIAA1199 knockdown cells also showed higher (2.61 and 1.45 fold) rate of
late apoptosis (Figure 3A).
To further confirm the effect of KIAA1199 knockdown on apoptosis, we performed Western blot analysis
of caspase-3 using the rabbit anti Caspase-3 (8G10)
Jami et al. BMC Cancer 2014, 14:194
/>
Page 8 of 16
A
B
Percent Migration
60
T-0h
T-24h
50
*p<0.01
40
*
*
30
20
10
0
MDA-MB-231-ShNC MDA-MB-231ShA
ShA
ShB
MDA-MB-231 cells
0.45
0.25
Absorbance (570 nm)
Absorbance (570 nm)
C
ShNC
MDA-MB-231-ShB
0.2
0.15
0.1
0.05
0.4
0.35
0.3
0.25
0.2
0.15
0.1
0.05
0
0
24h
48h
MDA-MB-231-ShNC
MDA-MB-231-ShB
72h
96h
MDA-MB-231-ShA
24h
48h
Hs578-ShNC
Hs578-ShB
72h
96h
Hs578-ShA
Figure 2 Knockdown of KIAA1199 inhibits cell migration and proliferation in vitro. A) The wound-healing assay shows significantly lower
cell motility in the KIAA1199 knockdown cells (MDA-MB-231-ShA and MDA-MB-231-ShB) compared to the negative controls. B) Trans-well assay
shows a decrease in the cell migration rate (migrated/total) for the KIAA1199 knockdown cells (the experiment was performed in three biological
replicates). C) The MTT assay demonstrates that both MDA-MB-231 and Hs578T knockdown cells have significantly lower proliferation levels at 72
and 96 h of culture (the experiment was performed in three biological replicates).
monoclonal antibody (Cell Signaling) which detects
both pro-caspase-3 and cleaved caspase-3. As shown in
Figure 3B, we observed an overrepresentation of cleaved
caspase-3 in KIAA1199 knockdown cells compared to
control cells.
Together these data suggest that KIAA1199 knockdown inhibited cellular migration and proliferation and
enhanced apoptosis. Since the MDA-MB-231-ShB seemed
to be more efficiently affected during the KIAA1199 we
choose to use this cell line together with MDA-MB-231ShNC for further in vivo studies and proteomic analyses.
KIAA1199 knockdown inhibits tumor incidence/growth
and cell proliferation
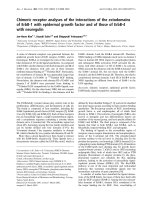
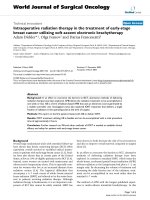
To determine whether KIAA1199 depletion modulates
tumor growth, we implanted the MDA-MB-231-ShNC
(control) and MDA-MB-231-ShB cells into the mammary fat pads of nude mice (n = 5). We observed significant reduction in tumor incidence following KIAA1199
knockdown (Figure 4A). Four of the MDA-MB-231ShNC and one of the MDA-MB-231-ShB implanted
mice developed tumors. In addition, we observed a significant inhibition in the tumor growth (Figure 4B) in
mice bearing the MDA-MB-231-ShB cells as compared
to MDA-MB-231-ShNC. We validated the levels of
KIAA1199 in tumors using immunohistochemistry. MDAMB-231-ShNC tumors showed intense KIAA1199 expression whereas MDA-MB-231-ShB tumors showed very
little or no immunostaining for KIAA1199 (Figure 5).
Moreover, the results showed the cytosolic localization
of KIAA1199 protein. Interestingly, several local metastatic foci, expressing even higher levels of KIAA1199,
appeared in the fat pads adjacent to the MDA-MB-231ShNC tumors. These data demonstrate that knockdown
of KIAA1199 inhibited MDA-MB-231 tumorigenesis
and growth in vivo.
Next we examined whether KIAA1199 knockdown
modulates in situ phenotypes associated with tumor
growth and aggressiveness using immunohistochemical
analysis of tumors derived from MDA-MB-231-ShNC
and MDA-MB-231-ShB cells. The expression level of
cleaved caspase 3 (CASP3) protein (the apoptosis initiation marker) is increased in the KIAA1199 knockdown
tumors (Figure 5). Moreover, analysis of in situ cell proliferation using anti-PCNA antibody demonstrated the
inhibition of malignant cell proliferation in the MDA-MB231-ShB tumor compared to the MDA-MB-231-ShNC
tumors (Figure 5). Together these data demonstrate that
knockdown of KIAA1199 inhibited in situ cell proliferation and enhanced apoptosis.
Jami et al. BMC Cancer 2014, 14:194
/>
Page 9 of 16
A
2.77%
5.12%
6.56%
12.09%
21.80%
22.94%
MDA-MB-231-ShNC
MDA-MB-231-ShA
2.03%
5.23%
2.93%
7.51%
15.80%
17.10%
Hs578T-ShNC
Hs578T-ShA
Hs578T-ShB
34 kDa
26 kDa
Hs578TShB
52 kDa
Hs578TShA
Hs578TShNC
MDA-MB231-ShB
MDA-MB231-ShA
MDA-MB231-ShNC
B
MDA-MB-231-ShB
α-Tubulin
52 kDa
ProCaspase-3
34 kDa
26 kDa
17 kDa
10 kDa
Cleaved
Caspase-3
17 kDa
10 kDa
Figure 3 KIAA1199 Knockdown enhanced apoptosis in vitro. A) Flow cytometry analysis shows a large increase in the percentage of cells
programmed for apoptosis in MDA-MB-231-ShA, MDA-MB-231-ShB, Hs578T-ShA and Hs578T-ShB cells comparing to the corresponding negative
controls. B) Confirmation of the results of Flow cytometry analysis by Western blot (single experiment). Caspase-3 activation is detected in Western
blots by the presence of cleavage fragments. The antibody detects both pro (full-length) and active (cleaved) protein. The increased representation of
cleaved caspase-3 in KIAA1199 knockdown cells compared to the control cells is qualitatively shown in MDA-MB-231 (left panel) and Hs578T
(right panel) cells.
Quantitative proteomic analysis of MDA-MB-231-ShNC
and MDA-MB-231-ShB cells
Expression of a variety of proteins was affected by
KIAA1199 knockdown. These expression changes were
characterized through quantitative proteomics (Figure 6).
A total of 6,543 unique peptides corresponding to 1,574
proteins were identified (FDR < 0.01) and quantified in
the mixture of proteins taken from MDA-MB-231-ShNC
(light medium) and MDA-MB-231-ShB (heavy medium)
cells (Additional file 4: Table S2) by the UNiquant
Jami et al. BMC Cancer 2014, 14:194
/>
Page 10 of 16
A
MDA-MB231-ShB
MDA-MB231-ShNC
0
20
40
60
80
100
Incidence (%)
Tumor Volume (mm3)
B
1600
1400
1200
1000
800
600
400
200
0
MDA-MB-231-ShNC
MDA-MB-231-ShB
n=4
n=1
0
10
20
30
40
50
60
Time (days)
Figure 4 KIAA1199 Knockdown inhibited tumorigenicity,
growth and neovascularization. A) The relative tumor incidence in
MDA-MB-231-ShNC and MDA-MB-231-ShB cell bearing mice; The
MDA-MB-231-ShNC (control) and MDA-MB-231-ShB cells were
implanted into the mammary fat pads of two groups of nude mice
(n = 5). Four of the MDA-MB-231-ShNC and one of the MDA-MB-231ShB implanted mice developed tumors. B) Tumor growth diagram
for MDA-MB-231-ShNC and MDA-MB-231-ShB injected mice.
software pipeline [16]. Although the SILAC based proteomic study was limited to MDA-MB-231-ShNC and
MDA-MB-231-ShB cells, the experiment was performed
in two independent biological replicates to increase confidence. Total numbers of 1217 and 1404 proteins were
identified in replicate 1 and 2 respectively. Among them,
91 proteins were differentially expressed in both replicate
experiments (p < 0.05). Using the Kyoto Encyclopedia of
Genes and Genomes (KEGG) and the Uniprot Database,
the differentially expressed proteins were classified into
eight major categories based on their biological roles and
their Gene Ontology (GO) (see Figure 6A). Figure 6B
shows the results for representative peptides associated
with three of the differentially expressed proteins. Our
SILAC-based LC-MS/MS study showed the average upregulation to 1.85 fold for protein S100A11, downregulation to 0.10 fold for WASL and 0.25 fold for
PPP1R9B. In order to validate the protein level alteration
we performed the semi-quantitative RT-PCR as a standard
method to evaluate the transcription level of these proteins [13]. We observed the average of 1.75 and 2.1 fold
over-expression of S100A11 in mRNA level in MDA-MB-
231-ShA and MDA-MB-231-ShB respectively. Also the
transcription level of WASL/PPP1R9B was decreased to
0.14/0.38 and 0.46/0.43 fold in MDA-MB-231-ShA and
MDA-MB-231-ShB respectively. These findings showed
the accuracy of normalization method used by the
UNiquant software pipeline and validated the mass
spectral observations (Figure 6C and D). Further data
describing the protein changes are detailed in Additional
file 4: Table S2 and summarized in Table 3. As shown
in Figure 6A, the functions of proteins differentially
expressed between MDA-MB-231-ShNC and MDAMB-231-ShB cells can be assigned to eight categories
including Apoptosis, DNA repair and cell cycle, Gene
expression and regulation, Cytoskeleton, cell adhesion
and motility, Ubiquitin proteasome pathway, Metabolism, Oxidative stress and other proteins. This data suggest that KIAA1199 may affect a broad range of cellular
functions.
Discussion
In order to identify new biomarkers for the improvement of new diagnosis strategies and targeted therapy, it
is essential to better understand breast cancer biology
and the molecular profiles that will respond to targeted
treatment. Molecular markers such as progesterone receptor, estrogen receptor, and ErbB2 have been associated
with the five major subtypes of breast cancer: luminal A,
luminal B, ErbB2+/ER-, basal-like, and normal breast-like
[18]. However, molecular pathways involved in incidence,
progression and clinical outcomes remain elusive.
Several microarray based expression studies have previously shown the overexpression of KIAA1199 in breast
cancer (Table 1). The results of a recent study from The
Cancer Genome Atlas (TCGA) on 593 samples shows
9.094 fold (p = 3.39E-28) overexpression in invasive breast
carcinoma, 8.233 fold (p = 1.71E-36) in invasive ductal
breast carcinoma and 5.527 fold (p = 7.32E-12) in invasive
lobular breast carcinoma compared to corresponding normal breast tissues. Another comparison between invasive
breast carcinoma and normal tissue in 158 samples by
Gluck and co-workers showed a 2.926 fold (p = 2.48E-7)
overexpression of KIAA1199 in invasive breast carcinoma
[19]. Furthermore, Richardson and co-workers have reported a 4.125 (p = 1.06E-6) fold overexpression of
KIAA1199 in ductal breast carcinoma [20]. In addition
to these data, our immunohistochemical study on clinical
breast cancer specimens showed 14.66 fold (p = 0.025)
overexpression of this protein.
Based on these findings, we examined the role of
KIAA1199 in the MDA-MB-231 and Hs578T breast
cancer cell lines using two sets of shRNA-mediated
knockdown cells for each cell line. We observed that
knockdown of KIAA1199 enhanced apoptosis and inhibited cell proliferation and survival in both cell lines
Jami et al. BMC Cancer 2014, 14:194
/>
A
MDA-MB-231
-ShNC (2)
MDA-MB-231
-ShNC (3)
MDA-MB-231
-ShNC (4)
MDA-MB-231
-ShB
H&E
PCNA
CASP-3
KIAA1199
KIAA1199
MDA-MB-231
-ShNC (1)
Page 11 of 16
Relative expression (%)
B
Figure 5 Immunohistochemical studies. A) Very low KIAA1199 immunostaining (first row) in MDA-MB-231-ShB tumor comparing to the
controls (×4). Representative illustration of immunohistochemical studies (×100 magnifications) shows the higher expression level of KIAA1199
(brown staining cells in the second row), lower apoptosis activity (CASP3, third row) and higher proliferation activity (PCNA, fourth row) than the
MDA-MB-231-ShB tumor. B) Evaluation of the expression of protein markers by calculation of immunostaining index using the Metamorph software;
graphs from left to right show the relative expression of KIAA1199, CASP3 and PCNA in control versus KIAA1199 knockdown tumor sections.
in vitro. Additionally, using immunohistochemical staining
against cleaved caspase-3 (CASP3) and PCNA we respectively confirmed the apoptosis enhancement and inhibition
of cell proliferation in vivo.
Interestingly, our proteomic study showed that while
the negative control cells expressed higher levels of the
apoptosis inhibitors, several proteins involved in apoptosis were overrepresented in the knockdown cells justifying the higher apoptotic activity we observed in vitro
and in vivo. For instance the apoptosis regulator BAX
which promotes programmed cell death after binding to,
and antagonizing the apoptosis repressor BCL2 is upregulated. BAX also accelerates the activation of CASP3,
and thereby promotes apoptosis [21-24]. In addition, we
observed the up-regulation of FADD (FAS-Associated
Death Domain protein) which is another apoptotic
adaptor molecule. FADD bridges the death receptors
(e.g. Fas-receptor) to the death-inducing signaling complex (DISC) and activates caspase-8. Active caspase-8
initiates a cascade of caspases which mediate apoptosis
[25]. Another example is a large increase in the expression
of DIO-1 (death inducer-obliterator-1) that translocates to
Jami et al. BMC Cancer 2014, 14:194
/>
Page 12 of 16
Figure 6 Representative data from the proteomics study on MDA-MB-231 cells after knockdown of KIAA1199. A) Differentially expressed
proteins were classified based on their Gene Ontology (GO) and function. B) MS and MS2 spectra from one up-regulated protein (S100A11) and
two down-regulated proteins (WASL and PPP1R9B). The left-hand panels show MS spectra, where the red *symbols show intensities of the
monoisotopic peak for the light and heavy SILAC labeled peptides. The right-hand panels show the MS2 spectra corresponding to the peptide
with the most intense signal of the pair. C) Validation of differential expression of S100A11, WASL and PPP1R9B genes using semi-quantitative
RT-PCR analysis in triplicate. D) The relative expression of the bands is shown as bars (*p < 0.01). Intensities were normalized to GAPDH band. The
average intensity values of the transcripts obtained from the MDA-MB-231-ShNC cells were set to 100%.
the nucleus and activates apoptosis in cell culture [26].
KIAA1199 knockdown also led to up-regulation of Akinase anchor protein 8 (AKAP95) that is a potential
carrier protein for active caspase 3, carrying it from the
cytoplasm into the nuclei in apoptotic cells and is involved in the process of apoptotic nuclear morphological
change [27].
It is noteworthy that we found progesterone (P4) receptor membrane component-1 (PGRMC1) down-regulated
upon KIAA1199 knockdown. This protein promotes
cell survival in human cancer after chemotherapy [28].
PGRMC1 was reported to be over-expressed in breast
tumors and other cancer cell lines [29].
It is known that high expression of BAX is associated
with improved chemotherapy responsiveness [30] whereas
PGRMC1 has a negative impact on chemotherapy by
promoting the survival of treated cancer cells [28]. This
knowledge plus the fact that KIAA1199 knockdown alters the expression level of these proteins, suggests that
KIAA1199 depletion may potentially improve cellular
response to chemotherapy.
Our wound healing and transwell cell motility assays
showed lower motility in the MDA-MB-231-ShB cells.
These findings can be explained by the observation of
altered levels of proteins involved in cellular shape change,
filopodia extension, nuclear migration and adhesion inhibition in the knockdown cells. We observed the upregulation of S100A11 protein which functions in tubulin
polymerization, motility, and tumor invasion [31] and
down-regulation of the transforming acidic coiled-coilcontaining protein 3 (TACC3). The latter plays a role in
the microtubule-dependent coupling of the nucleus and
the centrosome, and it has been demonstrated to be overexpressed in various cancer cell lines [32]. Furthermore,
Jami et al. BMC Cancer 2014, 14:194
/>
Page 13 of 16
Table 3 Functional categories of proteins differentially expressed in MDA-MB-231-ShB cells compared to MDA-MB-231ShNC cells
Functional categories
Protein names
Apoptosis [n = 7, 8%]
BAX (1.50, 4.53E-02), FADD (1.63, 2.17E-02), DIO-1 (25.39, 5.91E-55), AKAP95 (2.19,
4.12E-06), PGRMC1 (0.62, 0.01), GNAS (0.53, 3.30E-4), TFG (0.59, 6.19E-03)
DNA repair and cell cycle [n = 8, 9%]
SMC1A (1.62, 4.66E-02), ANAPC10 (0.11, 4.30E-44), PPP1CB (0.64, 3.35E-2), PPP2R1A (0.46,
4.1E-06), CRABP2 (4.24, 5.69E-20), C10orf78 (2.21, 3.14E-06), NXN (0.60, 0.01), TK1 (0.61, 8.50E-03)
Gene regulation, RNA expression, mRNA splicing, and
protein synthesis and transport [n = 30, 33%]
RBBP4 (1.68, 2.18E-02), WDR5 (8.98, 2.37E-24), ZNF259 (1.52, 4.84E-02), SFRS5 (1.60,
2.16E-02), STAU1 (1.63, 1.30E-02), RPL37A (1.53, 0.04), EIF2S2 (1.57, 0.03), TMED2 (1.56,
2.98E-02), KIAA0521 (1.77, 2.00E-03), SRP14 (2.28, 3.14E-05), HNRPA1L-2 (7.61, 7.77E-38),
SRP72 (0.26, 2.07E-17), RGPD5 (0.36, 5.44E-10), PQBP1 (0.44, 2.57E-06), TERF2IP (0.47,
8.95E-06), SEC23B (0.49, 4.08E-05), SUPT5H (0.51, 1.78E-04), FUBP1 (0.52, 2.79E-04),
PPP1R14B (0.52, 2.79E04), CPSF3 (0.57, 2.75E-03), HMGA1 (0.58, 5.70E-03), RPS15 (0.60,
6.49E-03), KIAA1150 (0.60, 2.75E-03), ELAC2 (0.61, 9.85E-03), FARSA (0.62, 0.01), SNRNP70
(0.63, 0.02), BASP1 (0.64, 0.03), KIAA0324 (0.65, 0.04), PRPF4 (0.65, 0.48), MAGED2 (0.65, 0.02)
Metabolism [n = 11, 12%]
ATP5C1 (1.62, 0.02), PGLS (0.59, 4.34E-03), PGAM4 (0.38, 6.95E-10), ACAA1 (0.03,
6.80E-104), ACOT2 (0.37, 8.07E-10), USMG5 (1.55, 3.69E-02), GCDH (1.69, 5.90E-03), ALDH9A1
(6,60, 5.67E-33), RRM2 (0.47, 1.18E-06), AK1 (0.49, 1.44E-10), VAT1 (0.57, 3.66E-03)
Cytoskeleton, cell adhesion and cell motility [n = 14, 15%]
S100A11 (1.82, 1.13E-03), TACC3 (0.58, 4.54E-03), WASL (0.10, 3.76E-48), PPP1R9B (0.25,
1.40E-18), TNXB (0.09, 2.43E-52), SEPT9 (0.57, 1.76E-03), NCKIPSD (1.54, 3.95E-02), ACTR3
(11.59, 1.39E-51), LUM (0.07, 7.40E-59), KIAA0345 (0.23, 6.31E20), THBS1 (0.41, 5.28E-09),
ARHGEF2 (0.43, 8.89E-07), ZYX (0.43, 1E-06), SDCBP (0.53, 5.15E-04)
Ubiquitin proteasome pathway [n = 6, 7%]
UBE2V1 (0.63, 2.59E-02), ZFP91 (0.53, 3.87E-04), UBE2C (0.49, 3.04E-05), UBE2L3 (0.55,
3.88E-04), UBE2K (0.56, 1.61E-03), KIAA0439 (0.65, 0.03)
Oxidative Stress [n = 1, 1%]
DJ-1 (2.01, 7.10E-04)
Others [n = 14, 15%]
ACP1 (1.52, 4.72E-02), CYR61 (1.56, 3.49E-02), HBA1 (0.02, 7.30E-102), LTF (0.02, 3.80E-102),
HBE1 (0.11, 2.89E-42), ALB (0.13, 2.21E-38), CHCHD2 (0.37, 3.94E-10), C19orf43 (0.39,
6,69E-09), CCDC86 (0.40, 4.27E-08), COX17 (0.45, 5.23E-06), C1orf122 (0.46, 6.59E-06),
ZC3H18 (0.46, 8.95E-06), TXLNA (0.49, 9.02E-06), C11orf84 (0.52, 3.18E-05)
A total number of 91 differentially expressed proteins were classified by their characteristics and broad functional criteria. The number and the approximate
percentage of proteins in each category are shown in brackets. Fold change greater than 1 means that proteins were up-regulated in MDA-MB-231-ShB cells and
vice versa.
TACC3 depletion has been reported to strongly sensitize
cells to chemotherapy [33], therefore KIAA1199 depletion
can also potentially affect the cellular response to chemotherapy via TACC3.
Neural Wiskott-Aldrich syndrome protein (WASL) is
dramatically down-regulated (0.10 fold) in the KIAA1199
knockdown cells. WASL activates the Arp2/3 complex
required for the extension of lamellipodia and filopodia
during cell movement [34]. Another down-regulated
protein is Neurabin-2 (PPP1R9B) which binds along the
sides of F-actin and plays a role in linking the actin
cytoskeleton to the plasma membrane at the synaptic
junction. PPP1R9B therefore might be involved in cell
shape change and migration [35]. A member of the tenascin protein family, the glycoprotein tenascin X (TNXB) is
also dramatically down-regulated in the KIAA1199 knockdown cells. As opposed to fibronectin which is adhesive,
the tenascins have anti-adhesive effects. TNXB mediates
interactions between cells and the extracellular matrix and
may support the growth of epithelial tumors [36]. Overall,
these findings suggest that KIAA1199 may be involved in
determination of cellular morphology and motility.
However, unlike in MDA-MB-231-ShB cells the cell
motility was not affected in Hs578Tcell after KIAA1199
knockdown. Although both of these cell lines belong to
basal type B breast cancer, MDA-MB-231 cells was originated from invasive ductal carcinomas (IDC) whilst
Hs578TT cells originated from a breast carcinosarcoma,
and they highly differ in migration and invasion capability
[37]. These data suggest discrete cell migratory mechanisms in these cell lines in which KIAA1199 may or may
not participate.
In this work we studied the effects of KIAA1199
knockdown for the first time in vivo. We demonstrated
the inhibition in tumor incidence and growth rate. Our
findings are in concordance with the results of the proteomic study where we observed modulation of several proteins involved in cell cycle progression and division such
as ANAPC10 (Anaphase-promoting complex subunit 10),
PPP1CB (Serine/threonine-protein phosphatase PP1beta protein catalytic subunit) and PPP2R1A (Serine/
threonine-protein phosphatase 2A regulatory subunit)
upon KIAA1199 knockdown. All of these proteins play
role in cell cycle regulation and cell division. For example
ANAPC10 participates in the progression through mitosis
and the G1 phase of the cell cycle [38]. PPP1CB is a component of the PTW/PP1 phosphatase complex, which
plays a role in the control of chromatin structure and cell
cycle progression during the transition from mitosis into
interphase [39] and PPP2R1A is required for proper
Jami et al. BMC Cancer 2014, 14:194
/>
chromosome segregation and for centromeric localization
in mitosis [40]. These data suggest an important role
for KIAA1199 in breast cancer incidence, growth and
progression.
Mass spectrometry based proteomics holds special
promise to provide better insights into biological pathways. In this study, we pursued the functional analysis of
KIAA1199 in breast cancer cells as a novel target screened
in our previous proteomic study [3]. Although the detailed
mechanism of KIAA1199-mediated cellular responses
is still obscure, our proteomic study shed light on how
different biological pathways may be influenced by
KIAA1199 directly or indirectly. For instance alteration of
components of MAPK, NF-k-B and apoptosis pathways
can potentially affect other cellular phenomena such as
angiogenesis.
Furthermore, our findings suggest that KIAA1199
knockdown may also affect the cellular metabolism. It is
known that tumor cells typically have much higher rates
of glycolysis compared to their normal tissues of origin;
consequently they secrete glucose-derived carbon mostly
as lactate instead of completely oxidizing glucose. This
phenomenon is known as the Warburg effect [41,42]. In
this study we observed the modulation of several metabolism associated enzymes. The KIAA1199 knockdown
cells have lower expression of proteins involved in glycolysis and cytosolic break down of glucose (such as PGAM4)
and instead tend to the mitochondrial oxidation. Therefore, the Warburg effect which is a fundamental character
of cancer cells also seems to be negatively influenced by
KIAA1199 depletion.
We utilized various approaches and techniques to
comprehensively evaluate the major consequences of
KIAA1199 depletion in breast cancer cells in vitro and
in vivo. Despite the limitations in study sizes (the number of TMA tissues, animals, cell lines etc.) we studied
several aspects of cancer development and progression
following KIAA1199 knockdown. Further studies on
each aspect with larger sample sizes will help to uncover
the mechanism of KIAA1199 function and provide
more evidences. Taken together, our findings presented
here suggest that KIAA1199 may represent a novel target
for biomarker development and a novel therapeutic target
to control breast cancer progression and metastasis.
Conclusions
Our TMA/IHC study confirmed the results of bioinformatics studies from a large database of microarray analyses which show the overexpression of KIAA1199 in
breast carcinoma. We showed in vitro the inhibition of cell
proliferation and migration as well as apoptosis enhancement in MDA-MB-231 cells upon KIAA1199 knockdown.
Silencing of KIAA1199 resulted in decreased tumor incidence and tumor growth rate in vivo. Our proteomic
Page 14 of 16
analysis provided insight into the pathways through which
KIAA1199 may affect a broad range of cellular functions
including apoptosis, metabolism and cell motility.
Additional files
Additional file 1: Table S1. The sequence of the primers used in this
study for the semi-quantitative RT-PCR analysis.
Additional file 2: Figure S1. A) The Olfactory Bulb tissue was used as
negative control tissue for KIAA1199 staining. B) The human kidney tissue
was used as both positive (cells in tubules) and negative (cells in
glomeruli) control tissues for immunohistochemical staining (according
to the human protein atlas at KIAA1199 has
the highest expression level in renal tubules). C) Technical negative
control staining (without primary antibody) for the human kidney tissue.
D) Higher magnification of stained kidney tissue (×200 magnifications)
shows the cytosolic localization of KIAA1199 in positive cells (renal tubules).
Additional file 3: Figure S2. Knockdown of KIAA1199 in MDA-MB-231
cells. A) The empty pGPH1/GFP/NEO shRNA expression vector used to
generate MDA-MB-231-ShNC and Hs578T-ShNC cells. B) The sequence of
two different KIAA1199 specific inserts which were used to generate the
MDA-MB-231-ShA, MDA-MB-231-ShB, Hs578T-ShA and Hs578T-ShB cell
lines. C) Top: RT-PCR analysis shows a dramatic decrease of KIAA1199
mRNA expression in the knockdown cells; the transcript of (glyceraldehyde
3-phosphate dehydrogenase) GAPDH was used as control. Bottom: The
bands obtained after the electrophoresis were quantified by densitometry,
and their intensity was normalized to that provided by the GAPDH band
(relative integral optical density (IOD)). The average of normalized intensity
values (triplicate) obtained from the negative controls was set to 100%. D)
Top: Western blotting shows a dramatic decrease in KIAA1199 protein in
knockdown cells. Bottom: The bands obtained from triplicate experiments
were quantified by densitometry, and their intensity was normalized to
corresponding replicate of α-Tubulin band (relative integral optical density
(IOD)). The average of normalized intensity values (triplicate) obtained from
the negative controls was set to 100%.
Additional file 4: Table S2. Detailed information about the proteins
identified in the SILAC peptide mixture of MDA-MB-231-ShNC cells (L)
and MDA-MB-231-ShB cells (H).
Abbreviations
IHC: Immunohistochemistry; TMA: Tissue microarray; LC-MS/MS: Liquid
chromatography tandem mass spectrometry; SCX: Strong cation exchange;
SILAC: Stable isotope labeling by amino acids in cell culture.
Competing interests
The authors declare that they have no competing interests.
Authors’ contributions
SJD designed the research; MSJ, JH, YL, LG, JD and JW carried out the vector
construction and stable cell line generation. MSJ, JH, and HP carried out the
Western blotting. MSJ carried out the RT-PCR. MSJ, JH and MLV carried out
the cell cycle, apoptosis, motility, migration, and proliferation assays. MSJ,
MLV and HH carried out the tumor growth, IHC, and TMA/IHC. MSJ, JH, ML
and XH carried out the SILAC based quantitative proteomic study. MSJ, XH,
KF, and FY carried out the data analysis; XH and FY carried out the statistical
analysis. MSJ carried out the interpretation of proteomic results. SJD and RKS.
led the research; MSJ, and SJD wrote the paper. All of the authors have been
involved in revising the manuscript and have given final approval of the
version to be published.
Acknowledgements
This work was financially support in part by the Department of Pathology
and Microbiology at UNMC and NEHHS LB606 (S.J.D), Susan G. Komen for
the Cure grant KG090860, COBRE grant RR021937 (Nebraska Center for
Nanomedicine), and Cancer Center Support Grant (P30CA036727) from
National Cancer Institute, National Institutes of Health. H. H. is a recipient of
Study Abroad Scholarship for PhD study in Molecular Pathology from
Egyptian Ministry of High Education and Widaman Fellowship from
Jami et al. BMC Cancer 2014, 14:194
/>
University of Nebraska Medical Center. H.P. and X.H were supported by a
scholarship from Chinese Scholarship Council. M.L. was supported by a
scholarship from UNMC predoctoral fellowship. The IHC experiments were
supported by NIH grant 1 P20 RR 018788.
We thank Dr. Lawrence Schopfer for the editing of this manuscript. The mass
spectrometry data were collected in the Mass Spectrometry and Proteomics
Core Facility at the University of Nebraska Medical Center (UNMC). We also
thank Drs. Jixin Dong and Vimla Band for providing us MDA-MB-231 cells
and HS578T cells, respectively. We thank Annita Jennings and Daivd W. Wert
from the UNMC Tissue Science Facility for assistance with the IHC
experiments.
Author details
1
Department of Pathology and Microbiology, University of Nebraska Medical
Center, Omaha, NE 68198, USA. 2Department of Oncology, Zhongnan
Hospital of Wuhan University, Wuhan 430071, China. 3Eppley Cancer Institute,
University of Nebraska Medical Center, Omaha, NE 68198, USA. 4Department
of Biostatistics, University of Nebraska Medical Center, Omaha, NE 68198,
USA. 5Biomarker Discovery and Development Laboratory, Sanford-Burnham
Medical Research Institute at Lake Nona, Orlando, FL 32827, USA.
Received: 29 August 2013 Accepted: 3 March 2014
Published: 15 March 2014
References
1. Jemal A, Siegel R, Xu J, Ward E: Cancer statistics. CA Cancer J Clin 2010,
60(5):277–300.
2. Karnoub AE, Weinberg RA: Chemokine networks and breast cancer
metastasis. Breast Dis 2006, 26:75–85.
3. Wang Y, Ding SJ, Wang W, Jacobs JM, Qian WJ, Moore RJ, Yang F, Camp DG
II, Smith RD, Klemke RL: Profiling signaling polarity in chemotactic cells.
Proc Natl Acad Sci USA 2007, 104:8328–8333.
4. Neve RM, Chin K, Fridlyand J, Yeh J, Baehner FL, Fevr T, Clark L, Bayani N,
Coppe JP, Tong F, Speed T, Spellman PT, DeVries S, Lapuk A, Wang NJ, Kuo
WL, Stilwell JL, Pinkel D, Albertson DG, Waldman FM, McCormick F, Dickson
RB, Johnson MD, Lippman M, Ethier S, Gazdar A, Gray JW: A collection of
breast cancer cell lines for the study of functionally distinct cancer
subtypes. Cancer Cell 2006, 10:515–527.
5. Abe S, Usami S, Nakamura Y: Mutations in the gene encoding KIAA1199
protein, an inner-ear protein expressed in Deiters’ cells and the fibrocytes,
as the cause of nonsyndromic hearing loss. J Hum Genet 2003, 48:564–570.
6. Paunu N, Lahermo P, Onkamo P, Ollikainen V, Rantala I, Helen P, Simola KO,
Kere J, Haapasalo H: A novel low-penetrance locus for familial glioma at
15q23-q26.3. Cancer Res 2002, 62:3798–3802.
7. Kao J, Salari K, Bocanegra M, Choi YL, Girard L, Gandhi J, Kwei KA,
Hernandez-Boussard T, Wang P, Gazdar AF, Minna JD, Pollack JR: Molecular
profiling of breast cancer cell lines defines relevant tumor models and
provides a resource for cancer gene discovery. PLoS One 2009, 4:e6146.
8. Matsuzaki S, Tanaka F, Mimori K, Tahara K, Inoue H, Mori M:
Clinicopathologic significance of KIAA1199 overexpression in human
gastric cancer. Ann Surg Oncol 2009, 16:2042–2051.
9. Birkenkamp-Demtroder K, Maghnouj A, Mansilla F, Thorsen K, Andersen CL,
Oster B, Hahn S, Orntoft TF: Repression of KIAA1199 attenuates
Wnt-signalling and decreases the proliferation of colon cancer cells.
Br J Cancer 2011, 105:552–561.
10. Michishita E, Garces G, Barrett JC, Horikawa I: Upregulation of the
KIAA1199 gene is associated with cellular mortality. Cancer Lett 2006,
239:71–77.
11. Kostic C, Shaw PH: Isolation and characterization of sixteen novel p53
response genes. Oncogene 2000, 19:3978–3987.
12. Ding SJ, Li Y, Tan YX, Jiang MR, Tian B, Liu YK, Shao XX, Ye SL, Wu JR, Zeng
R, Wang HY, Tang ZY, Xia QC: From proteomic analysis to clinical
significance: overexpression of cytokeratin 19 correlates with
hepatocellular carcinoma metastasis. Mol Cell Proteomics 2004, 3:73–81.
13. Jami M-S, Barreiro C, García-Estrada C, Martín J-F: Proteome analysis of the
penicillin producer Penicillium chrysogenum: characterization of protein
changes during the industrial strain improvement. Mol Cell Proteomics
MCP 2010, 9:1182–1198.
14. Hou J, Dong J, Sun L, Geng L, Wang J, Zheng J, Li Y, Bridge J, Hinrichs SH,
Ding SJ: Inhibition of phosphorylated c-Met in rhabdomyosarcoma cell
lines by a small molecule inhibitor SU11274. J Transl Med 2011, 9:64.
Page 15 of 16
15. Varney ML, Johansson SL, Singh RK: Distinct expression of CXCL8 and its
receptors CXCR1 and CXCR2 and their association with vessel density and
aggressiveness in malignant melanoma. Am J Clin Pathol 2006, 125:209–216.
16. Huang X, Tolmachev AV, Shen Y, Liu M, Huang L, Zhang Z, Anderson GA,
Smith RD, Chan WC, Hinrichs SH, Fu K, Ding SJ: UNiquant, a program for
quantitative proteomics analysis using stable isotope labeling.
J Proteome Res 2011, 10:1228–1237.
17. Benjamini Y, Hochberg Y: Controlling the false discovery rate: a practical
and powerful approach to multiple testing. J R Stat Soc 1995, 57:289–300.
18. Parker JS, Mullins M, Cheang MC, Leung S, Voduc D, Vickery T, Davies S,
Fauron C, He X, Hu Z, Quackenbush JF, Stijleman IJ, Palazzo J, Marron JS,
Nobel AB, Mardis E, Nielsen TO, Ellis MJ, Perou CM, Bernard PS: Supervised
risk predictor of breast cancer based on intrinsic subtypes. J Clin Oncol
2009, 27:1160–1167.
19. Gluck S, Ross JS, Royce M, Jr ME F, Perou CM, Avisar E, Wu L: TP53
genomics predict higher clinical and pathologic tumor response in
operable early-stage breast cancer treated with docetaxel-capecitabine
+/− trastuzumab. Breast Cancer Res Treat 2011, 132(3):781–791. 2011/03/05.
20. Richardson AL, Wang ZC, De Nicolo A, Lu X, Brown M, Miron A, Liao X,
Iglehart JD, Livingston DM, Ganesan S: X chromosomal abnormalities in
basal-like human breast cancer. Cancer Cell 2006, 9:121–132.
21. Elmore S: Apoptosis: a review of programmed cell death. Toxicol Pathol
2007, 35:495–516.
22. Oltvai ZN, Milliman CL, Korsmeyer SJ: Bcl-2 heterodimerizes in vivo with a
conserved homolog, Bax, that accelerates programmed cell death.
Cell 1993, 74:609–619.
23. Schmitt E, Paquet C, Beauchemin M, Dever-Bertrand J, Bertrand R:
Characterization of Bax-sigma, a cell death-inducing isoform of Bax.
Biochem Biophys Res Commun 2000, 270:868–879.
24. Chittenden T, Flemington C, Houghton AB, Ebb RG, Gallo GJ, Elangovan B,
Chinnadurai G, Lutz RJ: A conserved domain in Bak, distinct from BH1
and BH2, mediates cell death and protein binding functions. Embo J
1995, 14:5589–5596.
25. Chinnaiyan AM, O’Rourke K, Tewari M, Dixit VM: FADD, a novel death
domain-containing protein, interacts with the death domain of Fas and
initiates apoptosis. Cell 1995, 81:505–512.
26. Garcia-Domingo D, Leonardo E, Grandien A, Martinez P, Albar JP, IzpisuaBelmonte JC, Martinez AC: DIO-1 is a gene involved in onset of apoptosis
in vitro, whose misexpression disrupts limb development. Proc Natl Acad
Sci USA 1999, 96:7992–7997.
27. Kamada S, Kikkawa U, Tsujimoto Y, Hunter T: A-kinase-anchoring protein
95 functions as a potential carrier for the nuclear translocation of active
caspase 3 through an enzyme-substrate-like association. Mol Cell Biol
2005, 25:9469–9477.
28. Peluso JJ, Romak J, Liu X: Progesterone receptor membrane component-1
(PGRMC1) is the mediator of progesterone’s antiapoptotic action in
spontaneously immortalized granulosa cells as revealed by PGRMC1
small interfering ribonucleic acid treatment and functional analysis of
PGRMC1 m. Endocrinology 2008, 149:534–543.
29. Crudden G, Loesel R, Craven RJ: Overexpression of the cytochrome p450
activator hpr6 (heme-1 domain protein/human progesterone receptor)
in tumors. Tumour Biol 2005, 26:142–146.
30. Tai YT, Lee S, Niloff E, Weisman C, Strobel T, Cannistra SA: BAX protein
expression and clinical outcome in epithelial ovarian cancer. J Clin Oncol
1998, 16:2583–2590.
31. He H, Li J, Weng S, Li M, Yu Y: S100A11: diverse function and pathology
corresponding to different target proteins. Cell Biochem Biophys 2009,
55:117–126.
32. Still IH, Vince P, Cowell JK: The third member of the transforming acidic
coiled coil-containing gene family, TACC3, maps in 4p16, close to
translocation breakpoints in multiple myeloma, and is upregulated in
various cancer cell lines. Genomics 1999, 58:165–170.
33. Schneider L, Essmann F, Kletke A, Rio P, Hanenberg H, Schulze-Osthoff K,
Nurnberg B, Piekorz RP: TACC3 depletion sensitizes to paclitaxel-induced
cell death and overrides p21WAF-mediated cell cycle arrest. Oncogene
2008, 27:116–125.
34. Takenawa T, Suetsugu S: The WASP-WAVE protein network: connecting
the membrane to the cytoskeleton. Nat Rev Mol Cell Biol 2007, 8:37–48.
35. Sagara M, Kawasaki Y, Iemura SI, Natsume T, Takai Y, Akiyama T: Asef2 and
Neurabin2 cooperatively regulate actin cytoskeletal organization and are
involved in HGF-induced cell migration. Oncogene 2009, 28:1357–1365.
Jami et al. BMC Cancer 2014, 14:194
/>
Page 16 of 16
36. Egging D, van den Berkmortel F, Taylor G, Bristow J, Schalkwijk J:
Interactions of human tenascin-X domains with dermal extracellular
matrix molecules. Arch Dermatol Res 2007, 298:389–396.
37. Hughes L, Malone C, Chumsri S, Burger AM, McDonnell S: Characterisation
of breast cancer cell lines and establishment of a novel isogenic
subclone to study migration, invasion and tumourigenicity. Clin Exp
Metastasis 2008, 25:549–557.
38. Jin L, Williamson A, Banerjee S, Philipp I, Rape M: Mechanism of ubiquitinchain formation by the human anaphase-promoting complex. Cell 2008,
133:653–665.
39. Lee JH, You J, Dobrota E, Skalnik DG: Identification and characterization of
a novel human PP1 phosphatase complex. J Biol Chem 2010,
285:24466–24476.
40. Tang Z, Shu H, Qi W, Mahmood NA, Mumby MC, Yu H: PP2A is required
for centromeric localization of Sgo1 and proper chromosome
segregation. Dev Cell 2006, 10:575–585.
41. Warburg O: On the origin of cancer cells. Science (80-) 1956, 123:309–314.
42. DeBerardinis RJ, Lum JJ, Hatzivassiliou G, Thompson CB: The biology of
cancer: metabolic reprogramming fuels cell growth and proliferation.
Cell Metab 2008, 7:11–20.
doi:10.1186/1471-2407-14-194
Cite this article as: Jami et al.: Functional proteomic analysis reveals the
involvement of KIAA1199 in breast cancer growth, motility and
invasiveness. BMC Cancer 2014 14:194.
Submit your next manuscript to BioMed Central
and take full advantage of:
• Convenient online submission
• Thorough peer review
• No space constraints or color figure charges
• Immediate publication on acceptance
• Inclusion in PubMed, CAS, Scopus and Google Scholar
• Research which is freely available for redistribution
Submit your manuscript at
www.biomedcentral.com/submit