Overexpression of miR-9 in mast cells is associated with invasive behavior and spontaneous metastasis
Bạn đang xem bản rút gọn của tài liệu. Xem và tải ngay bản đầy đủ của tài liệu tại đây (1.07 MB, 16 trang )
Fenger et al. BMC Cancer 2014, 14:84
/>
RESEARCH ARTICLE
Open Access
Overexpression of miR-9 in mast cells is associated
with invasive behavior and spontaneous
metastasis
Joelle M Fenger1, Misty D Bear2, Stefano Volinia3, Tzu-Yin Lin4, Bonnie K Harrington2, Cheryl A London1,2
and William C Kisseberth1*
Abstract
Background: While microRNA (miRNA) expression is known to be altered in a variety of human malignancies
contributing to cancer development and progression, the potential role of miRNA dysregulation in malignant mast
cell disease has not been previously explored. The purpose of this study was to investigate the potential contribution
of miRNA dysregulation to the biology of canine mast cell tumors (MCTs), a well-established spontaneous model of
malignant mast cell disease.
Methods: We evaluated the miRNA expression profiles from biologically low-grade and biologically high-grade
primary canine MCTs using real-time PCR-based TaqMan Low Density miRNA Arrays and performed real-time PCR to
evaluate miR-9 expression in primary canine MCTs, malignant mast cell lines, and normal bone marrow-derived mast
cells (BMMCs). Mouse mast cell lines and BMMCs were transduced with empty or pre-miR-9 expressing lentiviral
constructs and cell proliferation, caspase 3/7 activity, and invasion were assessed. Transcriptional profiling of cells
overexpressing miR-9 was performed using Affymetrix GeneChip Mouse Gene 2.0 ST arrays and real-time PCR
was performed to validate changes in mRNA expression.
Results: Our data demonstrate that unique miRNA expression profiles correlate with the biological behavior of primary
canine MCTs and that miR-9 expression is increased in biologically high grade canine MCTs and malignant cell lines
compared to biologically low grade tumors and normal canine BMMCs. In transformed mouse malignant mast cell
lines expressing either wild-type (C57) or activating (P815) KIT mutations and mouse BMMCs, miR-9 overexpression
significantly enhanced invasion but had no effect on cell proliferation or apoptosis. Transcriptional profiling of
normal mouse BMMCs and P815 cells possessing enforced miR-9 expression demonstrated dysregulation of several
genes, including upregulation of CMA1, a protease involved in activation of matrix metalloproteases and extracellular
matrix remodeling.
Conclusions: Our findings demonstrate that unique miRNA expression profiles correlate with the biological behavior
of canine MCTs. Furthermore, dysregulation of miR-9 is associated with MCT metastasis potentially through the induction
of an invasive phenotype, identifying a potentially novel pathway for therapeutic intervention.
Keywords: Mast cell, microRNA, miR-9
* Correspondence:
1
Department of Veterinary Clinical Sciences, Columbus, USA
Full list of author information is available at the end of the article
© 2014 Fenger et al.; licensee BioMed Central Ltd. This is an Open Access article distributed under the terms of the Creative
Commons Attribution License ( which permits unrestricted use, distribution, and
reproduction in any medium, provided the original work is properly cited. The Creative Commons Public Domain Dedication
waiver ( applies to the data made available in this article, unless otherwise
stated.
Fenger et al. BMC Cancer 2014, 14:84
/>
Background
Mast cell-associated malignancies are important diseases
in both humans and dogs [1,2] and are characterized by
activating mutations in KIT in both species. More than
90% of human patients with systemic mastocytosis carry
the D816V mutation in KIT [3] which results in constitutive activation of KIT signaling and plays a major role
in the proliferative phenotype. A functionally identical
mutation (D814V) is found in transformed mast cell
lines from rodents [4,5]. Similarly, approximately 30%
of dogs with high-grade cutaneous mast cell tumors
(MCTs) possess activating internal tandem duplications
(ITDs) in the KIT juxtamembrane (JM) domain [6,7].
More recently, activating mutations in the extracellular
domain of KIT (exons 8 and 9) have also been identified
in a proportion of canine MCTs [8]. While the role of
KIT dysfunction in mast cell neoplasia has been well
described, little is known regarding additional molecular
mechanisms that may contribute to invasion and metastasis of malignant mast cells.
The expression of matrix metalloproteinases (MMPs),
a family of enzymes involved in the degradation and
remodeling of extracellular matrix, has been implicated
in the neoplastic transformation of mast cells. Normal
canine bone marrow-derived mast cells (BMMCs) produce large quantities of inactive and active MMP9 in response to various stimuli while releasing little detectable
MMP2 [9]. Neoplastic mast cells are known to produce
both MMP2 and MMP9 [10] suggesting that the ability
to produce MMP2 may be a feature acquired by malignant mast cells. Furthermore, high-grade MCTs express
significantly higher levels of MMP9 in proactive and active forms, which has been proposed to be associated
with the high degree of malignant behavior of these
tumors [10,11]. More recently, characterization of the
proteome of primary canine low-grade MCTs and aggressive, high-grade MCTs identified differentially expressed
proteins between the two groups [12]. Several stress response proteins (HSPA9, TCP1A, TCP1E) and cytoskeletal
proteins associated with actin remodeling and cell migration (WDR1) were significantly up-regulated in high-grade
MCTs.
MicroRNAs (miRNAs) are highly conserved, noncoding RNAs that serve as important regulators of gene
expression. It is well established that miRNA expression
is altered in many human malignancies and that miRNAs
function as tumor suppressor genes or oncogenes through
dysregulation of target genes [13]. Currently there is
limited information regarding the potential role of
miRNA dysregulation in malignant mast cell disease.
Several miRNAs appear to play an important role in normal murine mast cell differentiation [14] and following
activation of murine mast cells, up-regulation of the
miR-221-222 family influences cell-cycle checkpoints, in
Page 2 of 16
part by targeting p27Kip1 [15]. Basal levels of miR-221 contribute to the regulation of the cell cycle in resting mast
cells. However, its effects are activation-dependent and in
response to mast cell stimulation; miR-221 regulates degranulation, cytokine production, and cell adherence [16].
More recent studies have demonstrated roles for miR-539
and miR-381 in mediating a novel regulatory pathway between KIT and microphthalmia-associated transcription
factor in normal and malignant mast cells [17].
The purpose of this study was to investigate the potential role of miRNA dysregulation in the biologic behavior
of primary canine MCTs. We found that unique miRNA
expression profiles correlate with the biological behavior of
primary canine MCTs and that miR-9 was significantly
overexpressed in aggressive MCTs compared to benign
MCTs. Furthermore, enforced miR-9 expression in murine
mastocytoma cell lines and normal murine BMMCs with
low basal levels of miR-9 enhanced invasion and induced
the expression of several target genes associated with
Table 1 Primers for quantitative reverse transcriptase
polymerase chain reaction
Primers
Primer sequences
Mouse Cma1 292F
5’-GAA GAC ACG TGG CAG AAG CTT GAG-3’
Mouse Cma1 521R
5’-GTG TCG GAG GCT GGC TCA TTC ACG-3’
Mouse Hspe F479
5’-GCT CAG TGG ACA TGC TCT ACA G-3’
Mouse Hspe R697
5’-GCA ACC CAT CGA TGA GAA TGT G-3’
Mouse Ifitm3 115F
5’-GCT TCT GTC AGA ACT ACT GTG-3’
Mouse Ifitm3 339R
5’-GAG GAC CAA GGT GCT GAT GTT CAG-3’
Mouse Mlana 125F
5’-GCT GCT GGT ACT GTA GAA GAC G-3’
Mouse Mlana 322R
5’-GTG AAG AGA GCT TCT CAT AGG CAG-3’
Mouse Pdzk1ip1 F520
5’-GTT CTG GCT GAT GAT CAC TTG ATT G-3’
Mouse Pdzk1ip1 R769
5’-GAT AGA AGC CAT AGC CAT TGC TG-3’
Mouse SerpinF1 712F
5’-GTG AGA GTC CCC ATG ATG TCA G-3’
Mouse SerpinF1 910R
5’-GTT CTC GGT CGA TGT CAT GAA TG-3’
Mouse Tlr7 F2284
5’-GTC ATT CAG AAG ACT AGC TTC CCA G-3’
Mouse Tlr7 R2441
5’-GTC ACA TCA GTG GCC AGG TAT G-3’
Mouse Cd200r1 659F
5’-GTA ACC AAT CTC TGT CCA TAG-3’
Mouse Cd200r1 902R
5’-GTC ACA GTA TCA TAG AGT GGA TTG-3’
Mouse Cd200r4 312F
5’-GCC TCC ACA CCT GAC CAC AG-3’
Mouse Cd200r4 532R
5’-GTC CAA GAG ATC TGT GCA GCA G-3’
Mouse Perp F108
5’-GCA GTC TAG CAA CCA CAT CCA G-3’
Mouse Perp R267
5’-GCA CAG GAT GAT AAA GCC ACA G-3’
Mouse Slpi F142
5’-GAG AAG CCA CAA TGC CGT ACT G-3’
Mouse Slpi R378
5’-GAC TTT CCC ACA TAT ACC CTC ACA G-3’
Mouse Pparg F682
5’-GAT ATC GAC CAG CTG AAC CCA G-3’
Mouse Pparg R983
5’-GCA TAC TCT GTG ATC TCT TGC ACG-3’
18S V2F
5’-AAA TCC TTT AAC GAG GAT CCA TT-3’
18S V2R
5’-AAT ATA CGC TAT TGG AGC TGG A-3’
Fenger et al. BMC Cancer 2014, 14:84
/>
metastasis, including chymase (CMA1) and heparinase
(HSPE). These data suggest that miR-9 overexpression may
contribute to the invasive phenotype of malignant mast
cells thereby providing a potentially novel pathway for
therapeutic intervention in malignant mast cell disease.
Methods
Cell lines, primary cell cultures, primary tumor samples
Mouse P815 (D814V KIT mutation) and C57 (wild-type
KIT) cell lines were provided by Dr. Stephen Galli
(Stanford University). The canine BR (activating point
mutation L575P in the JM domain of KIT) and C2 (KIT
ITD mutation in the JM domain) cell lines were provided
by Dr. Warren Gold (Cardiovascular Research Institute,
University of California- San Francisco). Cell lines were
maintained in RPMI 1640 (Gibco® Life Technologies,
Grand Island, NY, USA) supplemented with 10% fetal
bovine serum (Gibco® Life Technologies) and antibiotics
(Gibco® Life Technologies). Mouse BMMCs were generated from bone marrow from C57/B6 wild-type mice as
previously described [9]. Canine BMMCs were generated from 2 dogs and maintained in Stemline (SigmaAldrich, St. Louis, MO, USA) medium supplemented with
recombinant canine stem cell factor (R & D Systems,
Minneapolis, MN, USA) as previously described [18]. Protocols for collection of murine bone marrow and canine
bone marrow were approved by the Ohio State University
Page 3 of 16
(OSU) Institutional Care and Use Committee (IACUC),
protocols 2009A0204 and 2010A0015, respectively. Canine MCTs were obtained from 24 different affected dogs
presented to the OSU Veterinary Medical Center and
University of California-Davis (UCD) Veterinary Teaching
Hospital. Tumor sample collections were performed in accordance with established hospital protocols and approved
by respective IACUC at both OSU and UCD. Clinical outcome data, including sex, breed, primary tumor location,
recurrence and metastasis, histopathologic grade, mitotic
index, and outcome was available for all dogs (see
Additional file 1). Tumors obtained from dogs that were
adequately controlled with surgery alone and did not develop or die from metastatic mast cell disease were considered biologically low-grade tumors (benign). Tumors
from dogs that developed aggressive, metastatic mast cell
disease which resulted in their death were classified as
biologically high-grade tumors.
Quantitative reverse-transcription-PCR profiling of mature
miRNA expression in MCT biopsies
Total RNA was isolated by the Trizol method (Invitrogen,
Carlsbad, CA, USA) and heparinase treated as described
[19]. Primary MCT miRNA expression profiling was performed at the OSU Nucleic Acid Shared Resource using
the TaqMan Array Human miRNA Panel (Human A
Cards, v.2, Applied Biosystems, Foster City, CA, USA) as
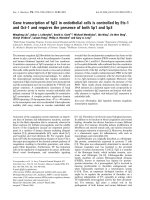
Figure 1 MiRNA expression in primary canine MCTs is associated with biological behavior. Primary canine MCTs were obtained from dogs
diagnosed with benign tumors (n = 12) or biologically high grade metastatic tumors (n = 12). Real-time PCR profiling was performed using Applied
Biosystems Human TaqMan Low Density miRNA Arrays to assess mature miRNA expression in primary tumors. Unsupervised hierarchical cluster
analysis separated samples into two groups based on biological behavior and demonstrate unique miRNA expression profiles associated with
biologically low-grade (L) tumors or high-grade (H) tumors (P < 0.05). (*) indicates primary tumor sample from a dog with a benign mast cell
tumor that clustered with the biologically high grade MCT group.
Fenger et al. BMC Cancer 2014, 14:84
/>
Page 4 of 16
described previously [20]. This panel assays the expression
of 377 human miRNAs, 151 of whose mature sequences
are 100% conserved between human and dog (Sanger
miRBase v.12). Raw data analysis, normalizer selection
and statistical analysis were performed using the real-time
PCR analysis software Statminer (Integromics, Madison,
WI, USA). The snRNA U6 was confirmed to be stably
expressed in our sample set and the mean used as the
normalizer value. Relative gene expression was calculated
using the comparative threshold cycle method [21]. Gene
expression heat maps were generated using Treeview PCbased software [22].
RNA isolation and quantitative real-time PCR
RNA was extracted from cell lines using TRIzol
(Invitrogen) and real-time PCR was performed using the
Applied Biosystems StepOne Plus Detection System.
MiR-9 is highly conserved and shares 100% homology between dogs, humans, and mice. Mature miR-9 expression
was performed using Taqman miRNA assays (Applied
Biosystems). 50 ng total RNA was converted to firststrand cDNA with miRNA-specific primers, followed by
real-time PCR with TaqMan probes. All samples were normalized to U6 snRNA.
Real-time PCR was performed to validate changes in
mRNA expression for selected genes affected by miR-9
over expression. cDNA was made from 1 μg of total
RNA using Superscript III (Invitrogen). CMA1, HSPE,
IFITM3, MLANA, PERP, PPARG, PDZK1IP1, SERPINF1,
SLPI, TLR7, CD200R1, CD200R4 and 18S transcripts
were detected using Fast SYBR green PCR master mix
(Applied Biosystems) according to the manufacturer’s
Table 2 MiRNA signature associated with biologically high-grade MCTs
miRNA
Fold-change
p-value
miRNA
Fold-change
Gene expression
Gene expression
High vs low grade MCT
High vs low grade MCT
p-value
Upregulated miRNAs
hsa-miR-301b
4.2
0.00022
hsa-miR-520b
1.8
1.8
hsa-miR-454
2.4
0.00032
hsa-miR-216b
4.6
0.023
hsa-miR-9
3.2
0.0010
hsa-miR-302b
3.2
0.024
hsa-miR-147
3.9
0.0017
hsa-miR-106b
1.6
0.026
hsa-miR-138
2.5
0.0022
hsa-miR-618
3.0
0.027
hsa-miR-330-5p
3.1
0.0027
hsa-miR-518f
3.2
0.029
hsa-miR-187
5.1
0.0029
hsa-miR-182
2.8
0.030
hsa-miR-106a
2.1
0.0044
hsa-miR-142-5p
1.7
0.031
hsa-miR-636
2.7
0.0052
hsa-miR-301a
2.8
0.032
hsa-miR-17
2.0
0.0057
hsa-miR-217
3.9
0.033
hsa-miR-449b
3.2
0.0069
hsa-miR-652
2.0
0.039
hsa-miR-130b
2.2
0.0082
hsa-miR-186
1.5
0.039
hsa-miR-192
2.5
0.0095
hsa-miR-19a
1.8
0.040
hsa-miR-448
3.1
0.010
hsa-miR-872
1.5
0.041
hsa-miR-425
3.0
0.011
hsa-miR-148b
1.8
0.043
hsa-miR-193a-3p
2.6
0.011
hsa-miR-451
2.4
0.044
hsa-miR-18b
2.2
0.014
hsa-miR-423-5p
1.7
0.048
hsa-miR-93
2.1
0.014
hsa-miR-191
1.5
0.049
hsa-miR-548b-5p
2.3
0.015
Downregulated miRNAs
hsa-miR-25
2.1
0.015
hsa-miR-885-5p
-4.2
0.00011
hsa-miR-324-3p
2.3
0.017
hsa-miR-874
-5.8
0.00018
hsa-miR-326
2.6
0.017
hsa-miR-486-3p
-4.6
0.00040
hsa-miR-18a
3.1
0.017
hsa-miR-299-5p
-4.2
0.0020
hsa-miR-20b
2.0
0.017
hsa-miR-488
-3.9
0.0063
hsa-miR-194
2.8
0.019
hsa-miR-200a
-5.5
0.034
hsa-miR-372
2.4
0.019
hsa-miR-412
-2.8
0.035
Fenger et al. BMC Cancer 2014, 14:84
/>
Page 5 of 16
protocol; primer sets are detailed in Table 1. Normalization was performed relative to 18S rRNA. All
reactions were performed in triplicate and included notemplate controls for each gene. Relative gene expression
for all real-time PCR data was calculated using the comparative threshold cycle method [21]. Experiments were
repeated 3 times using samples in triplicate.
MiR-9 lentivirus infection
Lentiviral constructs were purchased from Systems
Biosciences (Mountain View, CA, USA). Packaging of the
lentiviral constructs was performed using the pPACKH1
Lentivector Packaging KIT (catalog no. LV500A-1) according to the manufacturer’s instructions. P815 and
C57 mouse mastocytoma cells and mouse BMMCs
(105 cells) were transduced with empty lentivirus (catalog
no. CD511B-1) or pre-miR-9-3 lentivirus (catalog no.
PMIRH9-3PA-1). FACS-mediated cell sorting based on
GFP expression was performed 72 hours post-transduction
and miR-9 expression was evaluated by real-time PCR
(Applied Biosystems).
Transcriptional profiling of cells transduced with miR-9
lentivirus
RNA was extracted from mouse BMMCs and P815 cells
transduced with empty lentivirus or pre-miR-9-3 lentivirus from three separate transduction experiments
using TRIzol (Invitrogen). A secondary RNA cleanup
step was performed using QIAGEN RNeasy Total RNA
isolation kit (QIAGEN GmbH, Hilden, Germany) and
RNA integrity was assessed using RNA 6000 Nano
LabChip® Kits on the Agilent Bioanalyzer 2100 (Agilent
Technologies, Palo Alto, CA, USA). RNA was labeled
Matrigel invasion assay
To assess the effect of miR-9 expression on invasion, cell
culture inserts (8-μm pore size; Falcon) were coated with
100 μL of Matrigel (BD Bioscience, San Jose, CA, USA)
to form a thin continuous layer and allowed to solidify
at 37°C for 1 hour. P815 and C57 cell lines, and mouse
BMMCs (5 × 10⁵/mL) transduced with control lentivirus
or pre-miR-9-3 lentivirus were prepared in serum-free
medium and seeded into each insert (upper chamber)
and media containing 10% fetal bovine serum was placed
in the lower chamber. The cells were incubated for
24 hours to permit invasion through the Matrigel layer.
Cells remaining on the upper surface of the insert membrane were wiped away using a cotton swab, and cells
that had migrated to the lower surface were stained with
crystal violet and counted in ten independent 20× high
powered fields for each sample. Experiments were repeated 3 times using samples in triplicate.
B
0.018
MiR-9 Gene Expression, 2- CT
MiR-9 Gene Expression, 2- CT
A 0.020
with Cy3 using RNA ligase and hybridized to GeneChip®
Mouse Gene 2.0 ST Arrays (Affymetrix, Santa Clara,
CA, USA). Ratios of signals were calculated and transcripts that were up-regulated or down-regulated by
at least 2-fold were identified (p < 0.05). Data analysis,
statistical analysis, and generation of gene expression heat
maps were performed using Affymetrix® Transcriptome
Analysis Console (TAC) Software. Prediction of miR-9
binding to the 3’-UTR of genes down-regulated by miR-9
was performed with computer-aided algorithms obtained from TargetScan (), PicTar
(), miRanda (), and miRWalk (-heidelberg.
de/apps/zmf/mirwalk).
0.016
0.014
0.012
0.010
0.008
0.006
*
0.004
0.002
0.000
0.008
0.007
0.006
0.005
0.004
0.003
0.002
0.001
0.000
Low Grade MCTs
High Grade MCTs
cBMMC
BR
Canine
C2
mBMMC P815
Mouse
C57
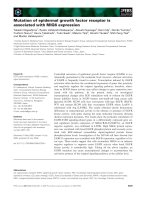
Figure 2 MiR-9 is highly expressed in biologically high grade canine MCTs and malignant mast cell lines. (A) Real-time PCR evaluating
mature miR-9 expression in primary canine MCTs demonstrated that the mean expression of miR-9 was 3.2-fold higher in aggressive, high grade
MCTs compared to benign MCTs (p = 0.001). (*) indicates primary tumor sample from a dog with a low-grade mast cell tumor that expressed high
levels of miR-9 but had lymph node metastasis at the time of surgery. (B) Malignant canine BR and C2 mast cells, normal canine and mouse
BMMCs, and malignant mouse C57 and P815 cells were cultured and real-time PCR was performed to assess miR-9 expression levels. Three
independent experiments were performed and all reactions were performed in triplicate. The experiments were repeated 3 times in the cell lines and
twice for normal cBMMCs.
Fenger et al. BMC Cancer 2014, 14:84
/>
Page 6 of 16
Evaluation of proliferation and apoptosis
Cell proliferation was calculated as a percentage of
untransduced control cells.
Caspase-3/7 activity was determined using the SensoLyte® Homogeneous AMC Caspase- 3/7 Assay KIT
(Anaspec Inc, San Jose, CA, USA) as previously described [24]. P815 and C57 cells (5.0 × 10⁴) transduced
with either empty lentivirus or pre-miR-9-3 lentivirus
were plated for 24 and 48 hours in 96-well plates prior
to analysis. Fluorescence was measured on a SpectraMax
microplate reader (Molecular Devices). Levels of caspase
Changes in cell proliferation were assessed using the
CyQUANT® Cell Proliferation Assay KIT (Molecular
Probes, Eugene, OR, USA) as previously described [23].
P815 and C57 cells (15 × 104) transduced with control
lentivirus or pre-miR-9-3 lentivirus were seeded in 96-well
plates for 24, 48, and 72 hours prior to analysis. Nontransduced P815 and C57 cells served as negative control
wells. Fluorescence was measured using a SpectraMax microplate reader (Molecular Devices, Sunnyvale, CA, USA).
*
0.025
B
Mean Number Invaded Cells/hpf
0.035 P815 (D814V) KIT)
C57 (WT KIT)
*
0.030
0.025
0.020
0.020
0.015
0.015
0.010
0.010
0.005
0.005
0.000
0.000
WT
C
EV
miR-9
WT
EV
% Cells Surviving (% Control)
EV
miR9
100
80
60
40
20
*
9
8
25
7
20
6
5
15
4
10
3
2
5
1
0
0
EV
miR-9
WT
EV
miR-9
400
EV
miR9
300
200
100
0
24h
48h
72h
24h
3000
P815 (D814V) KIT)
48h
P815 (D814V) KIT)
2500
100
Flourescence (RFU)
% Cells Surviving (% Control)
30
500 C57 (WT KIT)
0
120
*
WT
D
120 C57 (WT KIT)
10 P815 (D814V) KIT)
35 C57 (WT KIT)
miR-9
Flourescence (RFU)
MiR-9 Gene Expression, 2- CT
A 0.030
80
60
40
20
2000
1500
1000
500
0
0
24h
48h
72h
24h
48h
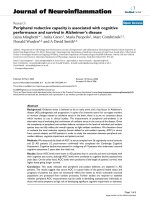
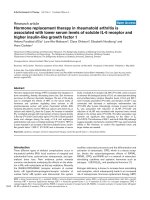
Figure 3 Overexpression of miR-9 enhances invasion of malignant mast cells and has no effect on cell proliferation or apoptosis.
(A) Mouse P815 and C57 mast cells transduced with pre-miR-9-3 lentivirus or empty vector control were sorted to greater than 95% purity based
on GFP expression. MiR-9 levels were assessed by real-time PCR in wild-type, empty vector, and miR-9 expressing cells (*p < 0.05). Three independent
experiments were performed and all reactions were performed in triplicate. (B) Mouse P185 and C57 mast cells transduced with either empty vector or
pre-miR-9-3 lentivirus were transferred onto cell culture inserts coated with Matrigel® for 24 hrs. After incubation, membranes were stained and cells
that had invaded the membrane were counted in ten independent 20x hpf for each sample. Three independent experiments were performed and all
assays were performed in triplicate wells (*p < 0.05). (C) Mouse P185 and C57 mast cells were transduced with either empty vector or pre-miR-9-3
lentivirus vector and cell proliferation was analyzed at 24, 48, and 72 hours using the CyQUANT method. Nontransduced P815 and C57 cells served
as non-treated controls. Three independent experiments were performed and all samples were seeded in triplicate wells. Values are reported as
percentage of untransduced control cells. (D) Mouse P185 and C57 mast cells transduced with either empty vector or pre-miR-9-3 lentivirus were
assessed for apoptosis at 24 and 48 hours by measuring active caspase-3/7 using the SensoLyte® Homogeneous AMC Caspase-3/7 Assay kit. Relative
fluorescence units are reported after subtraction of fluorescence levels of wells with medium only.
Fenger et al. BMC Cancer 2014, 14:84
/>
Page 7 of 16
3/7 activity were reported after subtraction of fluorescence levels of wells with medium only.
Statistical analysis
Statistical analysis relative to miRNA expression data
was performed with Statminer software (Integromics)
and p-values of <0.05 were considered statistically significant. Statistical analysis relative to mRNA expression
data was performed using Affymetrix® Transcriptome
Analysis Console (TAC) Software. Differential gene
expression was determined by one-way ANOVA comparison test and p-values of <0.05 were considered statistically significant. All experiments with the exception
of those involving canine BMMCs were performed in
triplicate and repeated 3 times. Experiments using canine
BMMCs were performed in triplicate, but repeated only
twice because of limited cell numbers. Data were presented
as mean plus or minus standard deviation. The difference
between two group means was analyzed using the Students
t-test and a one-way analysis of variance (ANOVA) was
performed for multiple variable comparisons. P-values
of <0.05 were considered significant.
Results
MiRNA expression in primary canine MCTs is associated
with biological behavior
To investigate the role of miRNA dysregulation in the
biologic behavior of mast cell disease, global miRNA expression in primary canine MCTs obtained from 24 dogs
miR-9 is overexpressed in biologically high-grade
canine MCTs
The miRNA array performed above identified miR-9 as
overexpressed in MCTs that metastasized and resulted
in death of affected dogs. This finding was confirmed by
real-time PCR in which a 3.2-fold increase in miR-9 expression was identified in biologically aggressive MCTs
as compared to benign MCTs (Figure 2A). Furthermore,
miR-9 expression correlates with tumor grade and metastatic status in human breast cancer, providing further
support for the idea that altered miR-9 expression may
be an important regulator of aggressive biological behavior
in MCTs (33). Interestingly, one of the primary tumor
B
0.018
mBMMCs
*
0.016
0.014
0.012
0.010
0.008
0.006
0.004
0.002
0.000
WT
EV
miR-9
Mean Number Invaded Cells/hpf
MiR-9 Gene Expression, 2- CT
A
diagnosed with benign tumors (n = 12) or with biologically high-grade tumors (n = 12) was evaluated using realtime PCR-based TaqMan Low Density miRNA Arrays
(Applied Biosystems). An unsupervised hierarchial cluster analysis of all primary MCTs readily separated tumors into groups based on biological behavior with
aggressive, highly metastatic MCTs clustering together
and clinically benign MCTs clustering together separately (Figure 1). We identified 45 miRNAs that had
significantly higher expression in biologically highgrade MCTs compared to biologically low-grade MCTs,
while 7 miRNAs had lower expression (Table 2). These
data demonstrate that biologically high-grade and lowgrade canine MCTs possess distinct miRNA expression
signatures.
25
mBMMCs
*
20
15
10
5
0
EV
miR-9
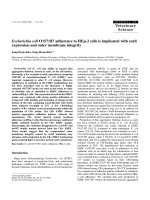
Figure 4 Overexpression of miR-9 enhances invasion in normal mouse bone marrow-derived mast cells. (A) Normal mBMMCs transduced
with pre-miR-9-3 lentivirus or empty vector control were sorted to greater than 95% purity based on GFP expression. MiR-9 levels were assessed
by real-time PCR (*p < 0.05). Three independent experiments were performed and all reactions were performed in triplicate. (B) mBMMCs transduced
with either empty vector or pre-miR-9-3 lentivirus were transferred onto cell culture inserts coated with Matrigel® for 24 hrs. After incubation, cells
remaining on the upper surface of the insert membrane were wiped away using a cotton swab, and cells that had migrated to the lower surface were
stained with crystal violet and counted in ten independent 20x hpf for each sample. Three independent experiments were performed and all samples
were performed in triplicate wells (*p < 0.05).
Fenger et al. BMC Cancer 2014, 14:84
/>
Page 8 of 16
Figure 5 (See legend on next page.)
miR9
miR9
miR9
2.02
EV
EV
EV mBMMC
13.23
Fenger et al. BMC Cancer 2014, 14:84
/>
Page 9 of 16
(See figure on previous page.)
Figure 5 Overexpression of miR-9 in normal mouse bone marrow-derived mast cells significantly alters gene expression. Normal
mBMMCs transduced with pre-miR-9-3 lentivirus or empty vector control were sorted based on GFP expression. RNA was harvested from mouse
BMMCs transduced with empty vector or pre-miR-9-3 lentivirus from three separate transduction experiments. Transcriptional profiling was
performed using Affymetrix GeneChip® Mouse Gene 2.0 ST Arrays. Hierarchical clustering was performed for 450 genes differentially expressed
(p < 0.05) in mBMMCs expressing either empty vector (EV) or miR-9 (miR9) as determined by one-way ANOVA comparison test (p < 0.05). Mean
centered signal intensities of gene-expression are depicted by the log2 of the ratio of the signals against the average signal for each comparison.
Color areas indicate relative expression of each gene after log2 transformation with respect to the gene median expression (red above, green
below, and black equal to the mean).
samples collected from a dog with a biologically lowgrade MCT expressed high levels of miR-9 and the
unsupervised hierarchial clustering of all 24 MCTs
demonstrated that this dog’s tumor clustered with the
biologically high-grade tumors (Figure 1). Clinical data
was subsequently reviewed for all dogs and it was determined that this dog had histopathologically confirmed evidence of metastatic mast cells present in a
regional lymph node surgically excised at the time of
primary tumor removal. Additionally, one high-grade
MCT clustered with the low-grade tumors, however, this
may have been due, in part, to variations in stroma/
inflammatory cells within the primary tumor specimen
or baseline necrosis within the tumor that influenced the
proportion of tumor cells. Taken together, these findings
suggest a correlation between miR-9 expression levels in
primary canine MCTs and metastatic behavior.
Overexpression of pre-miR-9 enhances invasion of
malignant mast cell lines
miR-9 expression is up-regulated in canine malignant
mast cell lines
To investigate whether overexpression of miR-9 in malignant mast cells affected their capacity to proliferate or
survive, mouse C57 and P815 cell lines expressing premiR-9-3 lentivirus or empty vector control were cultured
for 24, 48, and 72 hrs and the impact on cell proliferation and apoptosis was assessed. No effects of miR-9 on
proliferation or apoptosis were observed in either cell
line when compared to cells expressing empty vector
(Figure 3C and D).
Given the potential link between miR-9 expression and
biological behavior of MCTs, we next evaluated miR-9
expression in canine (BR and C2) and murine (C57 and
P815) mast cell lines and normal canine and murine
BMMCs by real-time PCR. As shown in Figure 2B,
canine mastocytoma cells exhibited higher levels of
miR-9 expression when compared with normal canine
BMMCs. In contrast, both mouse C57 and P815 cells
and mouse BMMCs demonstrated low basal levels of
miR-9. The mouse P815 mastocytoma cell line is a
leukemia of mast cell origin, whereas the canine BR
and C2 mastocytoma cells are derived from cutaneous
tumors. The differences in the biology of these diseases
may account for the observed differences in miR-9
expression in canine and murine cell lines. Low miR-9
expression in P815 cells may reflect the fact that these
cells represent a true leukemia, in contrast to the BR
and C2 cell lines which are derived from cutaneous tumors that would metastasize via the lymphatic system.
Given prior work from our laboratory showing that the
C2 line exhibits invasive behavior in vitro while the
P815 line does not [24], it was possible that miR-9
expression was associated with the invasive behavior of
mast cells.
To investigate the functional consequences of miR-9
overexpression in malignant mast cell lines, we stably
expressed miR-9 in the mouse P815 and C57 cell lines
that exhibit low basal levels of this miRNA using an
empty or pre-miR-9-3 expressing lentivirus vector. Following transduction, GFP + cells were sorted and miR-9
expression was confirmed by real-time PCR (Figure 3A).
The invasive capacity of cells was then evaluated using
a standard Matrigel invasion assay after 24 hours of
culture. As shown in Figure 3B, enforced expression
of miR-9 in C57 and P815 mast cell lines significantly
enhanced their invasion compared to cells expressing
empty vector.
miR-9 has no effect on cell proliferation or caspase-3,7
dependent apoptosis in malignant mast cells
miR-9 expression enhances invasion in normal
mouse BMMCs
To characterize the biological consequences of miR-9
overexpression in normal mast cells, we transduced
murine BMMCs with pre-miR-9-3 lentivirus or empty
control vector. MiR-9 overexpression in transformed
BMMCs was confirmed by quantitative real-time PCR
(Figure 4A). To assess the effect of ectopic miR-9
expression on the invasive capacity the BMMCs, a
Matrigel invasion assay was again performed. Consistent
with findings in the P815 and C57 cell lines, enforced
expression of miR-9 in mouse BMMCs significantly
enhanced their invasive capacity compared to cells expressing empty vector (Figure 4B). Together, these data
suggest that miR-9 promotes an invasive phenotype in
mast cells.
Fenger et al. BMC Cancer 2014, 14:84
/>
Page 10 of 16
Table 3 Gene transcripts altered by miR-9 overexpression
in BMMCs
Downregulated with miR-9 expression (BMMCs)
1-Sep
Ell2
Phgdh
1300014I06Rik
Emp1
Pi16
1600029D21Rik
Eya2
Plk2
2810025M15Rik
Fn1
Plod2
5830428M24Rik
Fzd4
Ppap2b
A2ld1
Gatm
Pparg
Akr1c18
Glrp1
Ppic
Alox15
Gm10021
Prg2
Amigo2
Gm19524
Prss34
Ankrd22
Gm2663
Psat1, LOC100047252
Ankrd55
Gm6445
Rbp4
Arfip1
Gnpnat1
Reep6
Arg2
Gpc4
Retnla
Asb2
Gpt2
Rhoj
Asns
Grb10
Scd1
Atp1b1
H2-M2
Scn7a
Atp8b4
Hal
Serpinb9b
Awat1
Hdc
Sgce
BC100530
Hgf
Slamf1
Bex1
Il18rap
Slc16a1
Bri3bp
Il1f9
Slc22a3
C87414
Il6st
Slc36a4
Ccdc88c
Itk
Slc43a3
Ccl17
Klf5
Slc7a1
Ccl24
Klrb1f
Slc7a5
Ccl8
Lama5
Slpi
Cd209d
Lcn2
Snord70
Cd24a
LOC100861767
Speer4e, Gm17019
Cd36
LOC100862026
Stfa2
Cdh17
Lrrk2
Stfa2l1
Cdkn2b
Mbnl3
Sulf2
Celsr1
Mcpt8
Syne1
Chi3l4
Mgam
Taf1d
Clec4e
Mmp13
Tfrc
Colec12
Mrgpra6
Thbs1
Csf3r
Niacr1
Tm4sf19
Ctsg
Nrg1
Tmem26
Ctsk
O3far1
Tnfrsf10b
Ctsl
Olr1
Tspan7
Dennd2d, 2010016I18Rik
Pdlim1
Ube2e2
Dnajc6
Perp
Vmn1r129
Ear2, Ear12, Ear3
Pga5
Zbtb10
Egln3
Phf10
Zfp608
Bold indicates predicted miR-9 targets.
Microarray analysis identified genes affected by miR-9
To gain insight into possible mechanisms underlying the
observed miR-9-dependent invasive behavior of mast
cells, we compared the transcriptional profiles of murine
BMMCs overexpressing miR-9 to those expressing empty
vector and found marked changes in gene expression
(Figure 5). In BMMCs overexpressing miR-9, 321 transcripts were significantly up-regulated (>2-fold) and 129
transcripts were significantly down-regulated (Table 3,
Table 4). Bioinformatic analysis identified putative miR-9
target sites within the 3’-UTR of 40 gene transcripts that
were significantly down-regulated with miR-9 overexpression, suggesting that miR-9 may directly target and
regulate expression of these candidate genes (Table 3,
bolded). Real time PCR confirmed that one of these genes,
peroxisome proliferator-activated receptor δ (PPARG) was
down-regulated, a finding consistent with recent studies
demonstrating regulation of PPARG by miR-9 through direct targeting of its 3’-UTR [25]. We performed real-time
PCR to validate changes in gene expression for several
transcripts altered by miR-9 overexpression in BMMCs.
Consistent with our microarray results, we found that transcripts for HSPE and TLR7 were significantly up-regulated
in BMMCs expressing miR-9, whereas transcripts for
PPARG, PERP, and SLPI were significantly down-regulated
compared to empty vector controls (Figure 6A).
Similar transcriptional profile analysis was performed
using malignant mouse P815 cells and we identified 46
transcripts significantly up-regulated (>2-fold) and 48
transcripts significantly down-regulated in the miR-9 expressing P815 cells (Table 5). Bioinformatic analysis
identified putative miR-9 target sites within the 3’-UTR
of 15 gene transcripts that were significantly downregulated following miR-9 overexpression, suggesting
that miR-9 may directly regulate these genes (Table 5,
bolded). Real-time PCR demonstrated that expression of
SERPINF1 and MLANA transcript was up-regulated in
P815 cells overexpressing miR-9, whereas CD200R1 and
CD200R4 was down-regulated compared to empty vector controls (Figure 6B).
A comparison of the transcriptional profiles both from
normal BMMCs and malignant P815 cells overexpressing
miR-9 found that most gene transcripts altered by miR-9
were specific to normal or malignant mast cells. We identified 7 gene transcripts (IFITM3, PDZK1IP1, CMA1,
MGL1, TMEM223, SLAMF1, CLEC4E) that showed similar changes in expression following miR-9 overexpression
in both BMMCs and P815 cells. We performed real-time
PCR to validate changes in gene expression for several transcripts altered by miR-9 overexpression, including mast
cell chymase (CMA1), interferon-induced transmembrane protein 3 (IFITM3), and PDZK1 interacting protein
1 (PDZK1IP1). Consistent with our microarray results,
real-time PCR confirmed that enforced miR-9 expression
Fenger et al. BMC Cancer 2014, 14:84
/>
Page 11 of 16
Table 4 Gene transcripts altered by miR-9 overexpression
in BMMCs
Table 4 Gene transcripts altered by miR-9 overexpression
in BMMCs (Continued)
Upregulated with miR-9 expression (BMMCs)
C330018A13Rik
Gm1966
Mnda, Ifi204
C5ar1
Gm20099
Mpeg1
Smpx
1810011H11Rik
Ddx60
Irg1
Plxna1
2310028H24Rik
Dnaja4
Itgb5
Plxnb3
Smpdl3b
3110043O21Rik
Dpep2
Kcnab3
Plxnc1
Cacnb4
Gm4759
Mrgpra9
Snord14e,
Hspa8
4930420K17Rik
Dusp22
Kcne3
Ppargc1a
Cadm3
Gm4951
Mrgprb2
St3gal5
5033411D12Rik
E130215H24Rik
Kctd12
Ppfibp2
Car8
Gm5431
Ms4a4a
St6galnac3
5430435G22Rik
E330020D12Rik
Kctd6
Ppp1r14c
Ccl2
Gm7977
Ms4a6b
Stab1
Gmpr
Ms4a6c
Stfa3
Ednra
Khdc1a
Prdx1,
LOC100862012
Ccl4
6330415B21Rik
Ccl7
Gna14
Ms4a6d
Sult1a1
9030625A04Rik
Egr1
Kit
Prickle1
Ccnd1
Gp1ba
Ms4a7
Syn2
9430070O13Rik
Emx2
Klf2
Psd3
Ccr1l1
Gp5
Msr1
Syngr1
9930111J21Rik2
Epsti1
Klk1b1
Psg23
Ccr3
Gpm6a
Mtss1
Tdrd5
A130040M12Rik
Esco2
Klk1b11
Ptafr
Ccr5
Gpr55
Nav1
Tek
A230098N10Rik
Esr1
Klk1b27
Ptger2
Ccrl2
Grap2
Neb
Tgfbr2
A430084P05Rik
Evl
Klk1b5
Ptplad2
Cd14
H2-DMa
Nlrp1b
Tlr1
A4galt
F13a1
Kmo
Ptpn13
Cd180
H2-DMb2
Nlrp1c
Tlr13
Abi3
Fabp5
Lce6a
Qpct
Adamtsl3
Fabp5, Gm3601
LOC100038947 Rasgrp3
Cd200r2
H2-Q6,H2-Q8,
LOC68395
Npy1r
Tlr7
Adrb2
Fam125b
LOC100861753 Rassf4
Cd28
Hey2
Nrn1
Tlr9
Hist1h1d
Oas2
Tmem106a
AI593442
Fam55d
LOC100861977 Rbm47
Cd300a
AI607873
Fam69a
LOC100862646 Rin2
Cd300lb
Hist1h1e
Oasl2
Tmem233
Hist1h2bg
Olfr1033
Tmem86a
Alcam
Fcgr4
Lphn1
Rnase4, Ang
Cd300ld
Alpk2
Fkbp1b
Lrp1
Rnase6
Cd86
Hist2h3b
Olfr110
Tnfrsf1b
Hist2h4
Olfr111
Tns1
Ank
Fos
Lrrc16a
Rnf180
Cdh2
Ano3
Fpr2
Lrrc25
Rny1
Chst15, Gm10584
Hist3h2a
Olfr1392
Trem1
Hist4h4
Olfr1393
Trim30c
Aoah
Galnt10
Lrrtm1
Rps6ka2
Cited4
Apobec1
Galntl4
Ltf
Rsph9
Clec4a1
Hivep2
Olfr915
Trim30d
Hpse
Olfr916
Trim58
Ar
Gas6
Ly6i
Rtp4
Clec4d
Arhgap20
Gbp3
Lyz1
Ryr3
Clec4n
Hsd3b6
Olfr917
Trpc6
Ier2
Olfr918
Tsc22d3
Arhgap24
Gbp4
Maf
Scn1b
Cma1
Arhgap31
Gbp5
Mast4
Scpep1
Cma2
Ifi204
Orm3
Tspan13
Ifi27l2a, Ifi27l2b
P2rx7
Tspan8
Arl5b
Gbp8
Mc1r
Serpinb8
Cmklr1
Asphd2
Gbp9
Mecom
Siglec1
Creb5
Ifitm3
P2ry6
Tubb2b
Ifitm6
Pcdhga10
Txk
Bank1
Gcet2
Mgl2
Sirpb1a
Csf1r
BC013712
Gdf15
Mgll
Sirpb1b
Ctnna2
Ighm
Pcdhgb6
Ugt1a10
Ctsh
Igk-V28
Pdzk1ip1
Unc93b1
Bcl2a1b, Bcl2a1a
Gdpd1
Mir15b
Slc30a2
Bcl2a1d, Bcl2a1a,
Bcl2a1b
Cx3cr1
Il18
Pgap1
Zbp1
Ggh
Mir181a-1
Slc37a2
Cybb
Il2ra
Pid1
Zbtb8a
Bhlhe41
Glul
Mir3095
Slc39a4
Cyp4a12a
Il6ra
Pion
Zfhx3
Bmpr2, Gm20272
Gm11711,
Cd300lh
Mir3108
Slc40a1
Dab2
Iqsec3
Pld2
Bst1
Gm12250
Mir511
Slc4a11
Darc
Irf5, Tnpo3
Pld4
Dbc1
Irf8
Plekhm3
Bst2
Gm14446
Mir701
Slc6a12
C1qb
Gm15915
Mlph
Slc9a9
C1qc
Gm1673
Mmp2
Slfn5
Fenger et al. BMC Cancer 2014, 14:84
/>
A
mBMMC
Gene Expression, 2- CT
0.000025 HSPE
0.000030 TLR7
*
0.000020
0.000020
0.000015
0.000010
0.000010
0.000008 PPARG
0.000040 PERP
0.0007 SLPI
0.000007
0.000035
0.0006
0.000006
0.000030
0.000005
0.000025
0.000004
0.000020
0.000003
0.000015
0.000005
EV
0.000000
miR-9
*
0.000001
EV
miR-9
0.0005
0.0004
*
0.0003
0.0002
0.000010
0.000002
0.000005
B
0.0000
0.000000
0.000000
EV
miR-9
*
0.0001
0.000005
EV
miR-9
EV
miR-9
P815 (D814V KIT)
*
0.000020 SERPINF1
*
0.000004 MLANA
0.000008 CD200R1
0.000015
0.000003
0.000006
0.000010
0.000002
0.000004
0.000025 CD200R4
0.000020
0.000015
0.000001
WT
C
EV miR-9
0.000012
0.000010
EV miR-9
IFITM3
P815 (D814V KIT)
0.00014
*
*
0.00000
*
0.000020
0.000015
0.000015
0.000010
0.000005
0.000005
0.00002
WT EV miR-9
0.000020
0.000000
EV miR-9
WT EV miR-9
0.000000
0.006
0.000020
0.000010
0.00004
P815 (D814V KIT)
0.000025
*
WT
EV miR-9
CMA1
mBMMC
0.000025
0.00006
0.000000
0.000035
0.000030
0.00012
0.000006
0.000002
EV miR-9
PDZK1IP1
0.00008
0.000004
0.000000
WT
P815 (D814V KIT)
mBMMC
0.00010
0.000008
0.000005
0.000000
WT
0.000010
*
0.000002
0.000000
0.000000
*
EV miR-9
Gene Expression, 2- CT
0.000005
Gene Expression, 2- CT
Gene Expression, 2- CT
*
0.000025
0.000015
0.000000
Gene Expression, 2- CT
Page 12 of 16
0.000016
*
mBMMC
*
0.005
0.004
0.000012
0.003
0.000008
0.002
0.000004
0.001
0.000000
WT EV miR-9
0.000
EV miR-9
Figure 6 Identification of transcripts dysregulated by miR-9 overexpression in normal murine BMMCs and P815 malignant mast cells.
(A) Transcriptional profiling of mBMMCs expressing pre-miR-9-3 lentivirus or empty vector control was performed using Affymetrix GeneChip®
Mouse Gene 2.0 ST Arrays to identify genes showing differential expression (>2-fold) with miR-9 overexpression. Real-time PCR was performed
to validate changes in gene expression for transcripts (HSPE, TLR7, PERP, PPARG, SLPI) altered by miR-9 overexpression in mBMMCs (*p < 0.05).
(B) Transcriptional profiling of P815 mast cells expressing pre-miR-9-3 lentivirus or empty vector control was performed as described above. Real-time
PCR was performed to independently validate expression levels of genes (SERPINF1, MLANA, CD200R1, CD200R4) altered by enforced miR-9 expression
in P815 cells (*p < 0.05). (C) Mouse BMMCs and P815 cells expressing pre-miR-9-3 lentivirus or empty vector control were collected and real-time PCR
for IFITM3, PDZK1IP1, and CMA1 was performed (*p < 0.05). Three independent experiments were performed using cells from 3 separate transduction
experiments and all reactions were performed in triplicate.
significantly upregulated CMA1, IFITM3, and PDZK1IP1
transcripts in mouse BMMCs and P815 cells (Figure 6C).
These findings provide further support for the notion that
miR-9 induces alterations in gene expression that may
contribute to the development of an invasive phenotype.
Discussion
MiRNAs regulate various biological functions in normal
cells such as growth and differentiation, and they are
increasingly recognized as playing critical roles in cancer
development and progression. Dysregulation of miRNA
expression resulting from amplification or loss of miRNAs
in tumors compared to their normal tissue counterparts
suggests that miRNAs can function as either oncogenes or
tumor suppressor genes [13]. Studies evaluating miRNA
expression in spontaneously occurring tumors in dogs
demonstrate that similar to human cancers, alteration of
miRNAs likely contributes to tumorigenesis and that high-
Fenger et al. BMC Cancer 2014, 14:84
/>
Page 13 of 16
Table 5 Gene transcripts altered by miR-9 overexpression
in P815 mast cells
Table 5 Gene transcripts altered by miR-9 overexpression
in P815 mast cells (Continued)
Upregulated with miR-9
expression (P815)
Downregulated with miR-9
expression (P815)
Mpp4
Ifitm3
Ligp1
Pdzk1ip1
Ppm1j
Cma1
Gbp2
Pfkp
Hist2h3c1
Serpinf1
Ly6a
Trim63
Cd200r1
As3mt
Gzmb
Speg
Gbp6
Mlana
Afp
Mgl1
Ifit1
Tmem223
Parp14
Fjx1
Ctla2a
Vamp5
Igtp
Cthrc1
Slamf1
Ptgis
Tnfrsf9
Ass1
Cpa3
Ahi1
Ctla2b
Akap13
Tgtp//Tgtp2
Prf1
Rabgap1l
Ston2
Clec4e
Hcfc1
Parp9
Trak1
Plekha1
Ankrd6
Il1rl1
Atn1///Rnu7
Sdf2l1
Fam122b
Gvin1
Mll1
Il2ra
Zbtb12
Fcgr1
Ahnak
Gfi1
Sec14l1
Thoc1
Mknk2
Hist1h2ad
Apobec2
Tmed7
Tspan32
Ugt1a1
Hnrnpl
Taf7l
Serbp1
Slc13a2
Msi2
Cd200r4
Myl9
Vegfc
Runx2
Oasl2
Gstm1
Socs3
Epb4.1l4b
677168///Isg15
LOC100041694
Ctso
2310051F07Rik
Adam8
Arx///LOC100044440
Samd9l
Mest
1810014B01Rik
LOC641050
Rp131
Lrrc28
Sphk1
Hist2h2be
Ebi3
Igf1
Bold indicates predicted miR-9 targets.
throughput methodologies used for the study of miRNAs
in human tissues can also be applied to dogs [26-32].
Cutaneous MCTs are the most common skin tumor in
dogs; however, little is known regarding mechanisms
underlying malignant transformation of these cells. The
biological behavior of canine MCTs ranges from relatively benign disease cured with surgical removal to aggressive, highly metastatic tumors ultimately resulting
in the death of affected dogs. While the presence of activating KIT mutations helps to explain the behavior
of some canine MCTs, little is known regarding the
potential role of miRNAs in both normal and malignant mast cells. The purpose of this study was to begin
to investigate the potential role of miRNA dysregulation
in canine MCTs that exhibit aggressive biologic behavior.
MiRNA expression profiling of primary canine MCTs
identified unique miRNA signatures associated with aggressive MCTs as compared to benign MCTs. The unsupervised hierarchical clustering of primary cutaneous
MCTs based on their miRNA expression profiles recapitulated the grouping of the tumors based on their biological behavior, supporting the notion that miRNA
dysregulation is associated with the biologic behavior of
canine MCTs. Furthermore, we found that miR-9 expression was significantly upregulated in aggressive MCTs
compared to benign MCTs. Interestingly, miR-9 was identified as a pro-metastatic miRNA in human breast cancer
cell lines through its ability to enhance cell motility and
invasiveness in vitro and metastasis formation in vivo [33].
More recently, miR-9 expression was found to be significantly increased in paired primary tumors and distant
metastatic sites, suggesting direct involvement of miR-9 in
the metastatic process [34,35]. In concordance with the
potential role of miR-9 in malignant mast cell behavior,
the BR and C2 canine malignant cell lines expressed high
levels of miR-9 compared to normal canine BMMCs.
Taken together, these data support the notion that dysregulation of miR-9 may contribute to the aggressive biologic
behavior of some canine MCTs.
While activating KIT mutations clearly contribute to
the malignant behavior of mast cells, additional cooperating or initiating genetic defects may be required for
the malignant transformation and promotion of the
Fenger et al. BMC Cancer 2014, 14:84
/>
metastatic phenotype [3]. Our data demonstrate that
overexpression of miR-9 in the C57 and P815 mouse
malignant mast cell lines and normal mouse BMMCs
significantly enhanced the invasive behavior of mast cells
and indicate that miR-9 induces a pattern of gene dysfunction associated with an invasive phenotype regardless
of KIT mutation status.
While some studies have shown that miR-9 promotes
metastasis formation [33,36-39] other contrasting studies
suggest that increased expression of miR-9 suppresses metastasis formation [40,41] and that miR-9 inhibits tumor
growth [42]. The opposing roles of miR-9 in various tissues may be explained by the expression of different
mRNA targets in distinct cellular and developmental contexts. Indeed, miRNA effects do appear to be cell type/
tissue specific and contextual in nature. Previous studies
have demonstrated that miR-9 is overexpressed in CDX2negative primary gastric cancers and miR-9 knockdown
inhibits proliferation of human gastric cancer cell lines
[43]. In contrast, miR-9 is downregulated in human ovarian tumor cells and overexpression of miR-9 suppresses
their proliferation, in part by downregulating NFκB1
[40,42]. Moreover, miRNA dysregulation may affect only
certain aspects of cell behavior. In our studies, miR-9 expression in mast cell lines did not provide a survival advantage or prevent apoptosis, but it did alter the invasive
phenotype, supporting the contextual nature of miR-9 induced effects.
To gain insight into possible mechanisms underlying
the observed miR-9-dependent invasive behavior of mast
cells, we evaluated the effects of miR-9 expression on
the transcriptional profiles of BMMCs and P815 cells.
MiR-9 modulated the expression of a large number of
gene transcripts, including down-regulation of several
putative miR-9 targets identified by computational prediction programs. Furthermore, down-regulation of peroxisome proliferator-activated receptor δ (PPARG) was
observed in BMMCs following enforced miR-9 expression, a finding consistent with recent studies demonstrating that regulation of PPARG expression is mediated
by miR-9 through direct targeting of its 3’-UTR [25]. To
draw firm conclusions regarding direct regulation of target
gene expression by miR-9, a functional approach for each
gene would be required to validate whether these genes are
true miR-9 targets, which although relevant, was outside
the scope of this study.
Overexpression of miR-9 significantly altered gene expression in both BMMCs and P815 cells, however, most
gene transcripts affected by miR-9 expression differed
between normal and malignant mast cells. These observed differences likely reflect variations in the impact
of miR-9 that are dependent on cellular context. In our
study, we identified gene transcripts that showed similar
changes in expression following miR-9 overexpression in
Page 14 of 16
both normal and malignant mast cells and validated several genes demonstrating significant changes in expression (interferon-induced transmembrane protein protein
3, IFITM3; PDZK1 interacting protein 1, PDZK1IP1) or
implicated in promoting the metastatic phenotype (mast
cell chymase, CMA1). IFITM3 belongs to a family of
interferon-induced transmembrane proteins that contribute to diverse biological processes, such as antiviral
immunity, germ cell homing and maturation, and bone
mineralization. The function of these proteins in mast
cells is currently unclear [44]. PDZK1IP1 is a small, nongycosylated membrane-associated protein that localizes
to the plasma membrane and Golgi apparatus. While the
function of PDZK1IP1 has not been evaluated in mast
cells, overexpression of PDZK1IP1 has been documented
in human ovarian, breast, and prostate carcinomas and
this strongly correlates with tumor progression [45,46].
Furthermore, overexpression of PDKZK1IP1 in melanoma
cell lines enhances cell proliferation, decreases apoptosis,
increases cell migration and is, in part, mediated by an increase in reactive oxygen species (ROS) production [47].
Chymases are serine proteases possessing chymotrypsinlike activity expressed exclusively by mast cells that
promote matrix destruction, tissue remodeling and modulation of immune responses by hydrolyzing chemokines
and cytokines [48]. Given the role of chymase in the
activation of matrix metalloproteases and extracellular
matrix degradation, our findings suggest that miR-9 enhances invasion, in part, through increased expression
chymase. Indeed, miR-9 overexpression in normal mast
cells resulted in increased expression of CMA1 with a
concomitant decrease in the expression of secretory
leukocyte peptidase inhibitor (SLPI), a direct inhibitor of
chymase [49]. These findings are consistent with the notion that that miR-9 promotes a pattern of gene expression contributing to enhanced invasion and suggests a
role for chymase in mediating the biologic functions of
miR-9.
Interestingly, miR-9 modulated the expression of other
proteases in normal mast cells, including up-regulation
of heparinase (HSPE). Heparinase is an endogylocosidase
that functions in the degradation and release of heparan
sulfate-bound growth factors [50]. Previous studies have
shown that enzymatic cleavage of heparin sulfate by
heparinase results in disassembly of the extracellular
matrix and basement membrane dissolution, inducing
structural modifications that loosen the extracellular
matrix barrier and enable cell invasion [51]. Heparinase
increases tumor invasion in both cell lines and spontaneous tumor models, through both extracellular matrix
remodeling and increased peritumoral lymphangiogenesis [52]. Our data show that normal mast cells
overexpressing miR-9 exhibit markedly increased HSPE
expression, supporting the assertion that miR-9 may
Fenger et al. BMC Cancer 2014, 14:84
/>
promote the metastatic phenotype by enhancing the
proteolytic activity of a number of proteases important
in physical remodeling of the extracellular matrix and
activate mediators responsible for cell dissemination.
The present study investigated alterations in gene
transcript expression affected by miR-9; however, these
changes were not demonstrated at the protein level.
Gene expression does not directly correlate with changes
at the protein level and miRNAs may suppress protein
expression by post-transcriptional silencing mechanisms
that are not reflected in transcriptional profiling analyses. Furthermore, inhibition of miR-9 in canine mast
cell lines would provide further convincing evidence of
its importance in mast cell invasion. As such, identifying
proteins altered by miR-9 that promote cell invasion and
validating these targets in canine cell lines/tumors represents an area of ongoing investigation.
Conclusion
In summary, the work presented here is the first to demonstrate that unique miRNA expression profiles correlate with the biological behavior of canine MCTs.
Furthermore, overexpression of miR-9 is associated with
aggressive biologic behavior of canine MCTs, possibly
through the promotion of a metastatic phenotype as
demonstrated by enhanced invasive behavior of normal
and malignant mast cells and alteration of gene expression profiles associated with cellular invasion in the presence of enforced miR-9 expression. Future work to
dissect the exact mechanisms through which miR-9 exerts the invasive phenotype is ongoing with the ultimate
goal of identifying potential druggable targets for therapeutic intervention.
Additional file
Additional file 1: Clinical patient data.
Competing interest
The authors declare no competing financial interests.
Authors’ contributions
Contribution: JF designed and performed research, analyzed data, and wrote
manuscript; MDB and BKH assisted with mBMMC and primary MCT sample
preparation; TYL generated preliminary data that led to work with miRNA
and mast cells, assisted with cBMMC and primary MCT sample preparation;
SV performed biostatistic analysis; WCK and CAL assisted in research design,
oversaw data analysis, writing and editing of paper. All authors read and
approved the final manuscript
Acknowledgements
This study was supported by a grant from the Morris Animal Foundation
(D09CA-060), The Ohio State University Targeted Investment in Excellence
(TIE) Grant, the National Cancer Institute (P03CA016058), and OSU Center for
Clinical and Translational Science (UL1TR000090). Tumor samples were
provided by The Ohio State University College of Veterinary Medicine
Biospecimen Repository.
Page 15 of 16
Author details
1
Department of Veterinary Clinical Sciences, Columbus, USA. 2Department of
Veterinary Biosciences, Columbus, USA. 3Department of Molecular Virology,
Immunology, and Medical Genetics, The Ohio State University, Columbus,
OH, USA. 4Division of Hematology and Oncology, Department of Internal
Medicine, University of California-Davis, Sacramento, CA, USA.
Received: 7 October 2013 Accepted: 27 January 2014
Published: 11 February 2014
References
1. Horny HP, Sotlar K, Valent P: Mastocytosis: state of the art. Pathobiology
2007, 27(2):121–132.
2. London CA, Seguin B: Mast cell tumors in the dog. Vet Clin North Am Small
Anim Pract 2003, 33(3):473–489.
3. Valent P, Akin C, Sperr WR, Mayerhofer M, Födinger M, Fritsche-Polanz R,
Sotlar K, Escribano L, Arock M, Horny HP, Metcalfe DD: Mastocytosis:
pathology, genetics, and current options for therapy. Leuk Lymphoma
2005, 46(1):35–48.
4. Tsujimura T, Furitsu T, Morimoto M, Isozaki K, Nomura S, Matsuzawa Y,
KITamura Y, Kanakura Y: Ligand-independent activation of c-KIT receptor
tyrosine kinase in a murine mastocytoma cell line P-815 generated by a
point mutation. Blood 1994, 83(9):2619–2626.
5. Tsujimura T, Furitsu T, Morimoto M, Kanayama Y, Nomura S, Matsuzawa Y,
KITamura Y, Kanakura Y: Substitution of an aspartic acid results in
constitutive activation of c-KIT receptor tyrosine kinase in a rat tumor
mast cell line RBL-2H3. Int Arch Allergy Immunol 1995, 106(4):377–385.
6. Downing S, Chien MB, Kass PH, Moore PE, London CA: Prevalence and
importance of internal tandem duplications in exons 11 and 12 of c-KIT
in mast cell tumors of dogs. Am J Vet Res 2002, 63(12):1718–1723.
7. Zemke D, Yamini B, Yuzbasiyan-Gurkan V: Mutations in the juxtamembrane
domain of c-KIT are associated with higher grade mast cell tumors in
dogs. Vet Pathol 2002, 39(5):529–535.
8. Letard S, Yang Y, Hanssens K, Palmérini F, Leventhal PS, Guéry S, Moussy A,
Kinet JP, Hermine O, Dubreuil P: Gain-of-function mutations in the
extracellular domain of KIT are common in canine mast cell tumors. Mol
Cancer Res 2008, 6(7):1137–1145.
9. Lin TY, London CA: A functional comparison of canine and murine bone
marrow derived cultured mast cells. Vet Immunol Immunopathol 2006,
114(3–4):320–334.
10. Leibman NF, Lana SE, Hansen RA, Powers BE, Fettman MJ, Withrow SJ,
Ogilvie GK: Identification of matrix metalloproteinases in canine
cutaneous mast cell tumors. J Vet Intern Med 2000, 14(6):583–586.
11. Giantin M, Aresu L, Benali S, Aricò A, Morello EM, Martano M, Vascellari M,
Castagnaro M, Lopparelli RM, Zancanella V, Granato A, Mutinelli F,
Dacasto M: Expression of matrix metalloproteinases, tissue inhibitors
of metalloproteinases and vascular endothelial growth factor in
canine mast cell tumours. J Comp Pathol 2012, 147(4):419–429.
12. Schlieben P, Meyer A, Weise C, Bondzio A, Einspanier R, Gruber AD,
Klopfleisch R: Differences in the proteome of high-grade versus
low-grade canine cutaneous mast cell tumours. Vet J 2012,
194(2):210–214.
13. Garzon R, Fabbri M, Cimmino A, Calin GA, Croce C: MicroRNA expression
and function in cancer. Trends Mol Med 2006, 12(12):580–587.
14. Monticelli S, Ansel KM, Xiao C, Socci ND, Krichevsky AM, Thai TH, Rajewsky N,
Marks DS, Sander C, Rajewsky K, Rao A, Kosik KS: MicroRNA profiling of the
murine hematopoietic system. Genome Biol 2005, 6(8):R71.
15. Mayoral RJ, Pipkin ME, Pachkov M, van Nimwegen E, Rao A, Monticelli S:
MicroRNA-221-222 regulate the cell cycle in mast cells. J Immunol 2009,
182(1):433–445.
16. Mayoral RJ, Deho L, Rusca N, Bartonicek N, Saini HK, Enright AJ, Monticelli S:
MiR-221 influences effector functions and actin cytoskeleton in mast
cells. PLoS One 2011, 6(10):e26133.
17. Lee YN, Brandal S, Noel P, Wentzel E, Mendell JT, McDevitt MA, Kapur R,
Carter M, Metcalfe DD, Takemoto CM: KIT signaling regulates MITF
expression through miRNAs in normal and malignant cell proliferation.
Blood 2011, 117(13):3629–3640.
18. Lin TY, Rush LJ, London CA: Generation and characterization of bone
marrow-derived cultured canine mast cells. Vet Immunol Immunopathol
2006, 113(1–2):37–52.
Fenger et al. BMC Cancer 2014, 14:84
/>
19. Tsai M, Miyamoto M, Tam SY, Wang ZS, Galli SJ: Detection of mouse mast
cell-associated protease mRNA. Heparinase treatment greatly improves
RT-PCR of tissues containing mast cell heparin. Am J Pathol 1995,
146(2):335–343.
20. Guerau-de-Arellano M, Smith KM, Godlewski J, Liu Y, Winger R, Lawler SE,
Whitacre CC, Racke MK, Lovett-Racke AE: Micro-RNA dysregulation in multiple
sclerosis favours pro-inflammatory T-cell-mediated autoimmunity. Brain 2011,
134(Pt 12):3578–3589.
21. Livak KJ, Schmittgen TD: Analysis of relative gene expression data using
real-time quantitative PCR and the 2(-Delta Delta C(T)) method. Methods
2001, 25(4):402–408.
22. Eisen MB, Spellman PT, Brown PO, Botstein D: Cluster analysis and display
of genome-wide expression patterns. Proc Natl Acad Sci USA 1998,
95(25):14863–14868.
23. Fossey SL, Liao AT, McCleese JK, Bear MD, Lin J, Li PK, Kisseberth WC,
London CA: Characterization of STAT3 activation and expression in
canine and human osteosarcoma. BMC Cancer 2009, 9:81.
24. Lin TY, Fenger J, Murahari S, Bear MD, Kulp SK, Wang D, Chen CS, Kisseberth WC,
London CA: AR-42, a novel HDAC inhibitor, exhibits biological activity against
malignant mast cell lines via down-regulation of constitutively activated KIT.
Blood 2010, 115(21):4217–4225.
25. Thulin P, Wei T, Werngren O, Cheung L, Fisher RM, Grander D, Corocran M,
Ehrenborg E: MicroRNA-9 regulates the expression of peroxisome
proliferator-activated receptor δ in human monocytes during the
inflammatory response. Int J Mol Med 2013, 31(5):1003–1010.
26. Boggs RM, Wright ZM, Stickney MJ, Porter WW, Murphy KE: MicroRNA
expression in canine mammary cancer. Mamm Genome 2008,
19(7–8):561–569.
27. Uhl E, Krimer P, Schliekelman P, Tompkins SM, Suter S: Identification of
altered microRNA expression in canine lymphoid cell lines and
cases of B- and T-cell lymphomas. Genes Chromosomes Cancer 2011,
50(11):950–967.
28. Gioia G, Mortarino M, Gelain ME, Albonico F, Ciusani E, Forno I, Marconato L,
Martini V, Comazzi S: Immunophenotype-related microRNA expression in
canine chronic lymphocytic leukemia. Vet Immunol Immunopathol 2011,
142(3–4):228–235.
29. Noguchi S, Mori T, Hoshino Y, Yamada N, Maruo K, Akao Y: MicroRNAs as
tumour suppressors in canine and human melanoma cells and as a
prognostic factor in canine melanomas. Vet Comp Oncol 2013,
11(2):113–123.
30. Noguchi S, Mori T, Hoshino Y, Yamada N, Nakagawa T, Sasaki N, Akao Y,
Maruo K: Comparative study of anti-oncogenic microRNA-145 in canine
and human malignant melanoma. J Vet Med Sci 2012, 74(1):1–8.
31. Vinall RL, Kent MS, DeVere White RW: Expression of microRNAs in urinary
bladder samples obtained from dogs with grossly normal bladders,
inflammatory bladder disease, or transitional cell carcinoma. Am J Vet Res
2012, 73(10):1626–1633.
32. Wagner S, Willenbrock S, Nolte I, Escobar HM: Comparison of non-coding
RNAs in human and canine cancer. Front Genet 2013, 4:46.
33. Ma L, Young J, Prabhala H, Pan E, Mestdagh P, Muth D, Teruya-Feldstein J,
Reinhardt F, Onder TT, Valastyan S, Westermann F, Speleman F,
Vandesompele J, Weinberg RA: MiR-9, a MYC/MYCN-activated microRNA,
regulates E-cadherin and cancer metastasis. Nat Cell Biol 2010,
12(3):247–256.
34. Gravgaard KH, Lyng MB, Laenkholm AV, Søkilde R, Nielsen BS, Litman T,
Ditzel HJ: The miRNA-200 family and miRNA-9 exhibit differential
expression in primary versus corresponding metastatic tissue in
breast cancer. Breast Cancer Res Treat 2012, 134(1):207–217.
35. Wang J, Zhao H, Tang D, Wu J, Yao G, Zhang Q: Overexpressions of
microRNA-9 and microRNA-200c in human breast cancers are
associated with lymph node metastasis. Cancer Biother Radiopharm
2013, 28(4):283–288.
36. Tan HX, Wang Q, Chen LZ, Huang XH, Chen JS, Fu XH, Cao LQ, Chen XL,
Li W, Zhang LJ: MicroRNA-9 reduces cell invasion and E-cadherin
secretion in SK-Hep-1 cells. Med Oncol 2010, 27(3):654–660.
37. Sun Z, Han Q, Zhou N, Wang S, Lu S, Bai C, Zhao RC: MicroRNA-9 enhances
migration and invasion through KLF17 in hepatocellular carcinoma. Mol
Oncol 2013, 7(5):884–894.
38. Lu MH, Huang CC, Pan MR, Chen HH, Hung WC: Prospero homeobox 1
promotes epithelial-mesenchymal transition in colon cancer cells by
inhibiting E-cadherin via miR-9. Clin Cancer Res 2012, 18(23):6416–6425.
Page 16 of 16
39. Zhu L, Chen H, Zhou D, Bai R, Zheng S, Ge W: MicroRNA-9 up-regulation is
involved in colorectal cancer metastasis via promoting cell motility. Med
Oncol 2012, 29(2):1037–1043.
40. Laios A, O’Toole S, Flavin R, Martin C, Kelly L, Ring M, Finn SP, Barrett C,
Loda M, Gleeson N, D’Arcy T, McGuinness E, Sheils O, Sheppard B,
O’ Leary J: Potential role of miR-9 and miR-223 in recurrent ovarian
cancer. Mol Cancer 2008, 7:35.
41. Zheng L, Qi T, Yang D, Qi M, Li D, Xiang X, Huang K, Tong Q:
MicroRNA-9 suppresses the proliferation, invasion and metastasis of
gastric cancer cells through targeting cyclin D1 and Ets1. PLoS One
2013, 8(1):e55719.
42. Guo LM, Pu Y, Han Z, Liu T, Li YX, Liu M, Li X, Tang H: MicroRNA-9 inhibits
ovarian cancer cell growth through regulation of NF-kappaB1. FEBS J
2009, 276(19):5537–5546.
43. Rotkrua P, Akiyama Y, Hashimoto Y, Otsubo T, Yuasa Y: MiR-9 downregulates
CDX2 expression in gastric cancer cells. Int J Cancer 2011, 129(11):2611–2620.
44. Diamond MS, Farzan M: The broad-spectrum antiviral functions of IFIT
and IFITM proteins. Nat Rev Immunol 2013, 13(1):46–57.
45. Guijarro MV, Leal JF, Fominaya J, Blanco-Aparicio C, Alonso S, Lleonart M,
Castellvi J, Ruiz L, Ramon y Cajal S, Carnero A: MAP17 overexpression
is a common characteristic of carcinomas. Carcinogenesis 2007,
28(8):1646–1652.
46. Carnero A: MAP17, a ROS-dependent oncogene. Front Oncol 2012, 2:112.
doi:10.3389/fonc.2012.00112.
47. Guijarro MV, Leal JF, Blanco-Aparicio C, Alonso S, Fominaya J, Lleonart M,
Castellvi J, Carnero A, Ramon y Cajal S: MAP17 enhances the malignant
behavior of tumor cells through ROS increase. Carcinogenesis 2007,
28(10):2096–2104.
48. Caughey GH: Mast cell tryptases and chymases in inflammation and host
defense. Immunol Rev 2007, 217:141–154.
49. He SH, Chen P, Chen HQ: Modulation of enzymatic activity of human
mast cell tryptase and chymase by protease inhibitors. Acta Pharmacol
Sin 2003, 24(9):923–929.
50. Bashkin P, Razin E, Eldor A, Vlodavsky I: Degranulating mast cells secrete
an endoglycosidase that degrades heparan sulfate in subendothelial
extracellular matrix. Blood 1990, 75(11):2204–2212.
51. Arvatz G, Shafat I, Levy-Adam F, Ilan N, Vlodavsky I: The heparanase system
and tumor metastasis: is heparanase the seed and soil? Cancer Metastasis
Rev 2011, 30:253–268.
52. Hunter KE, Palermo C, Kester JC, Simpson K, Li J-P, Tang LH, Klimstra DS,
Vlodavsky I, Joyce JA: Heparanase promotes lymphangiogenesis and
tumor invasion in pancreatic neuroendocrine tumors. Oncogene
2013:1–10. doi:10.1038/onc.2013.142.
doi:10.1186/1471-2407-14-84
Cite this article as: Fenger et al.: Overexpression of miR-9 in mast cells is
associated with invasive behavior and spontaneous metastasis. BMC Cancer
2014 14:84.
Submit your next manuscript to BioMed Central
and take full advantage of:
• Convenient online submission
• Thorough peer review
• No space constraints or color figure charges
• Immediate publication on acceptance
• Inclusion in PubMed, CAS, Scopus and Google Scholar
• Research which is freely available for redistribution
Submit your manuscript at
www.biomedcentral.com/submit