Epigenetic modulation of the drug resistance genes MGMT, ABCB1 and ABCG2 in glioblastoma multiforme
Bạn đang xem bản rút gọn của tài liệu. Xem và tải ngay bản đầy đủ của tài liệu tại đây (956.14 KB, 14 trang )
Oberstadt et al. BMC Cancer 2013, 13:617
/>
RESEARCH ARTICLE
Open Access
Epigenetic modulation of the drug resistance
genes MGMT, ABCB1 and ABCG2 in glioblastoma
multiforme
Moritz C Oberstadt1, Sandra Bien-Möller1, Kerstin Weitmann2, Susann Herzog1, Katharina Hentschel1,
Christian Rimmbach1, Silke Vogelgesang3, Ellen Balz1, Matthias Fink1, Heike Michael4, Jan-Philip Zeden4,
Henrike Bruckmüller5, Anneke N Werk5, Ingolf Cascorbi5, Wolfgang Hoffmann2, Dieter Rosskopf1,
Henry WS Schroeder4 and Heyo K Kroemer1*
Abstract
Background: Resistance of the highly aggressive glioblastoma multiforme (GBM) to drug therapy is a major clinical
problem resulting in a poor patient’s prognosis. Beside promoter methylation of the O6-methylguanine-DNAmethyltransferase (MGMT) gene the efflux transporters ABCB1 and ABCG2 have been suggested as pivotal factors
contributing to drug resistance, but the methylation of ABCB1 and ABCG2 has not been assessed before in GBM.
Methods: Therefore, we evaluated the proportion and prognostic significance of promoter methylation of MGMT,
ABCB1 and ABCG2 in 64 GBM patient samples using pyrosequencing technology. Further, the single nucleotide
polymorphisms MGMT C-56 T (rs16906252), ABCB1 C3435T (rs1045642) and ABCG2 C421A (rs2231142) were
determined using the restriction fragment length polymorphism method (RFLP). To study a correlation between
promoter methylation and gene expression, we analyzed MGMT, ABCB1 and ABCG2 expression in 20 glioblastoma
and 7 non-neoplastic brain samples.
Results: Despite a significantly increased MGMT and ABCB1 promoter methylation in GBM tissue, multivariate
regression analysis revealed no significant association between overall survival of glioblastoma patients and MGMT
or ABCB1 promoter methylation. However, a significant negative correlation between promoter methylation and
expression could be identified for MGMT but not for ABCB1 and ABCG2. Furthermore, MGMT promoter methylation
was significantly associated with the genotypes of the MGMT C-56 T polymorphism showing a higher methylation
level in the T allele bearing GBM.
Conclusions: In summary, the data of this study confirm the previous published relation of MGMT promoter
methylation and gene expression, but argue for no pivotal role of MGMT, ABCB1 and ABCG2 promoter methylation
in GBM patients’ survival.
Keywords: Glioblastoma multiforme, MGMT, Drug resistance, DNA methylation
* Correspondence:
1
Department of Pharmacology, Ernst-Moritz-Arndt-University, Greifswald,
Germany
Full list of author information is available at the end of the article
© 2013 Oberstadt et al.; licensee BioMed Central Ltd. This is an open access article distributed under the terms of the Creative
Commons Attribution License ( which permits unrestricted use, distribution, and
reproduction in any medium, provided the original work is properly cited.
Oberstadt et al. BMC Cancer 2013, 13:617
/>
Background
Glioblastoma multiforme (GBM) is still the most frequent
primary brain tumor in adults and is characterized by a
highly aggressive phenotype [1]. Despite advances in therapy, glioblastoma remains associated with poor prognosis
and an overall survival time of about 1 year [2]. A major
underlying factor is resistance to different chemotherapeutics. Several chromosomal, genetic and epigenetic alterations were identified in GBM [3], but the clinical value of
the most glioma-associated molecular aberrations remained
unclear [4]. However, a significant prognostic impact could
be shown for the O6-methylguanine-DNA-methyltransferase (MGMT). The MGMT functions as a DNA repair enzyme, which repairs alkylating lesions of the DNA by
removing mutagenic adducts from the O6 position of guanine, e.g. caused by the chemotherapeutic agent temozolomide [5]. Hence, it confers drug resistance and the
therapeutic response to alkylating agents is improved in
tumor cells expressing low levels of MGMT [5]. Furthermore, MGMT promoter methylation was demonstrated to
result in decreased MGMT expression and correlates with
a survival benefit in glioblastoma patients treated with alkylating chemotherapeutics such as temozolomide [6].
Expression and activity of the efflux transporters ABCB1
and ABCG2 have also been suggested as pivotal factors
contributing to drug resistance by increasing the efflux of
chemotherapeutic compounds in the setting termed “multidrug resistance”. These ATP-binding cassette transporters (ABC transporters) belong to a superfamily of
membrane pumps that use ATP hydrolysis to efflux various endogenous compounds and drugs outside the cell.
ABCB1 was shown to be expressed both in low-grade glioma and high-grade glioma such as glioblastoma [7] and
ABCG2 was found to be expressed in glioma stem cells as
well as in endothelial cells of the large vessels of glioma
tissue [5]. For both ABCB1 and ABCG2 an inverse correlation between the methylation status of Cytidine phosphate Guanosine (CpG) sites at the promoter region
and the transporter expression was demonstrated [8,9].
Furthermore, ABCB1 promoter methylation is associated
with the ABCB1 C3435T polymorphism which again influences the ABCB1 expression [10]. Similarly, for ABCG2
an association of the ABCG2 C421A polymorphism with
both the transport function and expression of the efflux
transporter was shown [11,12].
ABCB1 and ABCG2 promoter methylation have not
been assessed in glioblastoma patients before. We therefore investigated promoter methylation of ABCB1 and
ABCG2 in 64 glioblastoma patients using the pyrosequencing technology, which allows unequivocal quantification of the methylation status, and used MGMT
promoter methylation as positive control.
In our study we found a significantly increased MGMT
and ABCB1 promoter methylation in GBM tissue but
Page 2 of 14
couldn’t demonstrate any association of MGMT, ABCB1
or ABCG2 promoter methylation with overall survival of
glioblastoma patients in multivariate Cox models adjusted
for potential risk factors (gender and age) and stratified on
the variable therapy (temozolomide vs. no temozolomide).
However, we found a significant negative correlation
between MGMT promoter methylation and MGMT expression and a significant association between MGMT
methylation and the MGMT C-56 T polymorphism.
Methods
Patient samples
Malignant glioblastoma samples (n = 64) were obtained
from patients who had undergone tumor resection at
the Clinic of Neurosurgery of the University of Greifswald,
Germany. Tumor samples were collected between 2003
and 2009 from patients with newly diagnosed glioblastoma who had received no antitumoral therapy before
sample collection. Additionally, relapses of 17 of these
patients were collected. For investigation of methylation
status, fresh frozen human glioblastoma tissue samples
(n = 4) and paraffin-embedded glioblastoma sections
(n = 60) were analyzed by pyrosequencing, which is described as a highly reproducible method for quantification
of MGMT methylation in both formalin-fixed paraffinembedded and fresh frozen samples [13,14]. Samples from
11 of the 64 GBM patients have been available for mRNA
expression analysis and 9 further GBMs have been added
to investigate the mRNA expression in a total of 20 GBM
patients.
All tumor samples were histologically classified by a
neuropathologist at the Department of Pathology of the
University of Greifswald according to the WHO criteria
of tumors of the nervous system using formalin-fixed,
paraffin-embedded specimens. Clinico-pathological features of the analyzed patients are summarized in
Table 1. All investigations described in this study were
approved by the Ethics Committee of the University of
Greifswald, Germany.
DNA Isolation
Genomic DNA (gDNA) was isolated from fresh frozen
tumor samples or formalin-fixed, paraffin-embedded
glioblastoma sections using the NucleoSpin® Tissue Kit
(Macherey-Nagel, Düren, Germany) according to the
manufacturer’s instructions. 2–5 slices à 5 μm of the
formalin-fixed, paraffin-embedded glioma tissue sections
were used per sample. Concentrations of the isolated
genomic DNA were determined using a NanoDrop 1000
Spectrophotometer (PEQLAB, Erlangen, Germany).
Bisulfite Treatment and PCR Amplification
For evaluation of the promoter methylation status of
MGMT, ABCB1 and ABCG2 1800 ng of the isolated
Oberstadt et al. BMC Cancer 2013, 13:617
/>
Page 3 of 14
Table 1 Clinico-pathological features of the analyzed patients
Characteristic
Age [Years]
Median age at diagnosis
61.6
Range [Min.-Max.]
40.2 - 79.9
Patients with temozolomide therapy
Median age at diagnosis
59.2
Patients without temozolomide therapy
Median age at diagnosis
Characteristic
64.0
Number of patients
% of patients
<50 years
11
17.2
50 - 60 years
18
28.1
60 - 70 years
20
31.3
>70 years
15
23.4
Male
39
60.9
Female
25
39.1
Age classes
Sex
Pathohistology
Glioblastoma multiforme
64
Relapses of primary glioblastoma multiforme
17
Therapy
Only Radiotherapy
11
17.2
Radiotherapy and temozolomide
45
70.3
No adjuvant therapy
6
9.4
No therapy data applicable
2
3.1
Overall survival (OS)
Median [Days]
459
Range [Min.-Max.]
34 - 1954
1-year survival
38
59.4
2-year survival
9
14.1
OS of patients with temozolomide therapy
Median [Days]
515
Range [Min.-Max.]
95 - 1954
OS of patients without temozolomide therapy
Median [Days]
87
Range [Min.-Max.]
34 - 701
Vital status at study end (30.06.2009)
Dead
47
73.4
Alive
17
26.6
gDNA per sample were bisulfite treated using the
EpiTect® Bisulfite Kit (Qiagen, Hilden, Germany) following the manufacturer’s instructions. The bisulfite treated
DNA was subjected to PCR amplification of the specific
promoter regions of MGMT, ABCB1 and ABCG2 gene
by the use of primer sets designed to amplify sequences
containing CpG sites to be investigated (Table 2). The
detailed conditions for the PCR amplification of the promoter region of interest are summarized in the Additional
file 1 with the Figures S1-S3.
Pyrosequencing for promoter methylation analysis
Pyrosequencing analysis was performed on the PSQ™
96MA System (Biotage, Uppsala, Sweden). Methylation
Oberstadt et al. BMC Cancer 2013, 13:617
/>
Page 4 of 14
Table 2 Primer sequences used for methylation analysis
Gene symbol
GenBank accession
Forward primer 5′- > 3′
Reverse primer 5′- > 3′
Sequencing primer 5′- > 3′
Amplicon size (bp)
MGMT
X61657.1
YGYGTTTYGGATATGTT
GGGATAG
Biotin -AACRAAA CRACC
CAAACACTCA
GGATAGTTYGYGTTTTTAGA
115
ABCB1
AH002875.1
GTGGGTGGGAGGAAGTAT
Biotin -AAATCTC CAACATC
TCCAC
GGGTAAAGTTTAGAA
125
ABCG2
AH011213.2
TGATTGGGTAATTTGTGTG
TTAGTG
Biotin -AAATAAA CCAAAAT
AATTA ACTAC
TTGTGATTGGGTAATTTGTG
147
of target CpGs was assessed by determining the ratio of
cytosine to thymine incorporated during pyrosequencing. Cytosine incorporation indicated a methylated
CpG and thymine incorporation an unmethylated CpG.
Quantification of the methylation status was performed
using the provided software from PSQ™ 96MA System
(Biotage, Uppsala, Sweden).
Five CpG methylation sites were investigated for
MGMT promoter methylation, two for ABCB1 promoter
methylation and three for ABCG2 promoter methylation.
The average percentage methylation of the different
CpG sites of each gene promoter was calculated and
used in all analyses. During the establishing process of
the methylation assays, the analytical sensitivity and
quantitative accuracy of the three methylation assays
have been assessed. We correlated the methylation results for the first CpG site of ABCB1 (Additional file 1:
Table S1A), ABCG2 (Additional file 1: Table S1B) and
MGMT (Additional file 1: Table S1C) methylation assays of three independent measurements. These same
19 samples measured in triplicates determined a high
quantitative accuracy of the assays with high significant
(*** p < 0.001) Spearman correlation coefficients between 0.88 and 0.99 (Additional file 1: Tables S1A-C).
Methylation-specific PCR (MSP)
1.8 μg DNA has been bisulfite-converted using the
EpiTect® Bisulfite Kit (Qiagen, Hilden, Germany). 2 μl of
the bisulfite-converted DNA was amplified in a PCR
consisting of 20 pmol of primers (Eurofins MWG Operon,
Ebersberg, Germany), 1.25 mM MgCl2, 10x Reaction
buffer, 1.5 units Taq-Polymerase and 200 μM dNTPs
(all Invitrogen, Karlsruhe, Germany). The thermal cycling conditions used were as follows: 95°C for 10 min,
and 40 cycles of 95°C for 45 sec, 52°C for 50 sec, 72°C
for 1 min with a final extension of 72°C for 10 min.
Two μl of the amplified first-round product was used
for second round of amplification with 20 pmol of
primers (Eurofins MWG Operon, Ebersberg, Germany),
1.25 mM MgCl2, 10x Reaction buffer, 1.5 units TaqPolymerase and 200 μM dNTPs (all Invitrogen, Karlsruhe,
Germany). The following thermal cycling conditions were
followed: 95°C for 10 min, and 20 cycles of 95°C for
45 sec, 65°C for 25 sec, 72°C for 30 sec with a final
extension of 72°C for 10 min. The amplified products
were run on a 2% agarose gel with an expected size of
81 bp for methylated product and 93 bp for an unmethylated product.
We analyzed the agarose gel bands using the KODAK
Gel Logic 200 Imaging System (Eastman Kodak Company, Rochester, NY, USA) (Additional file 1: Figure S8).
Our corresponding pyrosequencing results for MGMT
are included in Additional file 1: Table S2. To validate
the performance of the MSP conditions chosen, methylated and unmethylated standard samples provided from
the EpiTect PCR Control Set (Qiagen, Hilden, Germany)
have been used as controls which showed the expected
bands only in either the methylated or unmethylated
PCR (Additional file 1: Figure S8). However, beside
U87MG glioblastoma cells as a methylated reference
[15] and LN18 glioblastoma cells, we chose a spectrum
of differently methylated GBM samples of the pyrosequencing analysis: two strong, two middle and two
unmethylated GBM samples for assay comparison. Even
though it is difficult to directly compare the qualitative
method of MSP with the quantitative method of pyrosequencing, it is still visible, that those three glioblastoma
samples (GBM1, GBM3, and GBM6) with the most intensive methylated bands in MSP show in addition to
U87MG cells the three highest methylation percentages
in the pyrosequencing analysis (28.2%, 61.21%, and
74.74%), indicating more or less comparable results of
both methylation detection methods.
Quantitative Real-Time PCR
Total RNA was isolated from 20 human fresh frozen
glioblastoma samples and 7 normal brain tissue samples
(frontal/temporal lobes) using the PeqGold RNAPure™
reagent protocol (Peqlab Biotechnologie, Erlangen,
Germany), which allows (based on the guanidinisothiocyanat) the dissociation of cells and inactivation of
RNases and other enzymes at the same time. The provider of RNAPure guarantees optimal purity and high
rates of yields of non-degraded RNA. Subsequently,
RNA was measured photometrically at the wavelength
of 260 nm using the Nano Drop™ 1000 Spectrophotometer from PEQLAB (Erlangen) to get information about
the purity. 1 μl of each sample was applied. Beside the
Oberstadt et al. BMC Cancer 2013, 13:617
/>
concentration of the RNA, indicated in μg/μl, the purity
ratios 260/280 and 260/230 were determined. It was
proven, that the purity ratio (260/280) of our samples
accounts for 1.8 to 2.0 (2.2 for the ratio 260/230).
RNA was further always placed on ice to avoid degradation and long-time storing of the RNA was performed
at −80°C.
500 ng of total RNA were used for cDNA synthesis with
the High Capacity cDNA Reverse Transcription Kit (Applied Biosystems, Foster City, CA) in a 20 μl reaction volume. Real-time PCR was performed with 10 ng final
concentration of cDNA using the ABI Prism 7900 Sequence Detection System (Applied Biosystems, Foster City,
CA). cDNA was amplified using Assays on Demand for
MGMT (Hs01037698_m1), ABCB1 (Hs00184491_m1), and
ABCG2 (Hs01053790_m1), all conjugated with fluorochrome 5-carboxyfluorescein (FAM), and 18S rRNA (Predeveloped TaqMan Assay Reagent, catalog no.: 4319413E,
Applied Biosystems, Foster City, CA) conjugated with
fluorochrome VIC (Applied Biosystems). Applied Biosystems guarantee maximum and equivalent amplification
efficiency as well as specificity of all TaqMan® Assayson-Demand Gene Expression Products (Application
Note, Applied Biosystems: Amplification Efficiency of
TaqMan® Assays-On-Demand™ Gene Expression Products).
Further, only assays with exon junction spanning probes
were selected in order to avoid amplification of contaminating genomic DNA. The analysis of the amplification efficiencies of our used PCR assays by measuring a serial
dilution of selected cDNA showed a PCR efficiency of
about 90% for all assays (Additional file 1: Figure S4A-F)
allowing us to analyze the expression of our target genes
by the ΔΔCT-method. Thus, quantification was performed
with the comparative ΔΔCT-method. For the analysis of the
quantitative RT-PCRs using the delta Ct-method we set the
expression value of each GBM sample against the mean expression value of all analyzed control brain samples. Thus,
the target gene expression in the GBM samples represents
a multiple of the target expression in the control brain.
In addition to 18S rRNA we further analyzed the gene
expression of TBP and GAPDH to validate their suitability as housekeeping genes in our samples. Using commercially available GAPDH and TBP assays (Applied
Biosystems), we determined a similar distribution of
values in 10 non-malignant brains, 97 GBM samples and
21 astrocytomas validating the expression measurements
of MGMT, ABCB1 and ABCG2 based on normalization
to the 18S rRNA content of our samples, as seen in the
Additional file 1: Figure S7.
Analysis of genetic variants
All patients were screened for MGMT C-56 T
(rs16906252), ABCB1 C3435T (rs1045642) and ABCG2
C421A (rs2231142) gene polymorphisms using the
Page 5 of 14
polymerase chain reaction-restriction fragment length
polymorphism (PCR-RFLP) method using the primers
listed in Table 3. The detailed conditions for PCR-RFLP
are described in the Additional file 1.
mRNA expression of the markers CD133, GFAP and
PECAM in glioblastoma samples
To assess the content of tumor cells and endothelial
cells we decided to measure GFAP as a marker of astrocytic cells, CD133 as marker for glioblastoma stem-like
cells and PECAM (CD31) as endothelial marker in
the glioblastoma and non-malignant brain tissue. The
CD133, GFAP and PECAM expression in non-malignant
brain, glioblastomas (GBM) and the glioblastoma cell
line LN18 is shown in Additional file 1: Figure S6.1. The
expression of CD133 is significantly elevated in GBMs
compared to non-malignant brain samples, showing that
glioma stem-like cells are probably more common in the
tumors than in healthy brain. These findings support
that most of the cells analysed in our GBM samples represent tumor cells [16]. Besides, GFAP and PECAM expression greatly vary between the glioblastoma samples,
but are not significantly different to the non-malignant
brain, indicating a similar number of astrocytes and
especially endothelial cells in the tumor tissue. Thus,
our findings of an altered methylation status in GBM
compared to non-malignant brain are mostly based on
tumor cells instead of endothelial cells.
Furthermore, we correlated the expression data of
GFAP, CD133 and PECAM with MGMT, ABCB1 or
ABCG2 expression. MGMT, ABCB1 and ABCG2 did
not significantly correlate with either GFAP, CD133 or
PECAM gene expression (Additional file 1: Figures S6.2,
S6.3 and S6.4) except the slight, but significant correlation of ABCG2 and PECAM (Spearman’s r = 0.494,
p = 0.037, Additional file 1: Figure S6.4C), which may be
due to the known localization of ABCG2 in endothelial
cells of the blood–brain and the blood-tumor barrier.
Nevertheless, an exact comparison to or quantification
of the tumor cell content in relation to other cell types
in the glioblastoma tissue does not seem possible since
each individual tumor cell can hold a different pattern of
gene expression and thus our expression analysis gives
an insight into the tumor in its entirety but not into the
individual cells that form the whole tumor mass.
Statistical analysis
Methylation data were analyzed using the statistical programs SAS V 9.1 (SAS Institute Inc., Cary, NC, USA)
and STATA (Intercooled Stata/SE 10.1). Frequencies
were calculated for categorical data. Metric data were
described using median and interquartile range as well
as minimum and maximum values. Spearman correlation, Mann Whitney U test (comparison of two
Oberstadt et al. BMC Cancer 2013, 13:617
/>
Page 6 of 14
Table 3 Primer sequences used for genotyping
Gene symbol
GenBank accession
Forward primer 5′- > 3′
Reverse primer 5′- > 3′
Amplicon size (bp)
MGMT
X61657.1
CTAGAACGCTTTGCGTCCCGAC
CAACACCTGGGAGGCACTTG
231
ABCB1
AH002875.1
TGTTTTCAGCTGCTTGATGG
AAGGCATGTATGTTGGCCTC
197
ABCG2
AH011213.2
TGTTGTGATGGGCACTCTGATG
ATCAGAGTCATTTTATCCACAC
222
groups), Kruskal Wallis test (comparison of > 2 groups)
and Fisher’s exact test were used for bivariate comparisons. A p-value of <0.05 was considered to indicate statistical significance. The multivariate Cox proportional
hazard regression analysis was used to examine the association between the patient’s overall survival and mean
methylation of ABCB1, ABCG2 and MGMT, respectively, adjusted for potential risk factors including gender
and age at diagnosis.
The duration of a patient’s overall survival (OS) was
defined as the time from the first tumor detection until
death or the end of the study (30.6.2009). Patients who
were alive at the end of the study were included as censored data into the model. The variable “therapy” (with
temozolomide vs. without temozolomide) did not fulfil
the assumptions of proportionality and was excluded
from the a priori defined model. This variable was used
as strata variable instead. All predictors were dummy
coded. Hazard ratios and 95% confidence intervals were
estimated. In a sensitivity analysis we included (1.) mean
percentage of methylation over the respective methylation sites as continuous variable and (2.) every single
methylation site separately as continuous variable into
the model. Furthermore two different Cox models were
analyzed for patients treated with or without temozolomide, respectively.
Results
Clinico-pathological features of the analyzed patients
The study population comprised 64 patients with glioblastoma multiforme WHO°IV (GBM). For the correlation of the methylation degrees between primary
tumors and relapses, 17 relapses of primary glioblastoma
multiforme WHO °IV tumors were analyzed in comparison to the respective primary tumor.
Clinico-pathological features of all analyzed patients
are summarized in Table 1. The therapy regime was in
accordance to the current recommendations for the
respective tumor entity. 17.2% (11 GBM) of patients
were treated with only radiotherapy, 70.3% (45 GBM)
were treated with radiotherapy and temozolomide, 9.4%
(6 GBM) got no adjuvant treatment and for 3.1%
(2 GBM) data of therapy modalities are missing. The
median OS for all patients was 459 days (Min. 34 days,
Max. 1954 days). The median OS for patients treated
with temozolomide as part of their therapy was 515 days
(Min. 95 days, Max. 1954 days), while the median age
for patients not treated with temozolomide was 87 days
(Min. 34 days, Max. 701 days). This difference in median
OS between patients treated with (515 days) versus
without temozolomide (87 days) was statistically highly
significant in a bivariate analysis (p < 0.01).
Methylation status, expression level and overall survival
of glioblastoma patients
Several studies predict MGMT promoter methylation as
an important prognostic factor for clinical outcome of
glioblastoma patients treated with temozolomide [6,17].
Therefore, we analyzed five CpG sites in the MGMT
promoter, of which four CpG sites have been already investigated in a previous cutting-edge publication in the
field [18]. Because MGMT methylation was suggested as
a pivotal prognostic factor for OS of glioma patients
who were treated with temozolomide [6,17], we established Cox models for all glioblastoma patients, patients
treated with temozolomide as well as patients without
temozolomide application, respectively. Continuous Cox
models for the entire glioblastoma patient cohort (with
and without temozolomide treated patients together),
for the patients treated with temozolomide and for the
patients treated without temozolomide did not show any
significant overall survival difference dependent on the
MGMT methylation level (Table 4). Also Dunn and
colleagues used for their studies the method of pyrosequencing, but showed MGMT methylation as an independent prognostic factor associated with prolonged
OS [19]. Thus, we analyzed the association of MGMT
methylation and OS by dividing the MGMT methylation
levels in the subgroups according to Dunn and
colleagues by using our cut-off of 5.72% (mean normal
brain ± 2 s.d.; first group: methylation level >5.72% - <20%;
second group: methylation level >20% - <35%; third group:
methylation level >35%, Additional file 1: Figure S5) [19].
However, this analysis displayed no significant difference
in OS between the subgroups as well (Kruskal Wallis test,
p = 0.9948). Because it is known, that MGMT methylation
and expression are tightly linked [20] in the way that
MGMT methylation leads to loss of MGMT expression
[21], we analyzed this association in a subgroup of 20
GBM patients for which MGMT expression levels have
been available. A significant negative correlation between
MGMT methylation and expression could be identified
(Spearman’s rank correlation coefficient: -0.474; p = 0.035;
Figure 1A), indicating the downregulation of MGMT
Oberstadt et al. BMC Cancer 2013, 13:617
/>
Page 7 of 14
Table 4 Multivariate analysis of MGMT promoter
methylation and its association with the overall survival
of GBM patients
Variable
Haz. ratio
p-value
[95% Conf. Interval]
male
1.488
0.238
0.769
(ref. female)
1.259
0.602
0.530
2.992
1.724
0.393
0.494
6.024
50- < 60 years
1.734
0.299
0.613
4.903
(ref. <50 years)
1.648
0.394
0.523
5.192
1.183
0.916
0.053
26.577
60- < 70 years
2.567
0.057
0.972
6.780
(ref. <50 years)
3.242
0.039
1.061
9.901
1.417
0.757
0.156
12.826
≥70 years
6.427
0.001
2.194
18.824
(ref. <50 years)
10.700
0.000
2.998
38.191
2.442
0.445
0.247
24.152
Sex
2.876
Age
Age
Age
Mean methylation
0.988
0.315
0.964
1.012
level (continuous)
0.975
0.121
0.945
1.007
1.023
0.403
0.970
1.078
Continuous multivariate Cox model regression analysis of MGMT promoter
methylation and its association with the overall survival (OS) of the analyzed
patients with glioblastoma multiforme, adjusted for potential risk factors
including sex and age at diagnosis and stratified on the variable therapy.
Normal typed data: the entire glioblastoma cohort; Italic data:
Temozolomide treated glioblastoma patients; Bold face data: Glioblastoma
patients without temozolomide treatment (Haz. Ratio, Hazard Ratio; Conf.
Interval, Confidence Interval).
expression by methylation [21]. Furthermore, a highly significant elevated MGMT methylation has been detected
for 64 GBM patient samples compared to 7 healthy brain
samples (Mann Whitney test p < 0.001; Figure 1B).
Since ABCB1 represents a multidrug resistance factor
in several malignancies, including glioma [7], we additionally investigated the influence of ABCB1 promoter
methylation on patients’ outcome by using a new established pyrosequencing assay to detect the methylation
degree in the ABCB1 promoter. The analysis of the
methylation status involved two CpG sites located in the
CpG island of the ABCB1 promoter and showed a broad
interindividual range in the methylation level in our patient cohort with a median of 27.3% (minimum 1.3%,
maximum 85.4%). To investigate whether both CpG
sites of the ABCB1 promoter for each person are methylated in the same extent, correlation analysis was performed demonstrating a high correlation of methylation
of the two investigated CpG sites (Spearman’s rank correlation coefficient: 0.782, p-value <0.001).
In relation to the OS of all glioblastoma patients and
patients treated with temozolomide no significant association of the ABCB1 methylation status could be
detected in a continuous, multivariate Cox model
(Table 5). In a cohort of 20 GBM patients, for which
ABCB1 expression levels have been available, also no
significant correlation between ABCB1 methylation and
expression has been detected (Spearman’s rank correlation coefficient: 0.242, p = 0.304; Figure 1C). However,
the ABCB1 methylation measured in 64 GBM patients
was significantly higher than in the controls (Mann
Whitney test p = 0.007; Figure 1D), suggesting a different epigenetic regulation in glioblastomas than in
healthy brain.
A further resistance factor suggested to be relevant in
glioma is the efflux transporter ABCG2 [5]. For determination of the ABCG2 promoter methylation a novel
pyrosequencing assay was established by our group to
analyze three CpG sites that have been previously determined in other tumor entities using methylation specific
quantitative PCR and bisulfite genomic sequencing
[22,23]. The median ABCG2 promoter methylation status was 30.28% with a broad interindividual range (Min.
3.63%, Max. 83.57%). But for each patient the three investigated ABCG2 CpG sites show a very high correlation in their methylation degree: CpG site 1 and site 2
with a Spearman’s rank correlation coefficient of 0.972
(p-value <0.0001), CpG site 1 and site 3 with a Spearman’s
rank correlation coefficient of 0.953 (p-value <0.0001) and
CpG site 2 and site 3 with a Spearman’s rank correlation
coefficient of 0.970 (p-value <0.0001).
In continuous multivariate Cox models for all glioblastoma patients (patients treated with and without
temozolomide) no trend for a survival benefit has been
detected (Table 6). Furthermore, no correlation of
ABCG2 methylation and expression could be identified
in a group of 20 GBM patients (Spearman’s rank correlation coefficient: -0.170, p = 0.474; Figure 1E) and no
significant difference in ABCG2 methylation of GBMs
and normal brain has been measured (Mann Whitney
test p = 0.051; Figure 1F).
As expected, through all multivariate analyses for both
the entire glioblastoma cohort and patients treated with
temozolomide a significant worse OS for older patients
could be identified.
Association of the promoter methylation degree with the
analyzed Single Nucleotide Polymorphisms (SNPs)
Because of a strong association with the MGMT methylation in glioblastoma [24] and further tumors like colorectal carcinoma [25,26], pleural mesothelioma [27], and lung
cancer [28], the MGMT C-56 T polymorphism was included in our study. The frequency of the MGMT -56C
and -56 T allele was 87.5% and 12.5% in our cohort,
Oberstadt et al. BMC Cancer 2013, 13:617
/>
Page 8 of 14
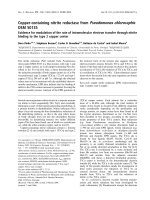
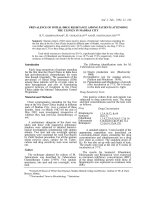
Figure 1 Correlation analyses between MGMT, ABCB1 and ABCG2 mRNA expression and mean promoter methylation as well as
comparison of MGMT, ABCB1 and ABCG2 promoter methylation between glioblastoma and non-malignant brain samples. Correlation
analysis of mRNA expression [2-ΔΔCT] and promoter methylation [%] was performed for 20 GBM specimens (A, C, E). Comparison of MGMT
promoter methylation [%] between 64 GBM and 7 non-malignant brain specimens (B, D, F) (A) Correlation of MGMT mRNA expression and
MGMT promoter methylation (Spearman’s rank correlation coefficient: -0.474; p = 0.035), (C) ABCB1 mRNA expression and ABCB1 promoter
methylation (Spearman’s rank correlation coefficient: 0.242, p = 0.304), and (E) ABCG2 mRNA expression and ABCG2 promoter methylation
(Spearman’s rank correlation coefficient: -0.170, p = 0.474). (B) Comparison of MGMT promoter methylation between GBM and non-malignant
brain specimens (Mann–Whitney U test, p < 0.001), (D) ABCB1 promoter methylation between GBM and non-malignant brain samples (Mann–Whitney
U test, p = 0.007), and (F) ABCG2 promoter methylation between GBM and non-malignant brain specimens (Mann–Whitney U test, p = 0.051).
respectively, and its distribution was in Hardy-Weinberg
equilibrium (p = 0.521). As hypothesized the MGMT promoter methylation degree of the analyzed glioblastoma
samples was significantly correlated with the genotypes of
the MGMT C-56 T polymorphism (Figure 2A; Wilcoxon
test, p-value = 0.02), showing a higher methylation level in
patients with the T allele.
Regarding the analyzed ABCG2 SNP the frequency of
the ABCG2 421C and 421A allele was 89% and 11%,
respectively, which is in Hardy-Weinberg equilibrium
(p = 0.957) and the frequencies of the ABCB1 alleles
3435C and 3435 T were 38% and 62% in our patient
population, respectively, being in Hardy-Weinberg
equilibrium with a borderline p-value (p = 0.0503), too.
Though the transport function and expression of
ABCG2 is known to be influenced by the ABCG2 C421A
polymorphism [11,12] and the C3435T polymorphism in
exon 26 seems to modulate the expression of ABCB1
Oberstadt et al. BMC Cancer 2013, 13:617
/>
Page 9 of 14
Table 5 Multivariate analysis of ABCB1 promoter
methylation and its association with the overall survival
of GBM patients
Table 6 Multivariate analysis of ABCG2 promoter
methylation and its association with the overall survival
of GBM patients
Variable
Variable
Haz. ratio
p-value
[95% Conf. Interval]
male
1.457
0.276
0.740
(ref. female)
1.130
0.793
4.222
0.043
50- < 60 years
1.793
0.282
0.619
5.191
(ref. <50 years)
1.500
0.490
0.474
4.742
5.358
0.234
0.338
84.863
60- < 70 years
2.474
0.066
0.942
6.499
(ref. <50 years)
2.235
0.140
0.768
6.507
3.596
0.290
0.336
38.441
≥70 years
6.069
0.001
2.107
17.479
(ref. <50 years)
9.872
0.000
2.786
34.988
5.112
0.167
0.505
51.721
0.995
0.461
0.981
1.009
Sex
p-value
[95% Conf. Interval]
Sex
2.866
male
1.463
0.271
0.743
2.879
0.454
2.813
(ref. female)
1.092
0.842
0.459
2.600
1.045
17.060
2.489
0.211
0.596
10.389
50- < 60 years
1.745
0.317
0.586
5.195
(ref. <50 years)
1.454
0.545
0.433
4.882
1.552
0.760
0.092
26.033
60- < 70 years
2.270
0.085
0.892
5.778
(ref. <50 years)
2.271
0.118
0.811
6.358
1.068
0.957
0.102
11.210
≥70 years
6.112
0.001
2.087
17.903
(ref. <50 years)
9.923
0.000
2.808
35.062
2.774
0.376
0.290
26.572
1.003
0.736
0.986
1.021
Age
Age
Age
Age
Age
Mean methylation
level (continuous)
Haz. ratio
Age
Mean methylation
level (Continuous)
1.002
0.864
0.984
1.020
0.998
0.836
0.977
1.019
0.973
0.032
0.950
0.998
1.018
0.430
0.974
1.065
Continuous multivariate Cox model regression analysis of ABCB1 promoter
methylation and its association with the overall survival (OS) of the analyzed
patients with glioblastoma multiforme, adjusted for potential risk factors
including sex and age at diagnosis and stratified on the variable therapy.
Normal typed data: the entire glioblastoma cohort; Italic data:
Temozolomide treated glioblastoma patients; Bold face data: Glioblastoma
patients without temozolomide treatment (Haz. Ratio, Hazard Ratio; Conf.
Interval, Confidence Interval).
Continuous multivariate Cox model regression analysis of ABCG2 promoter
methylation and its association with the overall survival (OS) of the analyzed
patients with glioblastoma multiforme, adjusted for potential risk factors
including sex and age at diagnosis and stratified on the variable therapy.
Normal typed data: the entire glioblastoma cohort; Italic data:
Temozolomide treated glioblastoma patients; Bold face data: Glioblastoma
patients without temozolomide treatment (Haz. Ratio, Hazard Ratio; Conf.
Interval, Confidence Interval).
[29], we could not determine an association between the
different genotypes of the ABCG2 C421A polymorphism
and the ABCG2 promoter methylation (Figure 2C) or
for the ABCB1 methylation status and the ABCB1
C3435T polymorphism (Figure 2B).
p-value = 0.09; Figure 3A), for the ABCB1 methylation
status a correlation between primary tumors and relapses was not evident (Figure 3B).
Correlation of the methylation degrees between primary
tumor and relapse
Using bivariate analyses, no significant association with
the age at diagnosis or the gender has been detected for
MGMT methylation, ABCG2 methylation or ABCB1
methylation (data not shown).
To compare the consistency of the methylation degrees
before and after treatment, the promoter methylation
has been analyzed in 17 primary tumors and relapses of
the same patients. The mean ABCG2 methylation degree
of the primary tumors was significantly correlated to the
relapses of the respective patients (Spearman’s rank correlation coefficient: 0.804, p-value <0.001; Figure 3C) indicating a stable ABCG2 promoter methylation level
before and after treatment. While the mean MGMT
methylation degree of the primary tumors showed at
least a trend to be correlated to the relapses of the same
patients (Spearman’s rank correlation coefficient: 0.42,
Relationship of the promoter methylation degree with
the age at diagnosis and the gender
Discussion
Understanding molecular factors relevant for drug resistance of glioblastoma multiforme is pivotal for the development of personalized therapeutic approaches to this
highly aggressive tumor. In several studies the role of
MGMT methylation as molecular marker for overall survival of glioma patients treated with alkylating agents is
discussed [6,17,30,31]. Beside MGMT, the drug efflux
transporters ABCB1 and ABCG2 are thought to affect
Oberstadt et al. BMC Cancer 2013, 13:617
/>
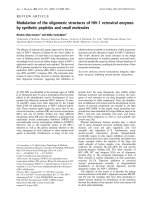
Figure 2 Relation between MGMT, ABCG2 or ABCB1 promoter
methylation and selected SNPs. (A) Bivariate analysis of the
association between the MGMT promoter methylation and the
MGMT C-56 T polymorphism (Wilcoxon test, p = 0.02). (B) Bivariate
analysis of the association between the ABCG2 promoter
methylation and the ABCG2 C421A polymorphism (Kruskal-Wallis
test, p = 0.30). (C) Bivariate analysis of the association between the
ABCB1 promoter methylation and the ABCB1 C3435T polymorphism
(Kruskal-Wallis test, p = 0.63).
Page 10 of 14
survival of glioma patients due to their role in drug resistance [32,33]. In particular, temozolomide-mediated
cytotoxicity is modulated by ABCB1 expression [34].
However, in contrast to MGMT methylation no data
have existed for ABCB1 and ABCG2 promoter methylation in glioblastoma tissue until now. Thus, we focused
on establishing new pyrosequencing assays for the analysis of the methylation status of the ABCB1 and the
ABCG2 promoter in a collective of 64 glioblastoma patients using MGMT promoter methylation as reference.
Methylation status was analyzed using pyrosequencing
because it allows a highly reproducible quantification of
the methylation degree at each individual CpG site and
enables rapid parallel processing of a large number of
samples [13]. A pivotal role plays the design of the
sequencing primer and the pyrosequencing program
to minimize the risk of assaying DNA that was not
fully converted during bisulfite treatment [13]. However,
because pyrosequencing is based on a PCR, which
amplifies the bisulfite treated DNA across different
epialleles, and the pyrosequencing displays DNA methylation as an average methylation level at each individual
CpG position, it is not possible to provide methylation
information on an epiallelic level. Thus, results of pyrosequencing should always be interpreted with caution
regarding an epiallelic influence.
Compared to pyrosequencing MSP is susceptible to
false-positive and false-negative results because of mosaic methylation patterns with variable grade of methylation at the primer positions [13], especially when nested
primers are used for clinical samples with small amounts
of poor quality DNA like FFPE samples [13,35], which
represented the largest proportion of analyzed GBM
samples in this study. In addition, Dunn and colleagues
described pyrosequencing as suitable method for FFPE
samples [19] as well as our fourth tested CpG site of
MGMT promoter has been shown as prognostic relevant, while MSP and SQ-MSP for MGMT methylation
detection have not been in a Cox model of a recent
study [14] and authors recommended pyrosequencing
for MGMT methylation analyses in high-throughput
settings [36].
In general, in previous studies the role of MGMT
methylation as molecular marker for overall survival of
glioblastoma patients is highly discussed between authors who detected [6,17] or did not find an impact on
overall survival [30,31]. We also investigated the previously by Esteller and colleagues published predicting
CpG sites [18] but we could not determine a significantly different overall survival of GBM patients (with or
without temozolomide treatment) in dependence on
their MGMT promoter methylation status. Because this
result is contradictory to prior publications about
MGMT methylation as an independent prognostic factor
Oberstadt et al. BMC Cancer 2013, 13:617
/>
Page 11 of 14
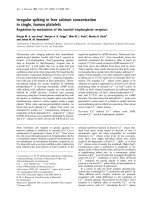
Figure 3 Correlation analyses of ABCG2, MGMT and ABCB1
promoter methylation in primary tumors and relapses of 17
GBM patients. (A) Correlation analysis for the median ABCG2
promoter methylation (Spearman’s rank correlation coefficient: 0.804,
p < 0.001). (B) Correlation analysis for the median MGMT promoter
methylation (Spearman’s rank correlation coefficient: 0.42, p = 0.09).
(C) Correlation analysis for the median ABCB1 promoter methylation
(Spearman’s rank correlation coefficient: 0.140, p = 0.59).
[6,17,19], we additionally investigated different aspects
of the MGMT promoter methylation to prove the reliability of our methylation data. Thus, we performed a
correlation analysis of MGMT promoter methylation
and MGMT expression in a subgroup of 20 GBM patients for which MGMT mRNA expression data have
been available. A significant negative correlation between MGMT promoter methylation and MGMT expression was seen as already predicted by previous
studies [20,21]. Furthermore, we found a highly significant elevation of MGMT promoter methylation in
GBMs compared to normal brain. In agreement with a
previous study [19] we also detected only a marginal
MGMT promoter methylation in non-neoplastic brain
samples and a significantly increased MGMT promoter
methylation in our GBM.
Moreover, we investigated the MGMT C-56 T SNP, because it is located in the enhancer region of the MGMT
gene only 18 bp downstream from the analyzed MGMT
CpG site. A significantly higher MGMT promoter methylation in carriers of the T allele has been described recently
in glioblastoma [24], diffuse large B-cell lymphoma [37],
colorectal carcinoma [25,26], pleural mesothelioma [27],
and lung cancer [28]. In our patient cohort we could confirm a significant higher MGMT methylation level in patients with the T allele than in C-56C wildtype patients
underlining a precise measurement of the MGMT promoter methylation level in our study. Further, this would
also imply that patients with the T allele show a minor
MGMT expression and thus should have a better response to temozolomide. Contrary to this, we could not
find any relation of the C-56 T MGMT polymorphism to
overall survival of our patient cohort, again arguing
against a fundamental role of MGMT in the prognosis of
glioblastoma patients as seen by our MGMT promoter
methylation analysis.
In addition to MGMT, we studied ABCB1 promoter
methylation because ABCB1 is significantly expressed in
glioma and discussed as a potential resistance factor [7].
Additionally, for acute lymphocytic leukaemia the
methylation of ABCB1 was associated with a trend toward a better OS [38], while in patients with bronchioloalveolar carcinoma no correlation between ABCB1
methylation status and patients’ OS was observed [39].
To date, no study analyzing ABCB1 promoter
Oberstadt et al. BMC Cancer 2013, 13:617
/>
methylation and its relation to ABCB1 expression and
OS of glioblastoma patients is reported. Our new established pyrosequencing assay showed a high correlation
of the methylation degree of both analyzed CpG sites
with each other similar to the ABCG2 methylation assay.
Despite a significantly higher ABCB1 methylation in
GBM samples of our cohort, the ABCB1 methylation
level was not associated with the OS of GBM patients
and was not significantly related to the ABCB1 expression. Similarly, an ABCB1 promoter hypermethylation
was shown in MCF-7 human breast cancer cells [40]
and in human prostate cancer compared with benign
prostate hypertrophy [41]. Moreover, a significantly
higher methylation ratio for the ABCB1 promoter in
gastric cancer samples than for non-neoplastic mucosa
has been reported [42]. The prostate cancer study detected a significant correlation of ABCB1 promoter
hypermethylation with worse clinicopathological features
[41]. However, both published ABCB1 methylation studies did not analyze any association with patient’s overall
survival.
A further drug resistance gene we decided to analyze
was ABCG2, because this efflux transporter was found
to be expressed in glioma stem cells as well as in endothelial cells of the large vessels of glioma tissue. Similarly
to ABCB1, ABCG2 could mediate chemotherapeutic resistance by the efflux of cytostatics [5]. In addition, an
inverse correlation between promoter methylation of
ABCG2 and its expression in lung cancer and multiple
myeloma has been determined [9,22]. To establish a pyrosequencing assay for ABCG2 we used a study of
Turner and colleagues [22] as reference in order to
analyze the same CpG sites in the ABCG2 promoter, because methylation of these CpG sites was shown to be
associated with ABCG2 expression in multiple myeloma.
Moreover, a recent study investigated the same CpG
sites of the ABCG2 promoter showing differences in
methylation levels between three renal carcinoma cell
lines [23].
In our study, a positive correlation of the ABCG2
methylation level in primary tumor and relapse of the
same patient was observed, showing a consistent ABCG2
methylation status before and after treatment with
radio- and chemotherapy. Interestingly, no association
between ABCG2 promoter methylation and ABCG2 expression or overall survival was seen. The missing effect
of ABCG2 methylation on GBM patients’ survival could
be explained by the fact that temozolomide, which is the
most applied cytostatic for patients with GBM, is not a
substrate of ABCG2 [43], and thus modulation of
ABCG2 expression should not affect the therapy and
survival of GBM patients. Furthermore, for each pyrosequencing assay we assessed a limited number of CpGs
(five CpGs for MGMT; two CpGs for ABCB1; three
Page 12 of 14
CpGs for ABCG2). Thus, there could be the possibility
that CpG sites of the methylation assays, which have not
been tested in this study, could have a prognostic value
for the GBM patients. However, we interrogated CpG
sites, which have been tested in parts before in other
publications, as the MGMT CpG sites [6,14,18] and the
ABCG2 CpG sites [22] or have been specifically described as prognostic relevant such as our investigated
CpG site 4 of the MGMT assay [14]. Furthermore, previous authors investigated a comparable number of CpG
sites for MGMT [14]. Nevertheless, it may be useful to
test also a larger number of CpG sites for the ABCB1
and ABCG2 assays in the future, e.g. using a HumanMethylation450 (HM-450 K) BeadChip [44].
Conclusions
In summary, our study represents a combined investigation of promoter methylation and gene polymorphisms of
the pivotal drug resistance genes MGMT, ABCB1 and
ABCG2 in glioblastoma multiforme. Our data argue
against any relevant impact of MGMT, ABCB1 or ABCG2
promoter methylation on overall survival of glioblastoma
patients. However, we could detect a significant negative
correlation between MGMT promoter methylation and
MGMT expression, a markedly elevated MGMT and
ABCB1 promoter methylation in glioblastoma specimens
and a significant correlation between MGMT methylation
and the MGMT C-56 T polymorphism.
Additional file
Additional file 1: PCR amplification of promoter regions of interest.
Figure S1. Illustration of the MGMT promoter sequence analyzed by
pyrosequencing for determination of the methylation status. Figure S2.
Illustration of the ABCB1 promoter sequence analyzed by
pyrosequencing for determination of the methylation status. Figure S3.
Illustration of the ABCG2 promoter sequence analyzed by
pyrosequencing for determination of the methylation status. PCR-RFLP
amplification details. Figure S4A-F. Real-Time PCR efficiencies. Figure S5.
Grading of MGMT methylation levels according to Dunn et al., 2009.
Tables S1A-C. Quantitative accuracy of methylation assays.
Figure S6.1-4: Figure S6.1. mRNA expression of CD133, GFAP and
PECAM. Figure S6.2. Correlation analysis of CD133, GFAP and PECAM
with MGMT expression. Figure S6.3. Correlation analysis of CD133, GFAP
and PECAM with ABCB1 expression. Figure S6.4. Correlation analysis of
CD133, GFAP and PECAM with ABCG2 expression. Figure S7. Comparison
of housekeeping genes. Figure S8 and Table S2. Data of
Methylation-specific PCR (MSP) for MGMT according to Hegi et al., 2005.
Abbreviations
ABC: ATP-binding cassette; MGMT: O6-methylguanine-DNA methyltransferase;
CpG: Cytidine phosphate guanosine; GBM: Glioblastoma multiforme WHO °IV;
PCR: Polymerase chain reaction; WHO: World Health Organization.
Competing interests
The authors declare that they have no competing interests.
Authors’ contributions
MCO, SBM, CR, DR, HWSS, and HKK participated in research design. MCO,
SBM, KH, SH, HM, JPZ, HB and ANW conducted experiments. MCO, SBM, KW,
Oberstadt et al. BMC Cancer 2013, 13:617
/>
SV, and WH performed data analysis. MCO, SBM, KW, IC and HKK wrote or
contributed to the writing of the manuscript. All authors read and approved
the final manuscript.
Acknowledgements
We thank Alexander Kayser and Franziska Janke for the excellent support
establishing the pyrosequencing assays. This work was supported by the
German Federal Ministry for Education and Research [Grant 03IP612]
(Innoprofile). M.C.O. received a scholarship of the Gerhard Domagk Program,
funded by the Faculty of Medicine, Greifswald, Germany, and was further
supported by the German National Academic Foundation, funded by the
German Federal Ministry for Education and Research.
Author details
1
Department of Pharmacology, Ernst-Moritz-Arndt-University, Greifswald,
Germany. 2Department of Epidemiology of Health Care and Community
Health, Ernst-Moritz-Arndt-University, Greifswald, Germany. 3Department of
Neuropathology, Ernst-Moritz-Arndt-University, Greifswald, Germany.
4
Department of Neurosurgery, Ernst-Moritz-Arndt-University, Greifswald,
Germany. 5Department of Experimental and Clinical Pharmacology,
University Hospital Schleswig-Holstein, Kiel, Germany.
Received: 22 February 2013 Accepted: 20 December 2013
Published: 31 December 2013
References
1. Piperi C, Themistocleous MS, Papavassiliou GA, Farmaki E, Levidou G,
Korkolopoulou P, Adamopoulos C, Papavassiliou AG: High incidence of
MGMT and RARbeta promoter methylation in primary glioblastomas:
association with histopathological characteristics, inflammatory
mediators and clinical outcome. Mol Med 2010, 16(1–2):1–9.
2. Louis DN, Ohgaki H, Wiestler OD, Cavenee WK, Burger PC, Jouvet A,
Scheithauer BW, Kleihues P: The 2007 WHO classification of tumours of
the central nervous system. Acta Neuropathol 2007, 114(2):97–109.
3. Reifenberger G, Collins VP: Pathology and molecular genetics of astrocytic
gliomas. J Mol Med 2004, 82(10):656–670.
4. Rich JN, Hans C, Jones B, Iversen ES, McLendon RE, Rasheed BK, Dobra A,
Dressman HK, Bigner DD, Nevins JR, et al: Gene expression profiling
and genetic markers in glioblastoma survival. Cancer Res 2005,
65(10):4051–4058.
5. Bleau AM, Huse JT, Holland EC: The ABCG2 resistance network of
glioblastoma. Cell Cycle 2009, 8(18):2936–2944.
6. Hegi ME, Diserens AC, Gorlia T, Hamou MF, de Tribolet N, Weller M, Kros JM,
Hainfellner JA, Mason W, Mariani L, et al: MGMT gene silencing and
benefit from temozolomide in glioblastoma. N Engl J Med 2005, 352
(10):997–1003.
7. Demeule M, Shedid D, Beaulieu E, del Maestro RF, Moghrabi A, Ghosn PB,
Moumdjian R, Berthelet F, Beliveau R: Expression of multidrug-resistance
P-glycoprotein (MDR1) in human brain tumors. Int J Cancer 2001, 93(1):62–66.
8. Nakayama M, Wada M, Harada T, Nagayama J, Kusaba H, Ohshima K, Kozuru
M, Komatsu H, Ueda R, Kuwano M: Hypomethylation status of CpG sites at
the promoter region and overexpression of the human MDR1 gene in
acute myeloid leukemias. Blood 1998, 92(11):4296–4307.
9. Nakano H, Nakamura Y, Soda H, Kamikatahira M, Uchida K, Takasu M,
Kitazaki T, Yamaguchi H, Nakatomi K, Yanagihara K, et al: Methylation status
of breast cancer resistance protein detected by methylation-specific
polymerase chain reaction analysis is correlated inversely with its
expression in drug-resistant lung cancer cells. Cancer 2008,
112(5):1122–1130.
10. Jiang ZP, Xu P, Liu RR, Li HD, Wang GP, Zhao XL, Chen FP: Correlation
between MDR1 methylation status in the promoter region and MDR1
genetic polymorphism in 194 healthy Chinese Han subjects.
Pharmacogenomics 2008, 9(12):1801–1808.
11. Imai Y, Nakane M, Kage K, Tsukahara S, Ishikawa E, Tsuruo T, Miki Y,
Sugimoto Y: C421A polymorphism in the human breast cancer resistance
protein gene is associated with low expression of Q141K protein and
low-level drug resistance. Mol Cancer Ther 2002, 1(8):611–616.
12. Morisaki K, Robey RW, Ozvegy-Laczka C, Honjo Y, Polgar O, Steadman K,
Sarkadi B, Bates SE: Single nucleotide polymorphisms modify the
transporter activity of ABCG2. Cancer Chemother Pharmacol 2005,
56(2):161–172.
Page 13 of 14
13. Mikeska T, Bock C, El-Maarri O, Hubner A, Ehrentraut D, Schramm J, Felsberg
J, Kahl P, Buttner R, Pietsch T, et al: Optimization of quantitative MGMT
promoter methylation analysis using pyrosequencing and combined
bisulfite restriction analysis. J Mol Diagn 2007, 9(3):368–381.
14. Karayan-Tapon L, Quillien V, Guilhot J, Wager M, Fromont G, Saikali S,
Etcheverry A, Hamlat A, Loussouarn D, Campion L, et al: Prognostic value
of O6-methylguanine-DNA methyltransferase status in glioblastoma
patients, assessed by five different methods. J Neurooncol 2010,
97(3):311–322.
15. Hermes M, Geisler H, Osswald H, Riehle R, Kloor D: Alterations in
S-adenosylhomocysteine metabolism decrease O6-methylguanine
DNA methyltransferase gene expression without affecting
promoter methylation. Biochem Pharmacol 2008, 75(11):2100–2111.
16. Brescia P, Ortensi B, Fornasari L, Levi D, Broggi G, Pelicci G: CD133 is
essential for glioblastoma stem cell maintenance. Stem Cells 2013,
31(5):857–869.
17. Weller M, Felsberg J, Hartmann C, Berger H, Steinbach JP, Schramm J,
Westphal M, Schackert G, Simon M, Tonn JC, et al: Molecular predictors of
progression-free and overall survival in patients with newly diagnosed
glioblastoma: a prospective translational study of the German Glioma
Network. J Clin Oncol 2009, 27(34):5743–5750.
18. Esteller M, Garcia-Foncillas J, Andion E, Goodman SN, Hidalgo OF, Vanaclocha
V, Baylin SB, Herman JG: Inactivation of the DNA-repair gene MGMT and the
clinical response of gliomas to alkylating agents. N Engl J Med 2000,
343(19):1350–1354.
19. Dunn J, Baborie A, Alam F, Joyce K, Moxham M, Sibson R, Crooks D,
Husband D, Shenoy A, Brodbelt A, et al: Extent of MGMT promoter
methylation correlates with outcome in glioblastomas given
temozolomide and radiotherapy. Br J Cancer 2009, 101(1):124–131.
20. Qian XC, Brent TP: Methylation hot spots in the 5′ flanking region denote
silencing of the O6-methylguanine-DNA methyltransferase gene.
Cancer Res 1997, 57(17):3672–3677.
21. Watts GS, Pieper RO, Costello JF, Peng YM, Dalton WS, Futscher BW:
Methylation of discrete regions of the O6-methylguanine DNA
methyltransferase (MGMT) CpG island is associated with
heterochromatinization of the MGMT transcription start site and
silencing of the gene. Mol Cell Biol 1997, 17(9):5612–5619.
22. Turner JG, Gump JL, Zhang C, Cook JM, Marchion D, Hazlehurst L, Munster
P, Schell MJ, Dalton WS, Sullivan DM: ABCG2 expression, function, and
promoter methylation in human multiple myeloma. Blood 2006, 108
(12):3881–3889.
23. To KK, Zhan Z, Bates SE: Aberrant promoter methylation of the ABCG2
gene in renal carcinoma. Mol Cell Biol 2006, 26(22):8572–8585.
24. McDonald KL, Rapkins RW, Olivier J, Zhao L, Nozue K, Lu D, Tiwari S,
Kuroiwa-Trzmielina J, Brewer J, Wheeler HR, et al: The T genotype of the
MGMT C>T (rs16906252) enhancer single-nucleotide polymorphism
(SNP) is associated with promoter methylation and longer survival in
glioblastoma patients. Eur J Cancer 2013, 49(2):360–368.
25. Ogino S, Hazra A, Tranah GJ, Kirkner GJ, Kawasaki T, Nosho K, Ohnishi M,
Suemoto Y, Meyerhardt JA, Hunter DJ, et al: MGMT germline
polymorphism is associated with somatic MGMT promoter
methylation and gene silencing in colorectal cancer.
Carcinogenesis 2007, 28(9):1985–1990.
26. Hawkins NJ, Lee JH, Wong JJ, Kwok CT, Ward RL, Hitchins MP: MGMT
methylation is associated primarily with the germline C > T SNP
(rs16906252) in colorectal cancer and normal colonic mucosa.
Mod Pathol 2009, 22(12):1588–1599.
27. Kristensen LS, Nielsen HM, Hager H, Hansen LL: Methylation of MGMT in
malignant pleural mesothelioma occurs in a subset of patients and is
associated with the T allele of the rs16906252 MGMT promoter SNP.
Lung Cancer 2011, 71(2):130–136.
28. Leng S, Bernauer AM, Hong C, Do KC, Yingling CM, Flores KG, Tessema M,
Tellez CS, Willink RP, Burki EA, et al: The A/G allele of rs16906252 predicts
for MGMT methylation and is selectively silenced in premalignant
lesions from smokers and in lung adenocarcinomas. Clin Cancer Res 2011,
17(7):2014–2023.
29. Hoffmeyer S, Burk O, von Richter O, Arnold HP, Brockmoller J, Johne A,
Cascorbi I, Gerloff T, Roots I, Eichelbaum M, et al: Functional polymorphisms
of the human multidrug-resistance gene: multiple sequence variations and
correlation of one allele with P-glycoprotein expression and activity in vivo.
Proc Natl Acad Sci U S A 2000, 97(7):3473–3478.
Oberstadt et al. BMC Cancer 2013, 13:617
/>
Page 14 of 14
30. Costa BM, Caeiro C, Guimaraes I, Martinho O, Jaraquemada T, Augusto I,
Castro L, Osorio L, Linhares P, Honavar M, et al: Prognostic value of MGMT
promoter methylation in glioblastoma patients treated with
temozolomide-based chemoradiation: a Portuguese multicentre study.
Oncol Rep 2010, 23(6):1655–1662.
31. Martinez R, Martin-Subero JI, Rohde V, Kirsch M, Alaminos M, Fernandez AF,
Ropero S, Schackert G, Esteller M: A microarray-based DNA methylation
study of glioblastoma multiforme. Epigenetics 2009, 4(4):255–264.
32. Lu C, Shervington A: Chemoresistance in gliomas. Mol Cell Biochem 2008,
312(1–2):71–80.
33. Andersson U, Malmer B, Bergenheim AT, Brannstrom T, Henriksson R:
Heterogeneity in the expression of markers for drug resistance in brain
tumors. Clin Neuropathol 2004, 23(1):21–27.
34. Schaich M, Kestel L, Pfirrmann M, Robel K, Illmer T, Kramer M, Dill C,
Ehninger G, Schackert G, Krex D: A MDR1 (ABCB1) gene single nucleotide
polymorphism predicts outcome of temozolomide treatment in
glioblastoma patients. Ann Oncol 2009, 20(1):175–181.
35. Derks S, Lentjes MH, Hellebrekers DM, de Bruine AP, Herman JG, van
Engeland M: Methylation-specific PCR unraveled. Cell Oncol 2004,
26(5–6):291–299.
36. Christians A, Hartmann C, Benner A, Meyer J, von Deimling A, Weller M,
Wick W, Weiler M: Prognostic value of three different methods of MGMT
promoter methylation analysis in a prospective trial on newly diagnosed
glioblastoma. PLoS One 2012, 7(3):e33449.
37. Kristensen LS, Treppendahl MB, Asmar F, Girkov MS, Nielsen HM, Kjeldsen
TE, Ralfkiaer E, Hansen LL, Gronbaek K: Investigation of MGMT and DAPK1
methylation patterns in diffuse large B-cell lymphoma using allelic
MSP-pyrosequencing. Sci Rep 2013, 3:2789.
38. Garcia-Manero G, Bueso-Ramos C, Daniel J, Williamson J, Kantarjian HM, Issa
JP: DNA methylation patterns at relapse in adult acute lymphocytic
leukemia. Clin Cancer Res 2002, 8(6):1897–1903.
39. Gao P, Yang X, Xue YW, Zhang XF, Wang Y, Liu WJ, Wu XJ: Promoter
methylation of glutathione S-transferase pi1 and multidrug resistance
gene 1 in bronchioloalveolar carcinoma and its correlation with DNA
methyltransferase 1 expression. Cancer 2009, 115(14):3222–3232.
40. David GL, Yegnasubramanian S, Kumar A, Marchi VL, de Marzo AM, Lin X,
Nelson WG: MDR1 promoter hypermethylation in MCF-7 human breast
cancer cells: changes in chromatin structure induced by treatment with
5-Aza-cytidine. Cancer Biol Ther 2004, 3(6):540–548.
41. Enokida H, Shiina H, Igawa M, Ogishima T, Kawakami T, Bassett WW, Anast
JW, Li LC, Urakami S, Terashima M, et al: CpG hypermethylation of MDR1
gene contributes to the pathogenesis and progression of human
prostate cancer. Cancer Res 2004, 64(17):5956–5962.
42. Tahara T, Arisawa T, Shibata T, Yamashita H, Yoshioka D, Hirata I: Effect of
promoter methylation of multidrug resistance 1 (MDR1) gene in gastric
carcinogenesis. Anticancer Res 2009, 29(1):337–341.
43. Bleau AM, Hambardzumyan D, Ozawa T, Fomchenko EI, Huse JT, Brennan
CW, Holland EC: PTEN/PI3K/Akt pathway regulates the side population
phenotype and ABCG2 activity in glioma tumor stem-like cells.
Cell Stem Cell 2009, 4(3):226–235.
44. Bady P, Sciuscio D, Diserens AC, Bloch J, van den Bent MJ, Marosi C, Dietrich
PY, Weller M, Mariani L, Heppner FL, et al: MGMT methylation analysis of
glioblastoma on the Infinium methylation BeadChip identifies two
distinct CpG regions associated with gene silencing and outcome,
yielding a prediction model for comparisons across datasets, tumor
grades, and CIMP-status. Acta Neuropathol 2012, 124(4):547–560.
doi:10.1186/1471-2407-13-617
Cite this article as: Oberstadt et al.: Epigenetic modulation of the drug
resistance genes MGMT, ABCB1 and ABCG2 in glioblastoma multiforme.
BMC Cancer 2013 13:617.
Submit your next manuscript to BioMed Central
and take full advantage of:
• Convenient online submission
• Thorough peer review
• No space constraints or color figure charges
• Immediate publication on acceptance
• Inclusion in PubMed, CAS, Scopus and Google Scholar
• Research which is freely available for redistribution
Submit your manuscript at
www.biomedcentral.com/submit